SPEED 2.0: Authoritative Environmental Remediation Mapping in New York City

Application Includes the use of both Open Source Software and Open Data Content

A lot of great geospatial projects and content are coming out of the NYC OpenData ecosystem.  In the same space  throughout the city is the deployment of applications and viewers using open source software.  One such app is the Searchable Property Environmental E-Database SPEED 2.0, built on top of CARTO and published by the Mayor’s Office of Environmental Remediation (OER).  I was introduced to the application via an online presentation organized by GISMO in March of this year.

SPEED 2.0 is an impressive collection of local/city, state, and federal geospatial datasets wrapped into one application for the purpose of helping individuals identify environmental issues – both current and past – on and/or adjacent to specific properties in New York City.  It is a sister application to the NYC Office of Environmental Remediation’s Environmental Project Information Center (EPIC) that provides information about the cleanup of brownfield sites across the city.

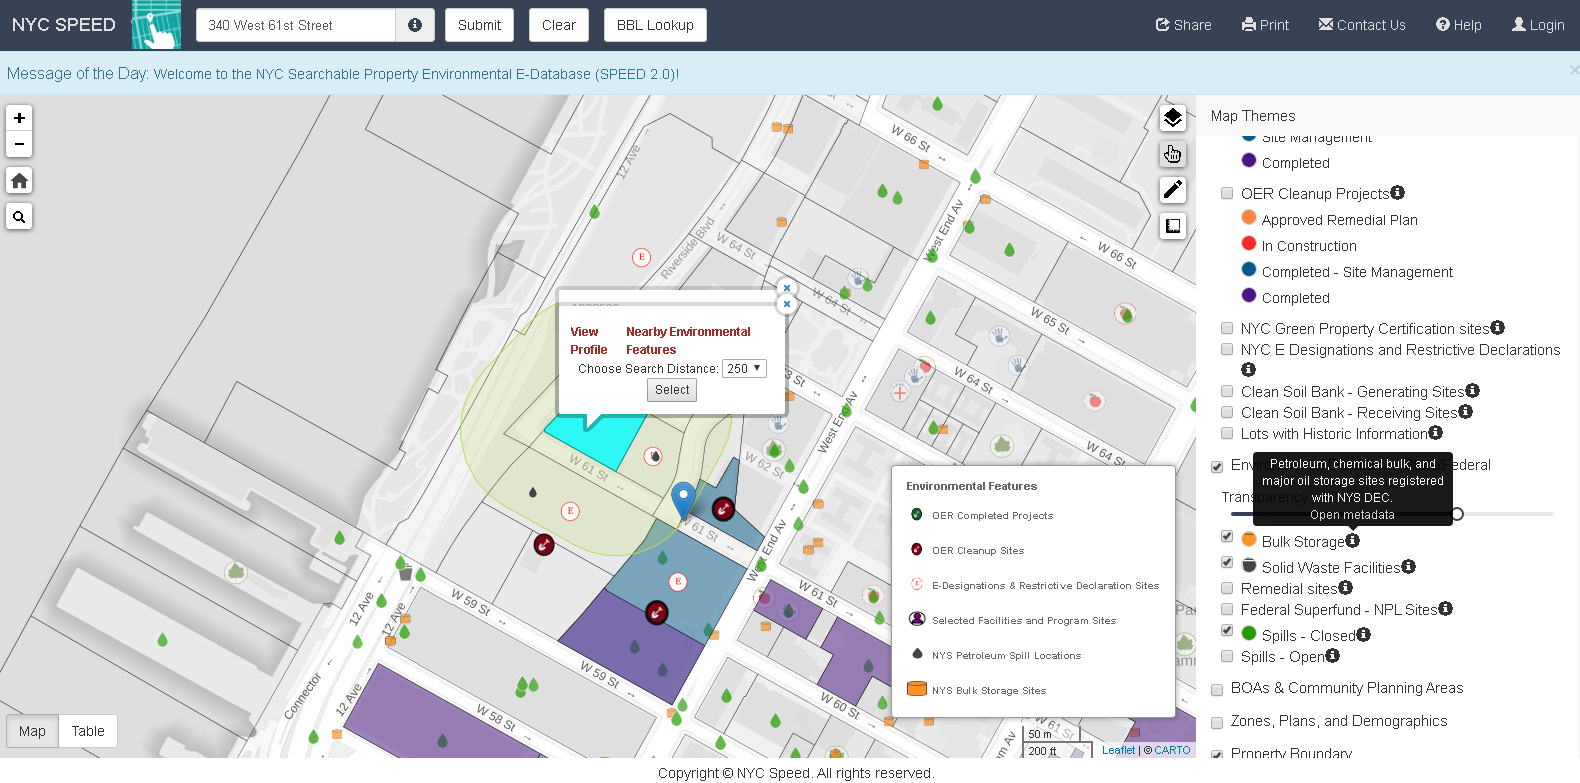
Individual parcels can be buffered by either 250’ or 500’ to show the proximity of adjacent parcels with current or past environmental issues, permitting, or contamination issues. Access to pertinent metadata is readily available.

Background

According to Lee Ilan, Chief of Planning in the Mayor’s Office of Environmental Remediation, the first version of SPEED was launched in 2009 as a web map with limited functionality and developed with PostGIS.  It was launched in support of the newly created office’s focus on the cleanup of brownfields across the city.  However, support for the initial application waned over the next several years with minimal new content added.  Post – SuperStorm Sandy provided new funding through the U.S. Housing and Urban Development (HUD) Community Development Block Grant Disaster Recovery Program which OER secured and offered the opportunity for a major rewrite and update of the original application. SPEED 2.0 was designed by their vendor Applied Geographics (AppGeo) to be a cloud-based application.  Originally the application was managed by the vendor but since December 2020, OER has assumed managing the app in the Google Cloud on their own.

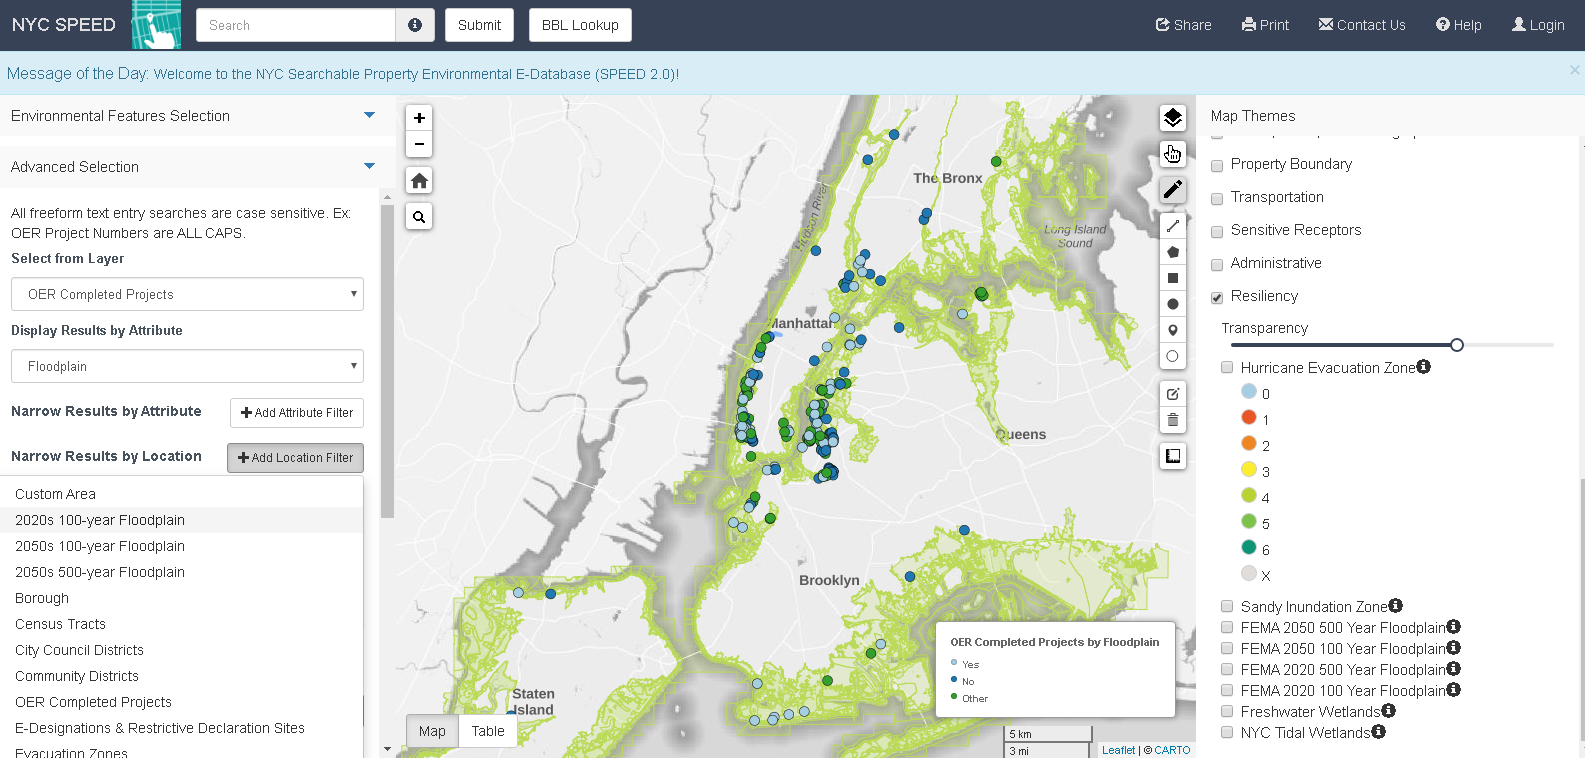
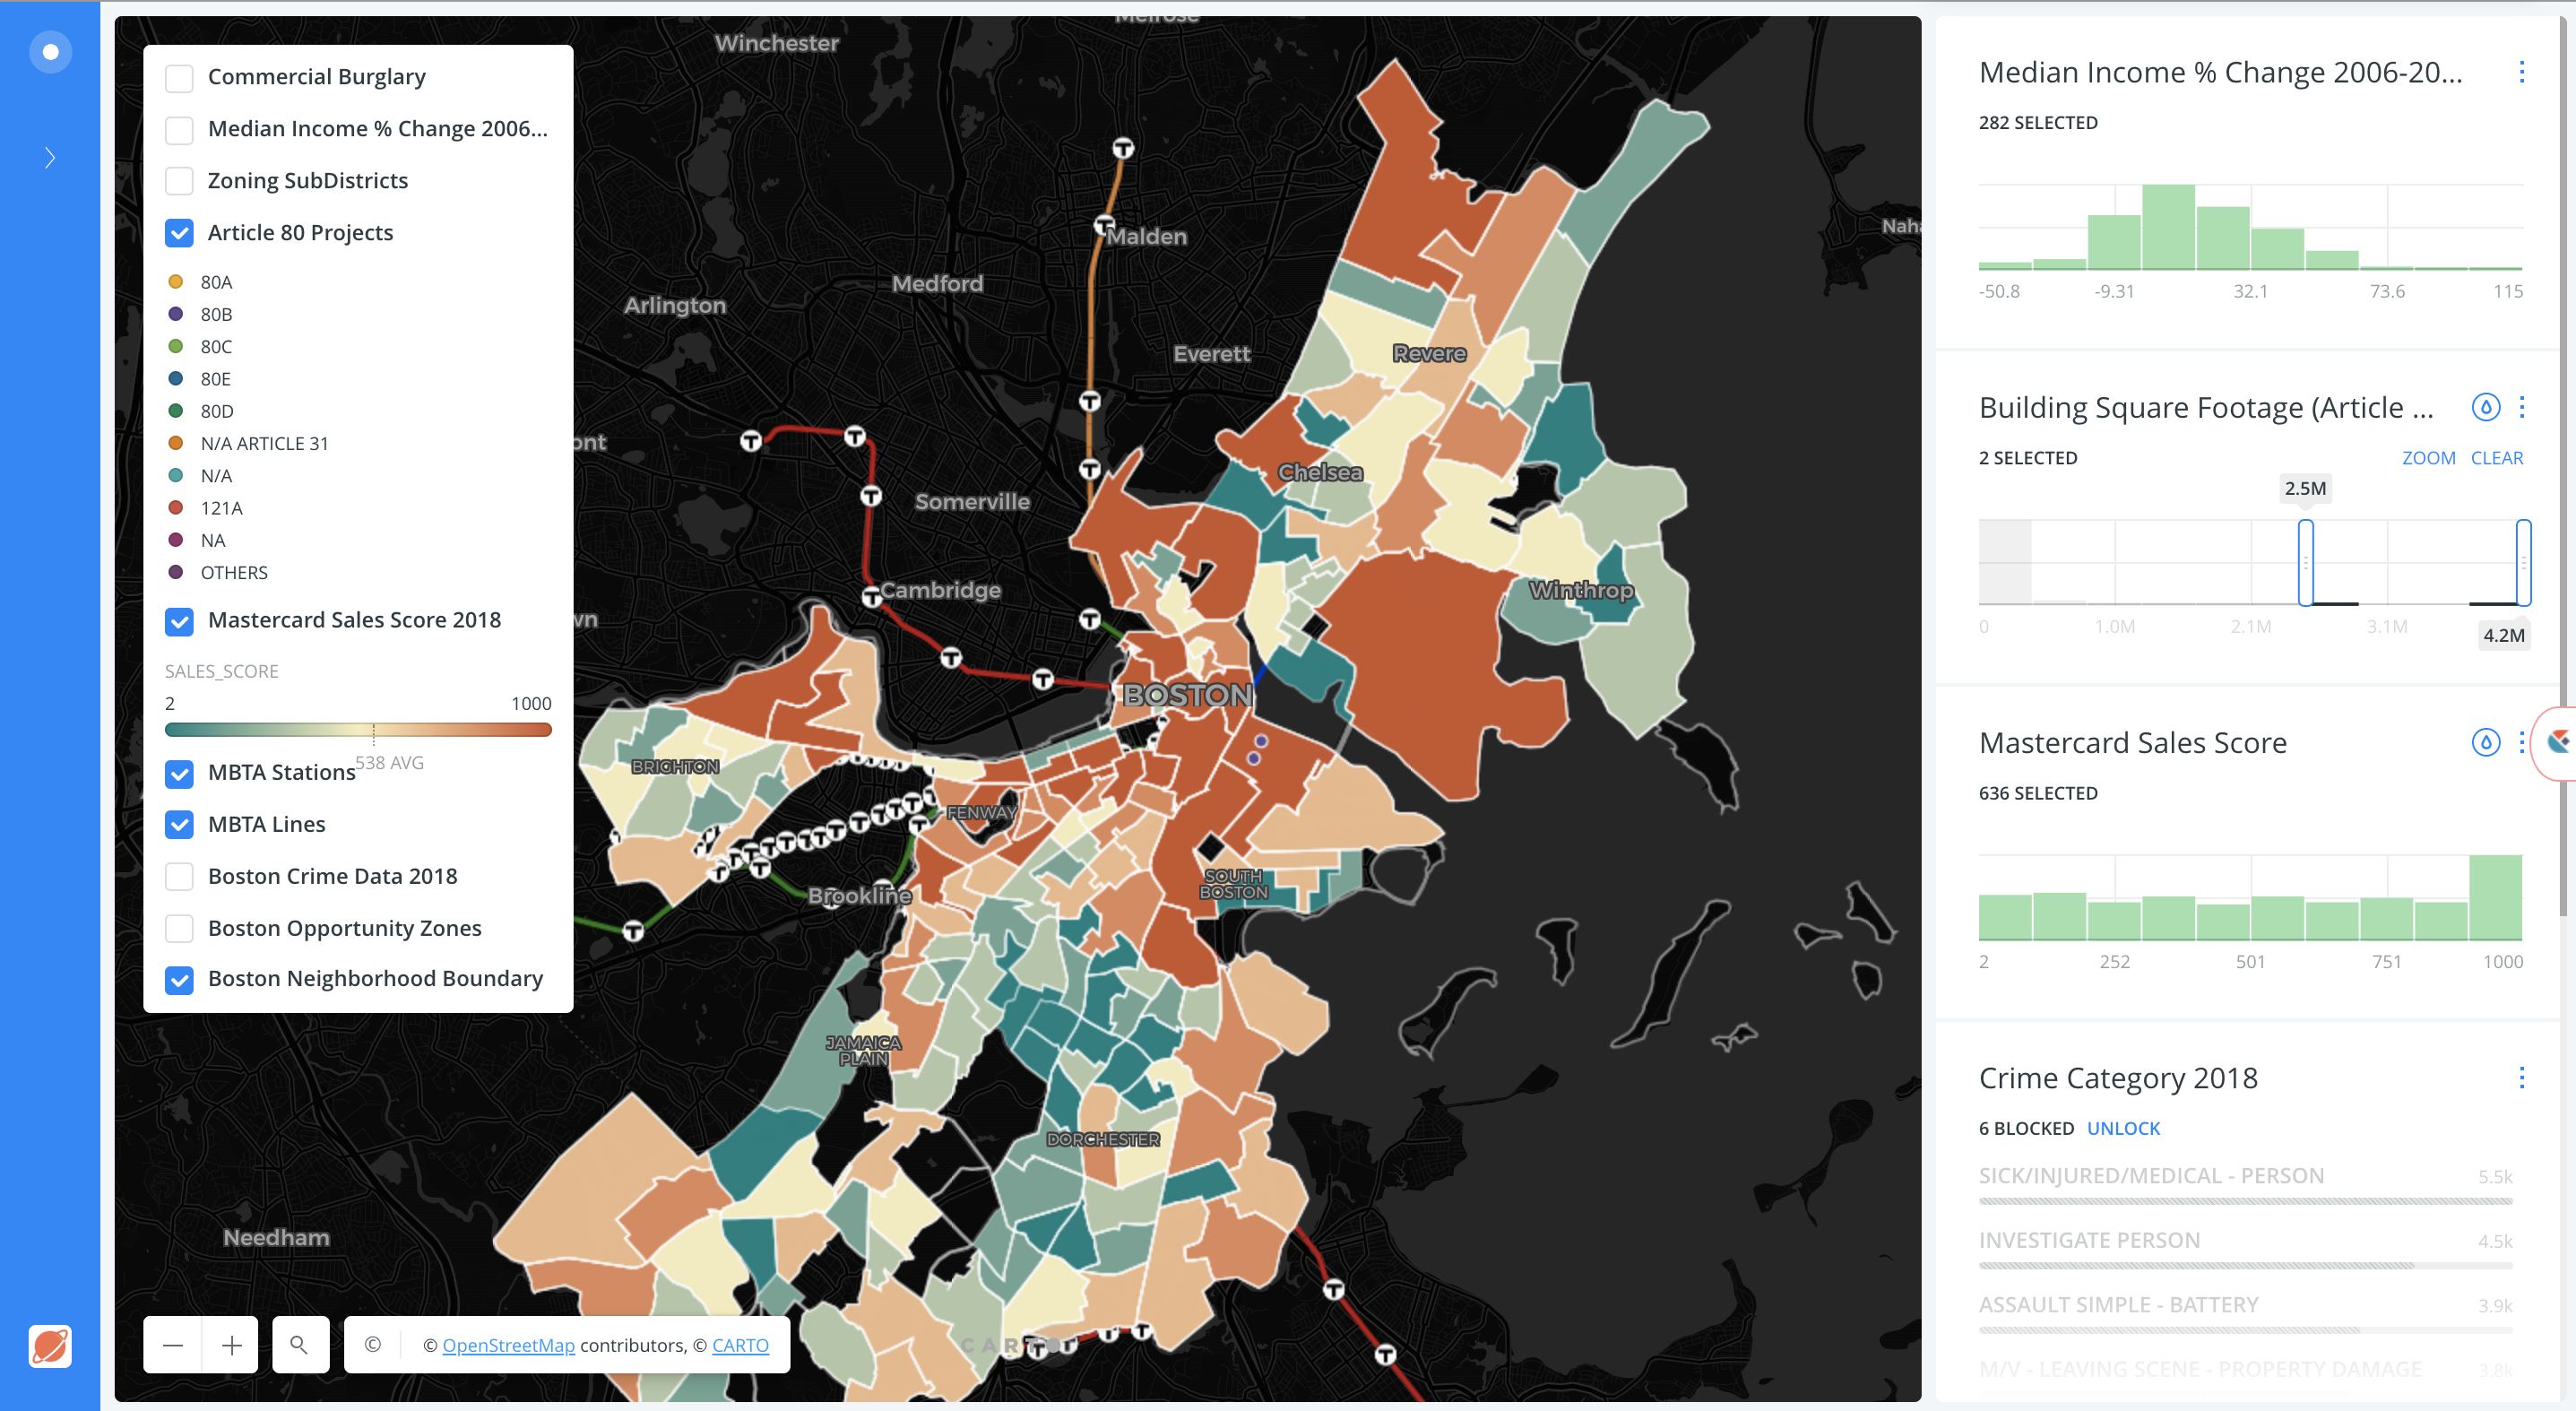
The application also includes advanced search functions. For example, in the left-hand column using the filter options, I was able to identify only those OER projects in FEMA 100-year floodplains. Query is rendered in the map viewer.

Carto software is helpful by providing a very modern user interface that generates layers which are compatible with Leaflet”, notes OER’s IT Director Maksim Kleban.  “It makes the transition from uploading our layers, and turning them into fully functional, interactive maps seamless.”  AppGeo proposed the use of CARTO to OER which has since found the software to be user friendly and simple to use with standalone online applications. Carto is licensed annually for the amount of space and resources needed for the SPEED application and works very similar to any other cloud solution, like Amazon Web Services, Microsoft Azure (AWS), or Google Cloud.

Currently there are about 50-55 datasets included in the SPEED viewer right now. The large majority are OER datasets which are updated automatically by syncing with data from external agencies’ datasets on Open Data, or from OER’s internal data sources.  Generally, they each have an independent update schedule which is also automated.   The data is managed mostly by automatic updates on OER’s server which communicates directly to Carto through an API. For layers which are not on an automatic update schedule, OER uses either a custom-designed interface or manually uploads data into Carto’s online platform.

User can search the SPEED database using a standardized address, common place names such as Bryant Park or Madison Square Garden (btw – even “MSG”!) or borough, block and lot (BBL) numbers.  The application also includes mark-up, feature transparency, and sharing tools,  great HELP documentation and easy access to metadata (as illustrated in the first image above) which is very helpful given the bevy of similar datasets from local, state and federal datasets accessible in the app.  Historical aerial photography from 1996, 1951, and 1924 enables users to identify previous land cover which can be an indicator of the presence of historic fill.  A “Sensitive Receptors layer includes the locations of facilities (schools, parks, libraries, health care, etc) where occupants are more susceptible to the effects of environmental contamination.

It continues to be a work in progress” says Ilan, “in the future we would like to also have functionalities for registered users. We also would like to add more analysis capabilities where new layers can be easily integrated with advanced search features”. 

SPEED 2.0 Featured on NYC Open Data Week

For the first time ever, OER participated in NYC Open Data Week in early March.  For those looking for a deeper dive into SPEED 2.0, use the link below to listen to Lee’s presentation.

Contact:

Ms. Lee Ilan
Chief of Planning
NYC Mayor’s Office of Environmental Remediation
lilan@cityhall.nyc.gov

Geospatial Student Spotlight: Ge (Jeff) Pu

Academic Institution:

SUNY College of Environmental Science and Forestry
Department of Environmental Resources Engineering
Ph.D Environmental Resource Engineering (Dec 2020)

Drexel University
Department of Civil and Environmental Engineering
B.S. & M.S. Environmental Engineering

Research Focus:

Ge’s doctoral research focused on monitoring riparian vegetation conditions overtime and quantifying correlations to selected water quality variables. In addition, he focused on quantifying the impact of riparian vegetation presence on river channel boundary changes. Such riparian vegetation environments have a significant role in filtering contamination and maintaining water quality in riverine and stream systems. His research involved the use of high spatial resolution aerial photos to detect and delineate riparian vegetation status. Riparian ecosystems across New York State remain under stress from climate change, agricultural practices and urbanization.

Study Area and Background:

Ge’s study areas included the Genesee River which originates in Gold, PA flowing north to Rochester, NY and ultimately into Lake Ontario.   Land cover in the study area is dominated predominately by agriculture and forest, with smaller amounts of developed land, including a mixture of residential, commercial, transportation, and other non-developed lands.  Various parts of the Genesee River are currently listed as impaired on Section 303 (d) of the Federal Clean Water Act based on the presence of various pollutants, which includes phosphorus, sedimentation, oxygen demand, and pathogens.  Riparian buffers along the Genesee River play a significant role in improving the overall condition of the river and help combat many of the water quality related problems through filtering various contaminations, trapping sedimentation and ultimately improving river water quality.

The Mount Morris gravity dam on the Genesee River was utilized as a separation point when comparing the results of riparian vegetation indices. This separation formed a logical break since upstream of the dam the channel follows its natural path, whereas flow downstream of the dam is regulated by the dam instead of natural flow regimes.  An interactive web map of the study area is here.

The Genesee River watershed stretches from Lake Ontario in the north to Northern Pennsylvania in the south.

Data and Software:

 Data:  Central to Pu’s research was the use of the Google Earth Engine (GEE) which includes two freely accessible image programs: (1) United States Department of Agriculture National Agriculture Imagery Program (NAIP) imagery, and (2) Landsat products.  The NAIP images are airborne color-infrared orthorectified images acquired at 1 meter ground sampling distance. This fine spatial resolution enables interpolation of detailed information on the boundaries of river channels and riparian vegetation. The NAIP program collects imagery on a regular basis, with images of the study area available from 2003–2015. GEE provides access to Landsat 5 and 8 8-day Normalized Difference Vegetation Index (NDVI) and Enhanced Vegetation Index (EVI) composites.                                                     

Other geospatial datasets also utilized included USGS water quality data, and (2) National Oceanic and Atmospheric Administration (NOAA) weather data. Downstream water quality data was collected by the USGS in the Genesee River at the Ford Street Bridge in Rochester, NY and downloaded through the USGS Water Data for the Nation.  Parameters collected include water temperature, specific conductivity, pH, turbidity and dissolved oxygen.  Daily weather data is collected by the National Oceanic and Atmospheric Administration (NOAA) at three airports within the watershed: Greater Rochester International Airport, Cattaraugus County Olean Airport, and Dansville Municipal Airport. Weather parameters recorded include daily mean precipitation and daily cumulative air temperature. Weather parameters across the three stations were averaged to eliminate micro climate effects. Water flow/gauge data provided by the U.S. Army Corps of Engineers.

 Software:  Data was examined and processed in a variety of desktop software packages and cloud platform including, as previously identified, Google Earth Engine as well as  ArcMap, QGIS and R.

 Project Findings:

This project developed a new method to extract multi-temporal riparian vegetation indices directly from satellite image composites which included five major steps: (1) Identifying the channel boundary, (2) creating a buffer around the channel, (3) classifying land cover within the riparian buffer, (4) converting pixel-based vegetation buffers to polygons, and (5) generating final riparian buffer boundaries.

Pu’s Genesee River riparian mapping was based on GEE’s multi-petabyte catalog of satellite imagery and geospatial datasets which are available for scientists, researchers, and developers to detect changes, map trends, and quantify differences on the Earth’s surface.

The project utilized GEE for both image processing and spatial analysis processes, along with some usage of QGIS.  GEE was found to provide an efficient means to perform environmental data monitoring because it eliminates the processing time and effort involved with downloading, sorting, and combining datasets in order to perform the calculations and other processes necessary to obtain time series vegetation index data calculations.

Findings indicate that downstream water temperature and dissolved oxygen have moderate to strong correlation to riparian vegetation index (magnitude of Spearman’s correlation coefficient generally above 0.5), while other water quality parameters do not. Water temperature was positively correlated with the vegetation index values, while dissolved oxygen was negatively correlated. There were no significant differences in terms of correlation between the two sections of the river.

Analyzing nearly a decade of imagery covering the Genesee River footprint, Pu’s research shows the meandering of both the main river channel and at major river bends both of which impact adjacent riparian habitats.

Overall, the study developed a new method to rapidly extract time series of riparian vegetation indices directly from satellite image composites.  In delineating the main channel of the Genesee River and mapping riparian vegetation within 90 meters of the channel the research observed the expected annual trends, where the index rises in the summer season while falling in the winter season.

Findings will be useful to riparian stakeholders and managers to conduct informed riparian vegetation management and restoration. Delineating riparian vegetation extent from higher resolution imagery allows one to identify riparian zones that have significant riparian removal or channel variations and to prioritize restoration sites considering both spatial and temporal scales. Results drawn from Pu’s research has been and will continue to be presented at local and international conferences for improving current riparian management approaches.

A more complete and detailed document on Pu’s research containing further discussion/analysis, statistics and graphs, and summary details can be downloaded here.

Google Earth Engine (GEE):

 Jeff’s extensive use of GEE as part of this doctoral work led to additional work which was primarily funded through AmericaView and SUNY-ESF.  Funded primarily through a grant from the U.S. Geological Survey, Ameriview is a consortium comprised of university-led, state-based consortia working together to sustain a network of state and local remote sensing scientists, educators, analysts, and technicians.   The state’s AmericanView affiliate is New York View   (NYView) which is administered through the Department of Environmental Resources Engineering (ERE) at SUNY-ESF.  The NYView academic consortium includes the State University of New York (SUNY) College of Environmental Science and Forestry (ESF), the Institute for Resource Information Sciences (IRIS) at Cornell University, SUNY Fredonia, and SUNY Plattsburgh.

Through this NYView project, Jeff developed a series of 16 free-to-access Google Earth Engine online training videos (available on YouTube) for the beginner to advanced which demonstrate applications to support teaching, research, and outreach in remote sensing and image processing.  GEE is a cloud-based platform that combines a catalog of satellite imagery and geospatial datasets with planetary-scale analysis capabilities. This platform is available for academic, non-profit, business, and government users to analyze and visualize the Earth’s surface.  He was able to also work closely with the Google Earth Engine development team which provided access for development and programming assistance.  A one-page summary of the NYView 2019-2020 Mini-Grant project can be downloaded here.

Summary:

Jeff is currently preparing for a postdoctoral research position. He hopes to become a professor in the future based on his of research and associated work in academia.  His research interests continue to evolve in the realm of water resource engineering with a focus of utilizing the latest technologies to help solve water resource challenges across both urban and rural environments.

Contact:

Ge (Jeff) Pu
State University of New York – College of Environmental Research and Forestry
Department of Environmental Resource Engineering
gpu100@syr.edu

Dr. Lindi Quackenbush
Associate Professor
State University of New York – College of Environmental Research and Forestry
Department of Environmental Resource Engineering
ljquack@esf.edu


10 Questions: Larry Spraker

My guess the name Larry Spraker doesn’t need much of an introduction across the New York State and New England GIS landscape.   His work and contributions since the late 1980s to the geospatial community are many and have included efforts from academia, government, and for many years the private sector.  As well as a ton of volunteer work with GIS user groups and the like. It has been an privilege crossing paths with him in so many ways over the years.  

So depending on the time of day, I recommend grabbing your favorite beverage, pull up a chair and continue reading.  There’s a lot here.  And after you are done, close your eyes and envision Mr. Spraker in another time or comos. Or, as the immortal Rod Sterling would say on the Twilight Zone “Another Dimension”.  Under the bright lights, behind the desk, and waving his hands fevorishly.  Yup, that’s him in his new gig – performing his best Chris Berman “Swami Sez” imitation as he hosts the 6PM ESPN SportsCenter broadcast.

Enjoy.

eSpatiallyNewYork:  Let’s start from the beginning.   The Albany-area boy goes to SUNY Albany for undergraduate and then on to Indiana State for graduate work.  How and when did geography become your educational and professional focus? 

Spraker:  I originally went to UAlbany as a Communications major with aspirations to be a sportswriter. After realizing that was a tough gig that didn’t pay particularly well (at least back in the early 80’s), someone recommended Computer Science. After a few courses, I really liked programming, but hated the high-end math courses such as Calculus and Differential Equations. A minor in Computer Science didn’t require the math courses, so I went to my advisor and asked “What would be a good major with a Computer Science minor?”. He listed a number of majors that included Physics, Math, and the last one he mentioned was Geography. I had already taken 6 credits in Geography as electives, so I asked for more details and somehow this guy had a fair bit of knowledge in this area and explained just enough of cartography, GIS and remote sensing to pique my interest. I registered for Intro to Cartography and Intro to Remote Sensing the next semester and fell in love with the both courses, and quickly found my new major. I focused primarily in Remote Sensing as an undergrad, and my professor, Floyd Henderson, really encouraged me to go graduate school. At the time Indiana State University was a leading remote sensing program, having the first remote terminals into the mainframe computers at Purdue which was the state of the art for image processing software. Floyd knew the professors at ISU, wrote me a recommendation and helped me get a Research Assistantship, so I packed up my car with everything I owned and drove to Terre Haute, Indiana for 2 years and finished my Masters. Although I focused a lot on Remote Sensing, I got exposed to a lot of GIS as well, and by the end of grad school had really got the GIS bug.

As an aside, after I graduated from ISU and came back to the Capital District, Floyd called me and asked me if I would teach his Intro to Remote Sensing and Aerial Photo Interpretation classes while he was away on sabbatical that year. So I returned to SUNY Albany as an adjunct professor and taught his classes that year. When Floyd returned, I stayed on as an adjunct faculty member and transitioned to developing and teaching several GIS courses. I really enjoyed working with the students and ended up teaching at SUNY Albany for 17 years.

Continue reading

Geospatial Business Spotlight: CARTO

Company Name:                   CARTO

Location:                               New York, New York​​​​​

Website:                               www.carto.com

Employees:                          143

Established:                         2009

Founded by Javier de la Torre, CARTO is a diverse and expanding company which includes data scientists, geospatial analysts, cartographers, software developers and engineers, visualization experts, and web designers focusing on Location Intelligence.  Most recently in May 2019, CARTO expanded its worldwide professional service portfolio offerings by acquiring Geographica.

Providing ready to use software tools for data scientists and application developers, CARTO’s client focus is on turning location data into business outcomes, and is built around the following workflow:

  • Data Ingestion & Management
  • Data Enrichment
  • Analysis
  • Solutions & Visualization
  • Integration

Software & Capabilities

Complex analysis, filtering, and visualization are integrated in real time reducing time-to-insight.  Users can integrate CARTO’s API’s and geocoding services to complement other apps and business applications and can be integrated with custom proprietary analytical models.  CARTO can be used as an engine to visualize a wide range of data services.

CARTO is scalable and offers a Software as a Service  (SaaS) deployment model to push new features instantly allowing users to “grow as you go.” Being enterprise-ready also means making on-premise and private clouds architecture solutions available to clients.  CARTO also offers a mobile platform.

Sample Products and Applications

On October 16, 2019, CARTO hosted the 2019 Spatial Data Science Conference (SDSC) at Columbia University which I covered and reported on in a previous blog post.  Typically GeoSpatial Business Spotlight focuses on three or four applications from the firm being highlighted.  However, since SDSC was a day-long series of entirely CARTO-based applications, the conference website provides a better and more thorough overview on how CARTO is applied in business, academia, government, and nonprofit organizations.  Choose from presentations by Uber, Facebook, University of Chicago, American Securities, Salesforce Maps, and MIT among others.  In Empire State, CARTO supports numerous programs in the metropolitan New York City area in both business and government.

Contributions to the Profession 

As part of CARTO’s long-standing commitment to FOSS, Open Source, Open Data, and Open Science, the company has collaborated with many organizations providing access to next generation geospatial technology, data, and models. Most recently (October 2019), CARTO’s Javier de la Torre  joined the Urban Computing Foundation (UCF) Technical Advisory Committee which is a neutral forum for accelerating geospatial open source and community development.  The UCF operates under the umbrella of The Linux Foundation.  In July 2019, Geospatial Media and Communications included Javier de la Torre as part of the Location Analytics & Business Intelligence (LA & BI) Advisory Board.  Additional

CARTO is an open source software built on PostGIS and PostgreSQL which was first released in Beta at FOSS4G in September 2011 and officially released at Where2.0 in April 2012.  The CARTO software solution uses JavaScript extensively in front end web applications, back end Node.js based APIs, and for client libraries.

Overall, CARTO’s platform consists of the following primary components:

The CARTO platform enables users to access and manage vast amounts of data while at the same time providing numerous processes to discover, filter, and integrate local and Big Data libraries.  Geo-enabling large datasets provides a means to visualize and better understand large and complex datasets. CARTO enriches user location data with versatile, relevant datasets, such as demographics and census, and advanced algorithms, drawn from CARTO’s own Data Observatory and offered as Data as a Service (DaaS).

CARTO uses widget-driven dashboards, an array of maps, and unified workflows so that non-GIS and non-mapping users/staff can bring the power of location into the organization’s decision making.

The CARTO software user interface provides both user-friendly mapping and dashboard visuals which can be customized to user needs and experience.

Complex analysis, filtering, and visualization are integrated in real time reducing time-to-insight.  Users can integrate CARTO’s API’s and geocoding services to complement other apps and business applications and can be integrated with custom proprietary analytical models.  CARTO can be used as an engine to visualize a wide range of data services.

CARTO is scalable and offers a Software as a Service  (SaaS) deployment model to push new features instantly allowing users to “grow as you go.” Being enterprise-ready also means making on-premise and private clouds architecture solutions available to clients.  CARTO also offers a mobile platform.

Contact:

Florence Broderick
VP Marketing
flo@carto.com
4475-686-89402


The Geography of an Adirondack High Peaks Unsupported Thru-Hike Record

Background

Since early July this summer when our youngest son Lukas and close friend Mike Jock completed and established  a new record for an unsupported thru-hike of the 46 Adirondack High Peaks, I’ve been asked by various friends and colleagues across the region (who became aware of the accomplishment) as to whether or not any professional geospatial/GIS technology was used in some capacity in supporting the effort.   Each time my humbling answer has been pretty much the same:  Not Really.  However, they did carry some new gadgetry which is currently used ubiquitously across the adventure and extreme sports landscape to collect data that was used to authenticate their achievement.  But more on that later.

Starting their trek at the trail head to Seward Mountain at 3:30 AM Thursday, June 27th on the west side of the Adirondacks, the two covered the 46 High Peaks in 7 days, 2 hours, and 52 minutes finishing by summitting Mount Esther, on the northern shoulder of Whiteface shortly after 3 AM on July 4th. Ultimately making it down to the Mount Ester trail head at 6:20 AM to complete the trip.   All said, nearly 212 miles and 70,000 feet gained in elevation – more than twice the elevation of Mt. Everest.  They averaged well over a marathon a day, covering some 25-30 miles. On the final day they kept moving for more than 23 hours covering 45 miles.

Michael, left, and Lukas at the summit of Armstrong Mountain with Gothics Mountain in the background. The two were soccer teammates at SUNY Cortland. Mike King photo.

Preparation was more old school than one would think.  Nothing in this space replaces on-the-ground knowledge of the trails, trail junctions, where and when to bushwhack, locations of rock cairns for reference points, as well as planning and hiking/testing certain stretches of the route ahead of time.  Yeah, practice runs.  Luke had the benefit of many years of experience having first started ADK trail hiking since he was barely in kindergarten.  Like many other young children, his first “mountain” being Mt. Jo overlooking Heart Lake adjacent Adirondack Loj.  Safe to assume that through the family ties, his spatial orientation has always been pretty decent. Mike, a local boy, grew up in the Plattsburgh area.

This was their third attempt.   And such accomplishments don’t come without the element of good fortune avoiding injuries (which was the case in 2018) and a bunch of days with generally decent weather.  The 2018 attempt was also impacted due to an encounter with a black bear.  Yet another ADK backcountry hiker lesson in overnight food storage.

Given the enormity, location, and challenges of the effort, it would clearly not be safe, if not irresponsible,  to rely solely on the new generation of lightweight/handheld navigational devices as a means to lead one through the Adirondack Mountain wilderness.  There is no substitute for first-hand knowledge of the trail network and a pre-determined plan.  They carried only the essentials such as lighweight sleeping bags, tents, change of clothing, raingear, first aid/basic emergency gear, water filters,  and food.  Counting every ounce in keeping their backpacks to about 40 pounds.  Even omitting the weight of gas canisters/gas stove and in doing so did not prepare anything hot the entire trip.  Zero assistance.

Cool Gadgets

It’s amazing how far the adventure mapping and video/data collection market has evolved since GoPro technology was introduced nearly a decade ago, if not earlier.  The ability to playback Mike and Luke’s accomplishment – made available below via a series of links – is amazingly made possible by just a one simple mobile (wearable) component.  They used a Garmin Fenix 5 GPS Watch to collect X,Y and elevation data which, based on wireless connectivity, automatically uploads to Garmin Connect.  Upon completion of their hike, the entire trip dataset was downloaded to Relive an outdoor 3D video website which allows further rendering and interactive use of the data.    Two Anker PowerCore 26800 pre-charged power banks kept their phones and Garmin device charged.   Of sufficient size to recharge their phones/devices numerous times over.  They took two but in fact only needed one.   The Garmin app also collects heart rate, estimated calories burned, pace (minutes per mile), elevataion gain/loss, and total daily distance – all of which is made available in interactive and graphic form.  In addition to the default Google basemap, data can be rendered on other base maps including satellite, terrain, OpenStreetMap, and Here.  Amazingly compact, yet powerful tools.

The Daily Numbers

The following section includes a brief narrative – Mike’s own words- and links which can be used to highlight trail and body metrics as well as mapping visuals for each hiking day.  For those familiar with hiking and trekking in the Adirondacks, the visuals certainly help put Luke and Mike’s daily segments in better perspective.

Hold on to your seats.

Thursday June 27

Hiker Notes: 3:30 am depart from Corey’s Road.   Day consisted of seven mountains: Seward, Donaldson, Emmons, Seymour, Santanoni, Panther & Couchsachraga. Out and backed the first four.  Trekked approximately 10 miles to Santanoni range.  Set up camp at the base, then we went up the expressway to summit Santanoni first, followed by Panther, and then finished with Couchsachraga. We came down the Panther brook trail before staying at camp at base of expressway again. Approximately 37.84 miles.

Instructions for all similar images below: Click on map for additional graphics and daily metrics. Or click the black triangle button at the bottom of the screen to see hiker movement over the course of the day.

Instructions for all similar Relive 3D Interactive links below: Click on the icon circled in red to see daily hiker movement on top of a 3D base map and associated photos. Clicking on the “View Interactive Route” button enables the ability to interact with the map and trail data “twirling” the image to see from the north, east, south, and west perspective.

Friday June 28

Hiker Notes: From camp, hiked over to Allen mountain, out and backed it before moving up towards Colden/Avalanche Lakes. We out and backed Mount Marshall before setting up camp over the dam at Lake Colden. We summited two mountains and covered approximately 28.47 miles.

June 28thRelive 3D Interactive

Saturday June 29

Hiker Notes: The ADK Loj Loop day. Summitting eight mountains and doing a big circle before returning to the same place we camped the night before. We started by going up the backside of Colden, then Tabletop, Phelps, Street, Nye, Wright, Algonquin and finishing on Iroquis. Approximately 32.18 miles

Note: The only day “noise” was either user generated or introduced by the Garmin device itself. In the vicinity of Street and Nye – Illustrated by the “straight” additional red line. Also reflected in the Relive 3D viewer.

June 29thRelive 3D Interactive

Sunday June 30

Hiker Notes:   Audible day. Started by moving to the base of Cliff and Redfield (out and bacs), then trekking up towards Gray, Skylight, Marcy, Haystack, Basin and finishing with Saddleback. Due to it raining all day, made the game time decision to check out and head towards Johns Brook Lodge where we camped at the trailhead of Big Slide Mountain (setting ourselves up the next day to finish the Great Range and start moving east). Summitted eight mountains and covered approximately 22.5 miles.

June 30th:  Relive 3D Interactive

Monday July 1

Hiker Notes:  Out and backed Big Slide early in the AM, before climbing up towards Great Range. First we summited Lower Wolf Jaw, then Upper Wolf Jaw, Armstrong, Gothics and Sawteeth. We then headed down trail to Lower Ausable Lake. Next we did Colvin and Blake before camping between those two mountains.   In total we summited eight peaks again and covered 23.97 miles.

July 1st:  Relive 3D Interactive

Tuesday July 2

Hiker Notes: Started by ascending Nippletop, moved on over to Dial, then bushwhacked down towards the Dix Range. Once we got down from bushwhack/brook we dropped bags and then out and backed the entire Dix Range: Dix, Hough, South Dix, Grace Peak & Macomb. From there we got our bags again and then moved our stuff over to Roaring Brook and the base of Giant Mountain. In total we covered 25.26 miles and summitted seven peaks.

July 2nd:  Relive 3D Interactive

 Wednesday July 3

Hiker Notes:  The 24 hour day. Woke up at 3 am and went to get Giant and Rocky Ridge Peak (out and backs). From there we picked up our stuff again and schlepped ourselves 5.5 miles down route 73 toward Marcy airfield. Next up was cutting from one side of 73 to the Lake Placid side of 73 along the ridge trail that summitted Porter and Cascade Mountains. Off of those we had then a 10 mile stretch on route 73 and then River Road towards the trai lhead to Whiteface mountain. Using the trail by Connery pond we entered that portion at 1030 PM and was able to summit both Whiteface and then Esther by 3:15 am. About 23 hour and 30 minutes of moving time we summitted our final 6 peaks and covered 44.18 miles. Passed out for an hour and reached Memorial Highway by 06:22 AM, where a time-stamped photo was taken.

July 3nd:  Relive 3D Interactive (Part 1)  Incredible day!!

July 4th:  Relive 3D Interactive (Part 2)

Summary

Quite an effort  and on top of setting the record, between this trip and last year’s attempt, the two helped raise nearly $18,000 for the Dubin Breast Center at Mount Sinai Hospital in New York.  Their accomplishment was covered by Backpacker Magazine as well as a selected number of upstate New York online publications (UpstateNewYork and NNY360) among others.  The articles are generally similar in content though do offer more details about food and other daily nuances/items which I omitted here.  Choosing rather to highlight and focus on the immense geographic element of the effort.

Both Luke and Mike are personal trainers living and working out of New York City.  More information can be found on their website Team Adventure Portal.

Shared Services: Opportunities for Local Government GIS

More than a couple years ago, Linda Rockwood, who at the time was running Mohawk Valley GIS, mentioned to the NYS GIS community that she was at a local meet and greet with regional elected officials and mentioned the “GIS” word to one of NYS’s congressional representatives in attendance.  To her amazement – and dismay –  she found out the representative had a very limited awareness or understanding of GIS.

Linda’s encounter certainly wasn’t the first of its kind and I’m sure there have been numerous similar incidents in our respective corners of the state since then.  GISers gingerly starting a conversation on the broad benefits and applications of geospatial technology to government and elected officials – only to see the focus wander quickly. Maybe two or three minutes into the discussion when comparisons to Google Maps normally kick-in and/or there is eye contact with the next constituent and thinking moves to that conversation.

Unfortunately, the message – and the collective mission – seems to continue to get lost and there is recent anecdotal evidence to suggest there is still a long way to go in context of recognizing and embracing geospatial technology in NYS local governments (county, city, town, and village) as part of an increasingly important government program area:  Shared Services.

New York State Shared Services Program

Those working throughout the local government ranks should be on some level familiar with the shared services buzzword.  It’s the talk among government officials and for legitimately good reasons.  Look no further than Governor Cuomo’s commitment of $225 million in the FY 2019 Executive Budget to continue the County-Wide Shared Services Initiatives (CWSSI). The $225 serves as matching funds for a one-time match for actual and demonstrable first-year savings achieved by the Shared Services Panels through new actions implemented during calendar year 2018.  School districts, boards of cooperative services (BOCES), fire districts, fire protection districts, and special improvement districts have the option to participate as well.    The current shared services initiative augments the existing NYS Department of State Local Government Efficiency (LGe) Program – which by the way formerly known as the Shared Municipal Services Incentives program –  “provides technical assistance and competitive grants to local governments for the development of projects that will achieve savings and improve municipal efficiency through shared services, cooperative agreements, mergers, consolidations and dissolutions.”

New York State Shared Services Initiative web page

There are many recognized barriers to implementing shared services across NYS governments though as the concept evolves, governments continue to try and find ways to consolidate services in specific areas such as municipal justices, zoning and code enforcement, construction/building/maintenance inspections, and in the establishment of health care consortiums to name only a few.   That said, it’s worthy to note the limited number of GIS-centric shared services proposals submitted by both the New York State Association of Counties (NYSAC) and  New York Council of Mayors (NYCOM). Specifically:
Continue reading

Geospatial Business Spotlight: Bowne Management Systems

Company Name:         Bowne Management Systems, Inc.

Location:                     235 E. Jericho Turnpike, Mineola, NY  11501

Website:                      http://www.bownegroup.com

Employees:                 35

Established:               1982

Bowne Management Systems (BMS) is unique in the technology world as the firm has been in business since 1982.   2017 marks the 35th anniversary of BMS and they proudly state “we innovate every day.”

The collective team of professionals are not only fluent in IT and geospatial technology but in the core competencies of any business – professional project management, diverse and adaptable skill sets and most importantly, customer relationships and satisfaction.

BMS is associated with their affiliate, Sidney B. Bowne and Son, a nationally recognized civil engineering and surveying firm that has been in business in New York State since 1895. The shared corporate culture and values has kept Bowne in the forefront for almost 125 years.

BMS has developed core practices to support the mission critical operations of local government. This client base includes local government at all levels, as well as State and Federal government agencies, and private clients. BMS has core practices in the following areas:

  • Public Safety
  • Land Records and Tax Mapping
  • Infrastructure and Asset Management

In addition to these core practices, BMS has robust operations in the areas of IT Staffing and Governance, Geospatial Cloud Deployment, Disaster Recovery and Business Continuity Services, and Project Management and Oversight. Some recent notable work includes the following:

Support for New York City’s emergency  dispatch   systems   – BMS built the street center line (“City- wide Street Centerline” [CSCL]) and the required maintenance  system. BMS also built and maintains  the software that transforms CSCL data to the geofile format required  by the NYPD and FDNY dispatch systems. To date, also most 50 million e-911 calls have been successfully handled by CSCL and Bowne developed software. Continue reading

Geospatial Business Spotlight: Mapillary

Company Name:                 Mapillary

Website:                              http://www.mapillary.com/

Established:                       2013

THE COMPANY

Mapillary is a new and different approach to Street View. Using computer vision, Mapillary stitches together photos taken with any device to create street-level imagery for extracting geospatial data. By empowering anyone anywhere to easily create street-level imagery, Mapillary aims to create a photo representation of the world. To date, Mapillary’s community has contributed 63 million photos spanning over 900,000 miles across all seven continents.

Mapillary was founded in 2013 by Jan Erik Solem, Johan Gyllenspetz, Yubin Kuang, and Peter Neubauer, who share a vision for putting mapmaking into the hands of people everywhere. Solem, who serves as CEO, previously founded Polar Rose, a facial recognition software that was bought by Apple in 2010.  The company is headquartered in Malmö, Sweden, and has fifteen full-time employees located around the world.   Mapillary’s New York office is based In Brooklyn, NY.

PRODUCTS AND SERVICES

Mapillary allows community members to create and explore a crowd-sourced, street-level view of the world through its app, which is available for web, iOS, Android, and Windows Phone. Users can upload photos from their smartphones or other digital cameras and Mapillary then combines the images together geotagging each using GPS metadata. The resulting 3D reconstruction is created using computer vision and the company’s own open source “Structure from Motion” algorithm. Mapping isn’t limited to streets—the community has captured hiking trails, favorite bike routes, and even a stretch of Antarctica. Mapillary integrates with any mapping platform through simple APIs.

Street-level photos can be captured using Mapillary's iPhone app

Street-level photos can be captured using Mapillary’s iPhone app

In addition to creating photo-maps, Mapillary also utilizes computer vision techniques to extract useful data from uploaded images. For instance, the software can recognize symbols on street signs in photos taken in the U.S. or Europe. This capability grew out of the app’s need to blur faces and license plates for privacy purposes, and is now used by groups like city governments for urban planning, land surveys and asset inventory. Using Mapillary with Esri’s ArcGIS platform has helped cities streamline infrastructure updates, from speed limit changes to road surface quality checks.

Mapillary uses computer vision to automatically detect traffic signs and extract geospatial data

Mapillary uses computer vision to automatically detect traffic signs and extract geospatial data

Humanitarian organizations also use Mapillary to further their initiatives. In Haiti, the American Red Cross and Humanitarian OpenStreetMap partnered with Mapillary to help record previously unmapped areas to aid disaster response efforts. Mapillary has also been used by the World Bank and other groups in Dar Es Salaam, Tanzania, to record infrastructure in flood-prone areas of the city to help plan improvements. The app is ideally suited for these sorts of tasks because it doesn’t require any special equipment beyond a basic smartphone.

Street level imagery is reconstructed by creating point clouds from photos.

Street level imagery is reconstructed by creating point clouds from photos.

Mapillary is free to use for individuals and for non-profit or educational purposes. For commercial solutions, ranging from embedding a photo-map into a webpage to extracting specific data from images, Mapillary has several pricing plans available.

Westchester County GIS is using the Mapillary app to inventory hiking trails in County parks

Westchester County GIS is using the Mapillary app to inventory  hiking trails in Westchester County parks

To find out more about Mapillary, visit their website.

CONTACT: 

hello@mapillary.com
Bredgatan 4, 211 30 Malmo, Sweden
www.mapillary.com

Certifications + Competencies: Anybody Listening?

Every couple years the GIS community perks up for one reason to revisit and debate the importance and worthiness of Geographic Information Systems Professional (GISP) certification.  And more recently there has also been discussion and outreach, albeit among a much smaller community of geospatial professionals, on Geospatial Competency/Maturity Models.  Such is the recent case as the NYS GIS community (as part of the NEARC listserv) were asked  to jump in and contribute to an online survey  intended to “to get some idea of how widely GIS certifications have been adopted and promoted within organizations that use GIS technology or services at any level”.   The listserv posting states that results of the survey will be summarized and presented next month at the 2014 GIS-Pro Conference in New Orleans.

Not the first time the GIS community has been asked to weigh in and offer opinions on the GISP issue and my bet is that the results will continue to vary greatly based on respondent criteria such as years of GIS experience, management and supervisory responsibilities, and even type of employer (i.e., public, private, nonprofit, academic, etc.).  A simple Google search on “worth/value of GISP Certification” will result in a long list of articles on the subject from both individuals and online trade magazines.  Most of the online discussion will support and speak to the value of GISP Certification.  Which should come as no surprise as many of the opinion gathering efforts on this particular issue have been surveys of GIS industry personnel.  (Isn’t this called surveying the choir?)  There is the occasional descending opinion though this is normally the exception.    As a long-time GIS manager here in New York State I see both sides of the debate.  And yes, I did respond to the recent online GIS Certification questionnaire.

There are also recent and ongoing efforts to solicit comments on the 2010 Geospatial Technology Competency Model (GTCM) which has been on the back burner for the last couple years.   And I’d be surprised there is much awareness of the model throughout the NYS geospatial community.  Originally proposed by the University of Southern Mississippi’s Geospatial Workforce Development Center, the GTMC concept was an initial effort in the early 2000s to define geospatial industry skills and competencies.  This work  led to the first draft of the GTCM which was peer reviewed  by the Spatial Technologies Information Association (STIA) –  around the same time  STIA received a $700,000 grant from the Dept. of Labor to “promote spatial technologies industry”.    Interestingly, STIA doesn’t even seem to be around anymore.

Work continued on the GTCM and in early 2009 members of the National Geospatial Technology Center of Excellence (GeoTech Center) became involved in the effort to complete the GTCM.  As it goes, a panel of geospatial experts were brought together to further define the many components of the GTCM model.    Public comments were sought and comments were addressed with a final GTCM draft submitted to the U.S. Department of Labor Employment and Training Administration (DOLETA) Geospatial Technology Competency Model.  The draft was approved by DOLETA in 2010.

Approximately during the same timeframe and to further muddle efforts to define  geospatial industry standards,  the University Consortium for GIS Science got into them mix by publishing the Geographic Information Science and Technology Body of Knowledge in 2006.  It’s not real clear where this publication and effort went, if anywhere, in context of industry acceptance and promotion.  This publication was reissued in late 2012 by ESRI and the Association of American Geographers (AAG).   UCGIS is revisiting the book of knowledge as part of a 2014-2015 effort.

Since 2010 there have been focused efforts to promote the worthiness of the GTCM including David Debiase’s (ESRI) 2012 Directions Magazine article entitled Ten Things You Need to Know about the Geospatial Technology Competency Model.   The GTCM model is not for the meek and a challenge to work through for even the most experienced geospatial professionals.  I’ve been in the NYS geospatial space for a long, long time and I’ve never been involved in a GTCM focused discussion.  Or even aware of one.

Championed largely by GeoTech academics and DOLETA staff, GTCM was created to become an important resource “for defining the geospatial industry and a valuable tool for educators creating programs”.   The model specifies foundational (Tiers 1-3), industry-wide (Tier 4), and industry sector-specific (Tier 5) expertise characteristic of the various occupations that comprise the geospatial industry.   Descriptions of individual geospatial occupations, including occupation-specific competencies and job requirements (Tiers 6-8), are published in DOLETA’s O*NET occupation database (http://www.onetonline.org/).

URISA continues to make significant efforts to contribute to the GTCM concept.  In 2013 URISA published two documents:  (1) the Geospatial Management Competency Model (GMCM) and (2) the GIS Capability Maturity Model (GISCMM).   The GMCM focuses on just Tier 9 of the GTCM and specifies 74 essential competencies and 18 competency areas that characterize the work of most successful managers in the geospatial industry. It is not intended to be an exhaustive inventory of all pertinent competencies, such as those specific to particular work settings. Instead, the GMCM seeks to distill a concise list that is widely applicable, and readily adaptable to evolving industry needs.  The GISCMM was published as part of the newly formed URISA GIS Management Institute (GMI).

The GISCMM provides a first-ever framework for assessing not only the capability of an enterprise GIS operation, but also the process maturity of those who manage and operate the GIS. It includes 23 enabling capability assessment components, which include the sorts of assets that a GIS operation acquires. The Model also includes 22 execution ability assessment components, which include the key processes that are required to manage and operate an enterprise GIS. URISA states GISCMM will help organizations assess the development stage of their GIS and the process maturity level of their operations.  This assessment will help them target priority capability enhancement s and process improvements.  GIS staff responsible for operations and management will be able to use both the GISCMM and the GMCM to assess their own professional strengths and weakness and to identify training and other professional development priorities.

Honorable goals and intent, no doubt, but at the end of the day, a daunting concept for statewide GIS managers to get their arms around and champion in their respective organizations.

 So What’s All This Mean to the NYS Geospatial Community?

At this point, I think one would be challenged to find any real broad based discussion on the GISP Certification here in the Empire State.  Other than a show of hands as to who has GISP Certification at the bi-annual NYS state conference, the discussion doesn’t go much farther.  Instead of it being ongoing fodder for discussion among the choir at national conferences, perhaps in time, groups like the NYGIS Association Professional Development Committee could bring the topic down to earth and focus on what it really means here in New York.  Beyond discussion among my peers, GISP Certification has meant little to me personally in context of expanded professional recognition.  Though noted, this is just me – in the twilight of my professional career with Westchester County.

Inasmuch the GIS community wants GISP Certification to mean something, to cause change, to somehow better recognize or legitimize our work and services – little has been done in the institutional framework in which the geospatial community works and operates.  For example, or at least in government, one of the most meaningful and long lasting impacts will come when GISP credentials finally mean something to Human Resource managers and/or incorporated in civil service titles.  There has been only minimal progress in this regard across the state.

Unlike recognized professional credentials such as Professional Engineer (PE) and Project Management Professional (PMP) – ones that we most often run into in the geospatial arena – government attorneys and contract administrators will continue to be reluctant of adding new requirements to Request for Proposals (RFP) such as “GISP” when benefits of such are not clearly understood and recognized or do not have any financial or legal basis.   The model may be a little different in business and industry.  Yes, it may behoove consultants to show GISPs on staff to make their company credentials better than the next, but at the end of the day, organizations requesting GIS contract support want the most cost effective solution to get the job done – with or without GISP Certification.  Most likely until GISP Certification discussion turns into  institutional acceptance – by the organizations which hire and employ geospatial professionals – the banter of GISP Certification self-worth will continue.

Discussion – or actually the lack of – on Competence/Maturity Models in New York State is another issue.  Hard to explain given the broad publicity the issue has been given at professional conferences, URISA publications, academia, and uber expansive publications like ESRI’s ArcNews.  But it probably speaks to the point noted above the discussion continues to be within a very small audience.    Missing is meaningful and aggregated input from the grass roots level at all levels of NYS government.  Input is needed from GIS managers and supervisors who cannot afford to attend conferences.  Those who cannot serve on committees for one reason or another or simply do not have the time.  GIS administrators in 2014 publically funded, budget strapped organizations just trying to keep the lights on.  Yes, the new models speak to sustainability and revenue streams, but to introduce this discussion in 2014 in organizations which are constantly being asked to move programs to the Cloud, consider outsourcing or additional vendor support, or simply dropping selected program elements altogether, seems almost too much to ask?  In most local organizations across the state, there is very little context, or ability to start Competency/Maturity Model discussions.  Return-on-Investment (ROI) numbers are great to the extent staff and resources are available to prepare and conduct them; unfortunately I don’t see much of this across the NYS GIS landscape.   And given the complexity of the models and the need for administrative, management, financial, and  human resources to be included in the Competency/Maturity Models discussion, bringing these topics as  workshops or training sessions to the state conferences (bi-annual and/or Geospatial Summit) would only be scratching the surface towards institutional  understanding and implementation.  Finding the right conduit to bring all the right and necessary players the table will continue to be a huge lift.  For that matter, just who are the right people to bring to the discussion at the local and county levels?

(BTW, most wouldn’t know it, but the State of New York completed its own Geospatial Maturity Assessment (GMA) last fall.)

Conclusion

Both the GISP Certification and Geospatial Competency/Maturity Model discussions certainly have relevance here in New York State,   but considerable work lies ahead towards incorporating the concepts into the institutional and administrative frameworks before any meaningful “professional” acceptance and recognition will be realized as part of the business of doing GIS.     Until then, it will be business as usual.   Many good deeds have been done by both URISA and the GeoTech Center but the work and concept will fall short if not packaged and promoted in a user-friendly manner which is of consequential and realistic to resource-strapped NYS local government GIS programs.  There are no URISA Chapters in New York State, so both the GISP Certification and Competency/Maturity Models will need to be advocated through other means and partners.  For example the NYS GIS Association’s Educational and  Professional Development Committees are sponsoring and upcoming webinar entitled “Revitalizing GIST Community College Programs” part of which is relevant to the GTCM.  Other than this, the collective messages on both of these “GIS relevancy” issues are limited and probably in need of an extreme makeover.

Other webinars, email blasts, online surveys, conference workshops and announcements will surely follow on these subject matters.  And the debate will continue. The real challenge will be to see if the New York geospatial community will take notice and listen.  Or even have the means to do so?  Or even care.

Imagery is Everywhere

The recent release of the joint Time, Inc., Google, the U.S. Geological Survey (USGS), and Carnegie Mellon University’s Create Lab Timelapse website in May of this year highlights once again the increased availability of a wide range of imagery – in variety of formats – to geospatial users across the Empire State.  With aerial imagery becoming another market-driven commodity to support the expanding geospatial industry, consumers now have several options including either a la carte commercial off-the-shelf (COTS) products or more simply consuming imagery online – for free – as part of a growing number of publically accessible Cloud applications and map services.

 Commercial Imagery Products

While imagery requirements to support large scale (1”=100’) planimetric feature mapping is often much more detailed and usually acquired through  formal procurement, COTS imagery can routinely be obtained in the 1m – 2m resolution range, which is normally sufficient to support many general viewing and “what-is-where” geospatial applications across New York State.   COTS imagery has never been easier and more cost-effective to acquire.

GIS mapping and viewing applications that use aerial imagery primarily as a means to provide context to larger-scale, more spatially accurate vector datasets such as tax parcel boundaries, building footprints, and street features can use COTS products.   In the emergency response disciplines, rapidly deployed and developed COTS-quality imagery (+/-  1m – 2m resolution) has also become a standard in damage assessment for incidents such hurricanes, flooding, wildland fires, and other natural disasters.

Firms such as such as MapMart, WeoGeo, and TerraServer serve as brokers for several types of commercial aerial and satellite imagery –  including Digital Globe GeoEye, and QuickBird products – which are sufficient to support “what is where” viewing applications in most government mapping programs.  These commercial data warehouses also make available selected government image datasets such as the leaf-on National Agriculture Imagery Program (NAIP) photography.    Commercial sites provide easy-to-use online forms to select areas of interest, imagery type/format, and cost estimates on the requested imagery.  Commercial aerial imagery can also be bought directly from the aerial or satellite imagery firm (i.e., Digital Globe) but marketplaces such as MapMart and WeoGeo provide a broader range of options for the consumer. (Note:  Georeferenced NAIP aerial imagery can be downloaded directly from Natural Resources and Conservation Service (NRCS) website.  As part of preparing this blog post, I received a cost estimate from MapMart for two scenes of Digital Globe Precision Aerials (0.3 m resolution) imagery covering the entire Westchester County footprint – which proved to be very cost competitive and affordable.

Of course the ease and speed of purchasing COTS aerial imagery with or without detailed specifications does not come without potential issues or concerns.   One, some commercial firms may only have imagery that is several years old for a selected “area of interest” or sometimes even more problematic is that a specific area may contain a combination of years of photography. Also, file formats, datums, or the ability to test (QA/QC) the imagery may not be possible and it is worth mentioning that commercial off-the-shelf aerial imagery products are typically not be used in the production or updating of large-scale planimetric vector datasets.  Users measuring distances with COTS may take heed as depending on the scale and resolution of the imagery as calculated distant may contain an unacceptable amount of error depending on user requirements.   Use and redistribution licensing restrictions should also be thoroughly reviewed.

Imagery as part of Cloud and Map Services

If users do not require a physical (local) copy of the imagery, there are also options to access web sites  publishing aerial imagery as a service  – for free –  which can be “mashed-up” with local datasets in a variety of desktop and web viewing clients.  One of the more notable aerial imagery map services in the Empire State is available through the New York State Digital Orthophoto Program (NYSDOP).  In production since 2001, the program makes imagery available for both download and through OGC-compliant Web Map Services (WMS).    Funded through a combination of federal,  state, and local  sources, many of most commonly developed NYSDOP image products across the state (particularly outside of urban areas) are 1ft and 2ft resolution imagery which are generally comparable to COTS available products.

A much larger and expanded source of online aerial imagery is The National Map Viewer (TNM) portal which provides several map services “containing orthorectified digital aerial photographs and satellite imagery” which are more than sufficient resolution to support “what is where” viewing applications.  In additional to making high resolution imagery available, the TNM also provides viewing software that enables users to add local content – either as layers or map services.  A somewhat similar “mash-up” system is the popular Google Earth viewer which provides imagery as base map and of course, the ability for users to add additional KML layers and WMS services.  Other closely related products such as Microsoft Bing Maps offer developer tools to embed and make available imagery (Pictometry obliques) in business and government applications.

The new approach of providing both Data-as-a-Service (DaaS) and Software-as-a-Service (SaaS) in one interface – and for free – is increasingly empowering for organizations with limited resources or GIS capacity.  Albeit at its core, ArcGIS.com is a fee-based product that offers similar functionality and does include free options if contributors make project maps accessible to the public.  An exhaustive gallery of public facing maps – many of which include high resolution aerial photography as the base map AND can be modified and enhanced by anonymous users with local datasets – is available for viewing at the ArcGIS.com portal.  Many of the maps can be used as a front-end to add local content for site specific projects here in New York State.

All said, the landscape has changed dramatically in recent months with regard to purchasing COTS aerial and satellite imagery which can used to support desktop and web-based geospatial applications.  And the user community should expect options to only expand over the next several years as:  1) aerial imagery change detection technology continues to evolve (enabling consumers to purchase aerial imagery where it is really needed and/or physical changes have actually occurred)  and 2)  the next generation of smaller earth observation satellites promising a surge of commercial space-based imagery platforms combined with better web-based visualization and mapping systems that are ready to ingest and analyze near real-time imagery.  To say the least of anticipated options associated with the budding drone and unmanned aerial planes/vehicles which will be used to support imagery and data collection.

If organizations have limited budgets, do not require a complete update of the imagery database or do not have other “hard” requirements (i.e., photography to support large-scale feature/planimetric  mapping) COTS imagery can be priced very competitively and can be considered as a viable alternative in support of enterprise aerial imagery programs.