Empire State GIS/Mapping DIYer Phenom: Andy Arthur

Self-taught hobbyist has a treasure chest of geospatial content on website

One of the benefits of writing about all-things geospatial in Empire State is sometimes I just don’t know what I’ll come across.  Looking for this thing and finding that.   Starting in earnest on an article about a certain GIS channel and a couple days later finding myself having completely jumped the rails and find myself way over there writing about Channel Z.  (Yup, that static in the attic).  Or ending up on a cool or fun website not really knowing how I got there.

Case in point:  Interactive Maps by Andy Arthur.  Empire State mapping DIYer extraordinaire.  Just a hobby.

When I first stumbled onto the site and having spent some time driving around, I realized I needed to find out who was behind it all.  It definitely isn’t the kind and feel of the traditional geospatial website I normally include or reference in my blog, but enough interesting – and yes, quite different – content to dig a little deeper.  And glad I did.  This is not a blog post to focus on a particular topic or concept, but rather just more of a pointer to the URL and let you take away from the website what you want.  

It turns out the person behind all of this is Andy Arthur, who by day, is Deputy Director of Research Services in the NYS Assembly.   “I have no formal GIS training, as things were still pretty primitive back when I was in college (SUNY Plattsburgh)  in the early 2000s especially when it came to web services, online data and open source software” says Arthur, “computers were a lot less powerful back then. I remember vaguely hearing a bit about Remote Sensing when I was involved in the Environmental Science Club in college, but it wasn’t something I ever used.

Since then and working on his own, Arthur picked up QGIS (and the accompanying PyQGIS developer tools), as he was looking for a way to make his own topographic maps because he wasn’t happy with what was available on  the Internet. He later found out he could FOIL a primative campsite shapefile from NYS DEC and get data from there to help find campsites. “I was pretty good at map and compass stuff from my years in Boy Scouts and always interested in environmental and land use issues”, he says.  Over time, he branched out into other geospatial areas including web services.  More recently He’s been focusing on more automation of processes, using Python and R statistical language to do some map plotting and a lot of Census data gathering and processing. “I like working with R as it is fast and easy to implement code in. I’ve also lately been doing a lot more with Leaflet and web services”.  Along the way he continues to use GeoPandas and Leaflet for map making. (btw as I was putting this blog piece together I found out the creator of Leaflet 11 yeas ago was  Volodymyr Agafonkin, a Ukrainian citizen who at the time was living in Kyiv.)  Content on the site is also made available in KMZ for use in Google Earth.

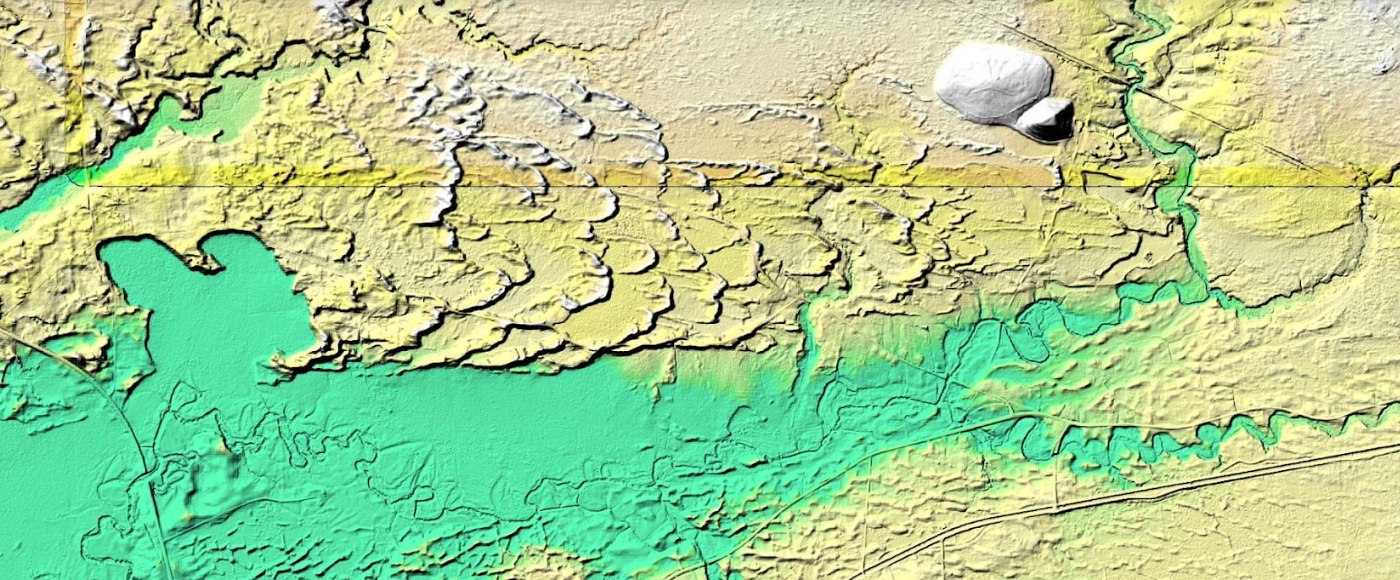
This is a example of how Arthur processed LIDAR data covering the Rome Sand Dunes west of the City of Rome in Oneida County. The landscape ifs a mosaic of sand dunes rising about 50 feet above low peat bogs which lie between the dunes. Processed LIDAR data renders the dunes very clearly. Arthur created this originally by writing a QGIS plugin that queries a shapefile with the LIDAR Digital Terrain Model Bare-Earthindex, then downloads the geotiffs, and finally joining them together to create the hillshade.The plugin itself is in Python and runs in QGIS, while the lidar download/processing script is in php-cli shell script.

The best place to start navigating the website is to open the table of contents link located in the upper right corner of the landing page. The table of contents page then provides additional links products and visuals Andy has created including aerial photos, charts, interactive maps (recommend starting here), and thematic maps to name just a few.   This page also provides more detail on open source components, some specifics on the use of Python and Pandas, a downloadable CSV file listing of web services (WMS, ArcGIS services, etc) used on the blog, and much more.  It’s worth noting that the website also includes non-GIS/geospatial content.

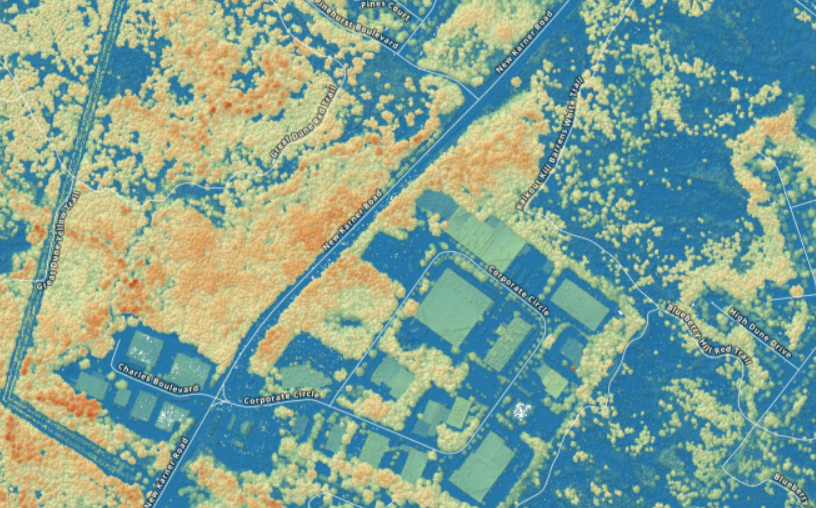
If you need some additional evidence of how much Arther has picked-up on programming, using open source components, and navigating the geospatial landscape in this space,  check out his tutorial on how to create a  Digital Surface Model GeoTIFF Using National Map Downloader, LiDAR Point Clouds and PDAL.  By example, the DSM image above is from a section of the Albany Pine Bush.  For a larger montage of the Albany Pine Bush digital surface model and samples of his code, click here for downloads.

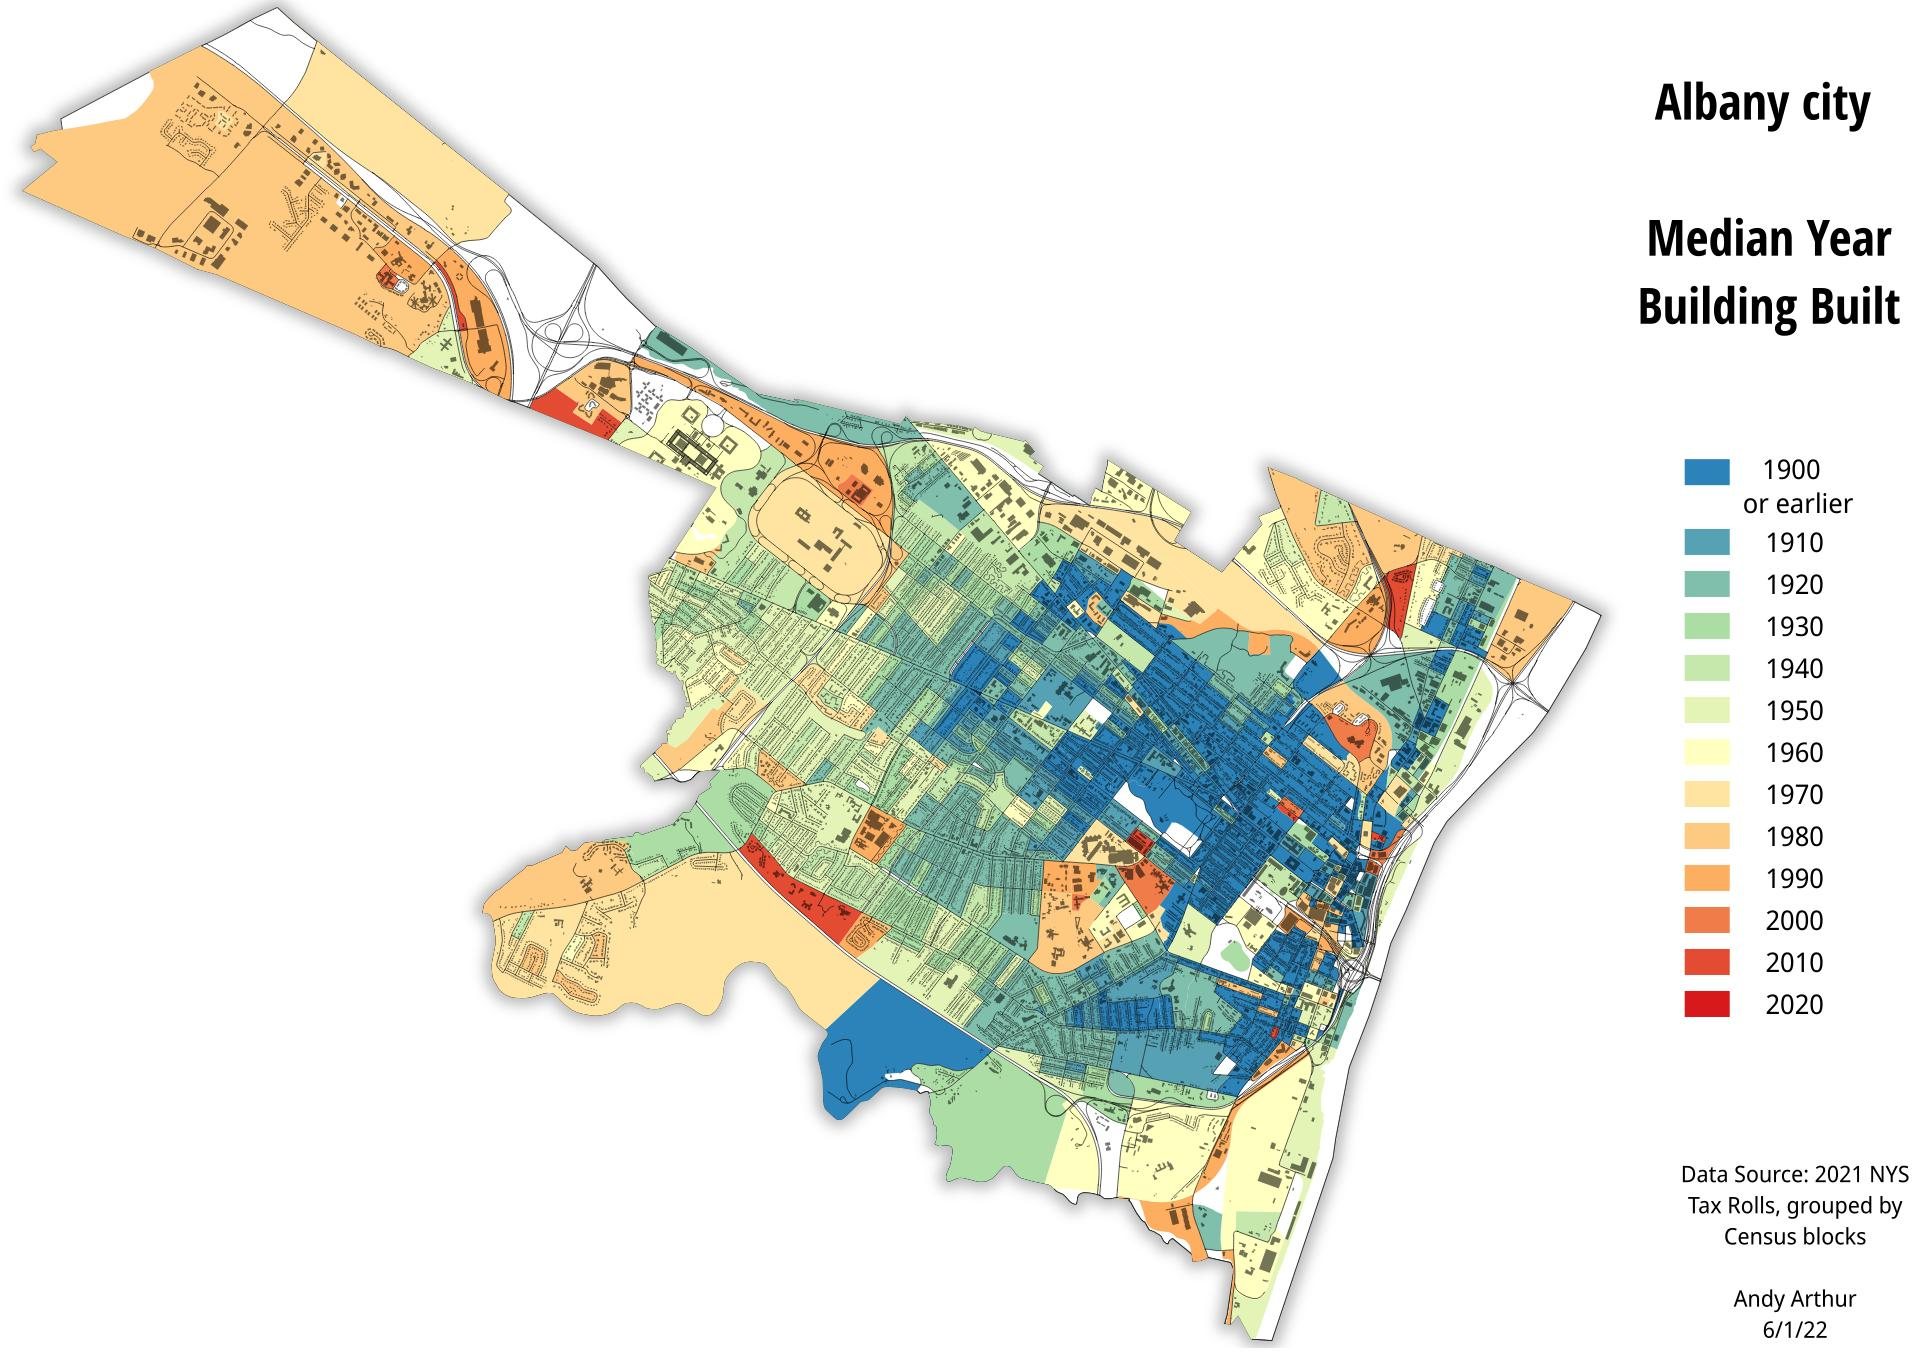
And of course, the old stand-by hardcopy product. Here, a recently created thematic map of the City of Albany median year of housing construction map. He used the NYS Tax Parcel Centroid Points data aggregated down to the parcel level using R code and created a GeoPackage. Which was then used to create the map in QGIS. Additional layers were added for context.

There are many many more examples of geospatial products, maps, and viewers on the website.  Its a great example of how much can come out of the other end when diving into and applying geospatial tools to one’s own personal interests and way of living. 

When you have a few minutes over lunch or a cup of coffee, take a look at his site.  In communicating with Andy over the course of putting this piece together, he would be open to talking with and assisting non-profit or similar community groups on specific GIS/mapping projects.  His contact information is below. 

Contact:

Andy Arthur
www.andyarthur.org
andy@andyarthur.org

Cruising Empire State Data Portals for Geospatial Content

Expanding Suite of Online Portals Offer Data For All Types of GIS Users

Ever since the federal government launched Data.gov in May 2009 and President Barack Obama issuing an executive order in May 2013 establishing the Open Data Policy, as well as   Governor Andrew M. Cuomo signing Executive Order 95 (“Using Technology to Promote Transparency, Improve Government Performance and Enhance Citizen Engagement”) in March of the same year, governments at all levels across the country have responded in creating an array of online data portals with the intent of making data free and easily accessible.  Available and open to everyone including nonprofits, application developers, researchers and academia, business and industry, service industries, the geospatial community and everything in-between. Such portals purpose and intent is to promote government transparency, reduce data request and distribution costs, fuel business development and job growth, and drive innovation.  Open data portals are particularly useful in times of crisis or major incident when multiple agencies require access to the same data and/or may be limited in context of  data sharing agreements either ad hoc or formal.

Current Empire State Data Portal Offerings

Today, geospatial data portals across the Empire State have a variety of aliases including Open, Gateway, Hub, even the old school Clearinghouse title.  For the purpose of this article we’ll take a look at a range of the current publically available sites focusing on current content and some of the general functionality as it relates to the GIS/geospatial user. Sites included are those currently available in New York City, state government, and at the county and municipal.  It is by no means inclusive of all the sites across the state though for the ones itemized below, take a drive and see what you find.

 Map Services vs. Files

Accessing, or consuming, geospatial content has changed significantly since the early years of data sharing.  The term “open data” was barely in the geospatial vernacular in old school GIS with many sites providing access to data which was governed by formal data sharing agreements and/or requiring some kind of organizational membership.  Offering file-based downloads to support, which at the time, was a heavy-client software-based world of GIS computing.

While file-based downloads from the myriad of portals across the Empire State are more than adequate for most users of the sites, GIS/geospatial users often have software enhanced capabilities to consume large volumes of data content in both client and browser applications via map services.   Consuming web services is now even an option within certain versions of AutoCAD which greatly expands the use of government authored and published geospatial content.

Given the option of having to take the time to download numerous individual files vs. consuming one map service with many data layers and picking only the data layers needed – the choice is often pretty obvious.  As such, data portals which offer geospatial content as a service (or by extension developer tools to provide similar functionality) increasingly have added value to the GIS/geospatial user.

New York State Government

HEALTH.DATA.NY.GOV & DATA.NY.GOV

Launched approximately around the same time in 2013,  these two portals provide lots of file based content for the GIS/geospatial community.  Built on top of Socrata software (Tyler Technologies) the two sites differ only in content. DATA.NY.GOV serving more as a generalized repository for state agencies (and selected local governments) and HEALTH.DATA.NY.GOV focusing specifically on public health related datasets.  Creating an user account (if needed) provides developers and publishers to identical tools and documentation to each site including customization options, database connections and API endpoints, metadata documentation, visualization tools, and more..  Both portals as part of the broader Open NY initiative.

While centralized data access and data visualization (charts, dashboards, etc) have always been a primary Socrata focus, the software also includes a basic toolkit  to map and render datasets which include coordinate geometry.  Both sites also include the ability to download datasets in a variety of formats including KML, KMZ, Shapefile, and GeoJSON which can be used by a wide range of GIS software platforms.

Users of DATA.NY.GOV site need to be aware this site ALSO includes content from other statewide Socrata sites (HEALTH.DATA.NY.GOV, NYC Open Data, and  Open Data Buffalo) so it is important to use the filtering function in the lower left corner of the page after the initial data theme/category has been selected.  For example, in the image below, after selecting the “Transportation” category, the application returns 521 records – which includes those meeting the same criteria from the other three statewide Socrata sites. (And in this category many from the NYC Socrata library.)   After filtering for “This site only” (DATA.NY.GOV) the application returns just 251 records.  A small nuance but filtering does help if the search is specific to certain jurisdictional or geographic footprints.  Also, when searching for state agency data across the available statewide portals, users will begin to see that some agency data is published and available on more than one portal.  For example, some state agency data can be found on  DATA.NY.GOV, CUGIR, and the state Clearinghouse.
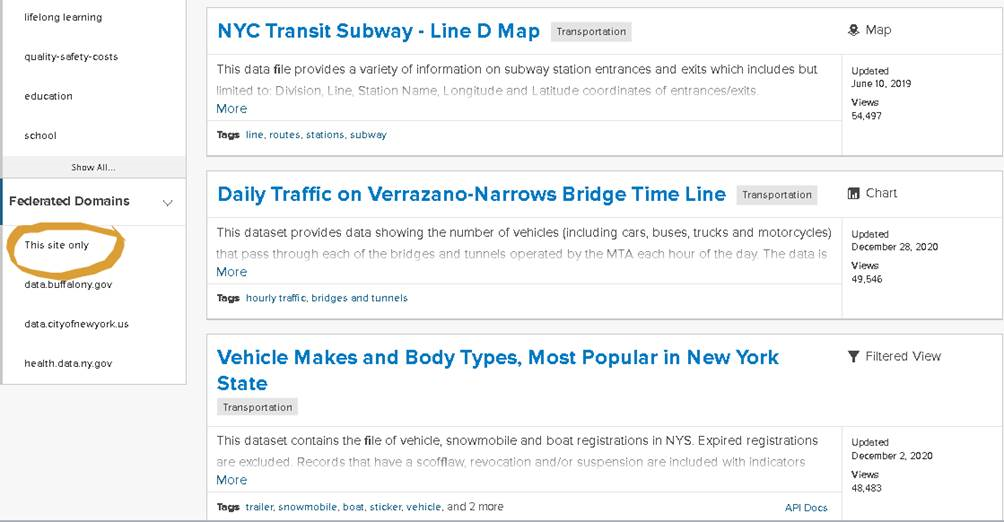
The filtering function on DATA.NY.GOV limits the search to specific domains

Plenty of geospatial data in both of these state portals albeit as the GIS community has come to know during the COVID-19 pandemic, address or large scale data is hard come by in the public health space.  Respectfully a whole other discussion and until there are fundamental changes in how public health data is published, it will be difficult for non-public health agencies, advocacy groups, or the general public to access such data at units of geography smaller than the county level.  Or sometimes if one is lucky, finding some at the zip code level.

For additional information on how to export Socrata data to other formats and/or platforms see this help document.  Also, Koop software is an Open Geospatial ETL Engine which enables users to leave geospatial data where it lives and transform it into a variety of formats including GeoJSON, CSV, KML, a Shapefile, or Feature Service dynamically.

There is apparently ongoing work/research within the state GIS offices with regard to both mapping NY Open data using the Socrata JavaScript API as well as enabling the Socrata platform to use the NYS GIS Program Office geocoder.  If successful, such efforts will greatly expand the Socrata data portals for the geospatial community.

NY Department of State Geographic Information Gateway

Launched in 2015, the Gateway is administered out of the NY Department of State, Office of Planning, Development and Community Infrastructure and is now home to over 700 datasets. The Gateway is an online mapping application that makes it possible to view geographic information in its native viewer or Google Earth and users can also download information in multiple file formats or even pull into other online mapping applications.  While the original geographic footprint of the Gateway focused on New York’s offshore planning area in the ocean and State’s portion of the Great Lakes, the repository now contains a wide range of geospatial datasets covering the entire State.

The Gateway has datasets  grouped  thematically and made available as map services. All content includes accompanying metadata enabling users to identify which data layers to select and easily consume from within the composite map service.    Perfect for desktop or web client mash-ups and analysis.  The site also includes links, integration, and content with crowdsourced apps.

The Gateway is a must see site having itself apart from other NYS departments in context of building a geospatial data portal with so much functionality and content.  There is a good chance you’ll find content for your GIS project here.
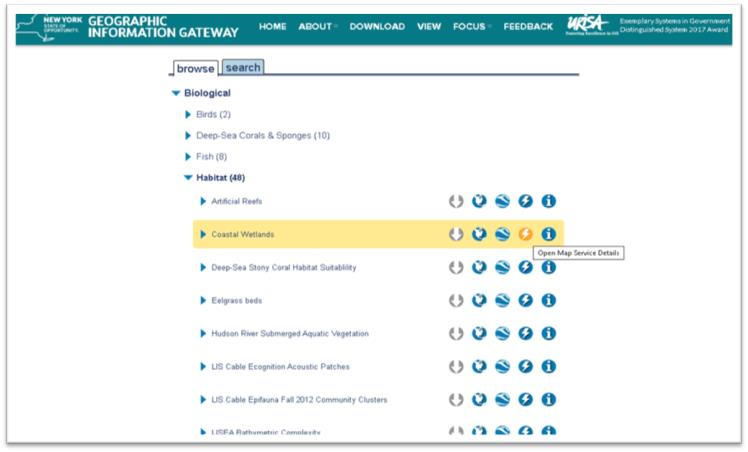
The Gateway data browser has icons for actions that can be taken with desired datasets; download, view in native map viewer, export to Google Earth, information for ingesting as a map service and metadata.

 NYS GIS Clearinghouse

The Clearinghouse was originally implemented in the late 1990s to facilitate statewide data sharing.   For many years it was the defacto #1 portal for all things/files GIS.  The focus being based on formal/written data sharing agreements between government and non-profit organizations. Amazingly in 2021 these agreements are still part of the Clearinghouse administrative structure though it does not get in the way of non-data sharing members – even those from industry and business – from downloading many datasets.  Give credit to those individuals who helped create the original Clearinghouse as it was one of the first of its kind at the time.

Much has changed since the Clearinghouse was initially launched which has impacted the data component of the site.  Time itself, and in this case decades, has proven to be a major challenge.  Publishers have come and gone, numerous retirements and point of contacts no longer exist, and limited metadata and datasets being out-of-date.  It’s a next to impossible to manage and keep most of the data files up-to-date and uniquely different in portals like the Clearinghouse.  Given the new generation of geospatial data portals that  we should expect to continue to emerge (particularly at the local level), the relevancy gap of the Clearinghouse’s data file inventory will likely continue to widen.  To say the least of the role of other similar data and web services available online via other free government and business sites such as The National Map, EPA Envirofacts, and ESRI’s Living Atlas.

The upside is the Clearinghouse is emphasizing and pushing data content  as  web services having placed this “option” at the top of the data catalog list. Seemingly to encourage users to “try this first” before sitting down and mining through the catalog on a file-by-file basis.  Much of the web service content are from the go-to State GIS office program areas (imagery, elevation, addresses, geocoding services, and to a limited degree tax parcels) albeit other state agencies are contributing services as well.   Kudos to the state agencies are keeping their individual file catalogs up-to-date and current albeit as earlier mentioned some of these state agencies are placing data on multiple portals requiring users to search in more than one location.
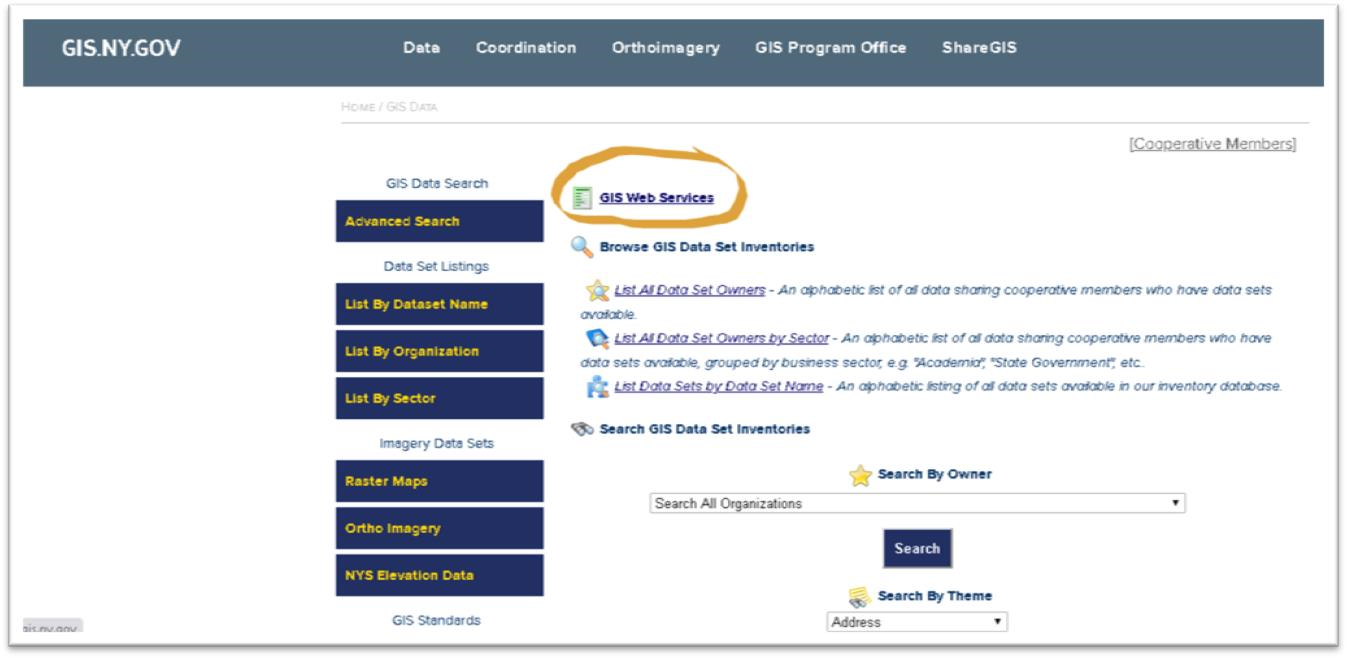
Instead of performing file based searches, users can access content via map services from a variety of state agencies

Hopefully, the legal shackles of the Clearinghouse data sharing agreement – instituted in the previous century – alone do not continue to influence the long term focus of the Clearinghouse with regard to managing and publishing individual datasets. One day, the statewide geospatial community would probably be better served when all of the remaining relevant  Clearinghouse datasets are consolidated into DATA.NY.US or CUGIR.     And perhaps leave the Clearinghouse to focus just on publishing data as a service with the current capacity it has built.

Municipal Government

NYC Open Data

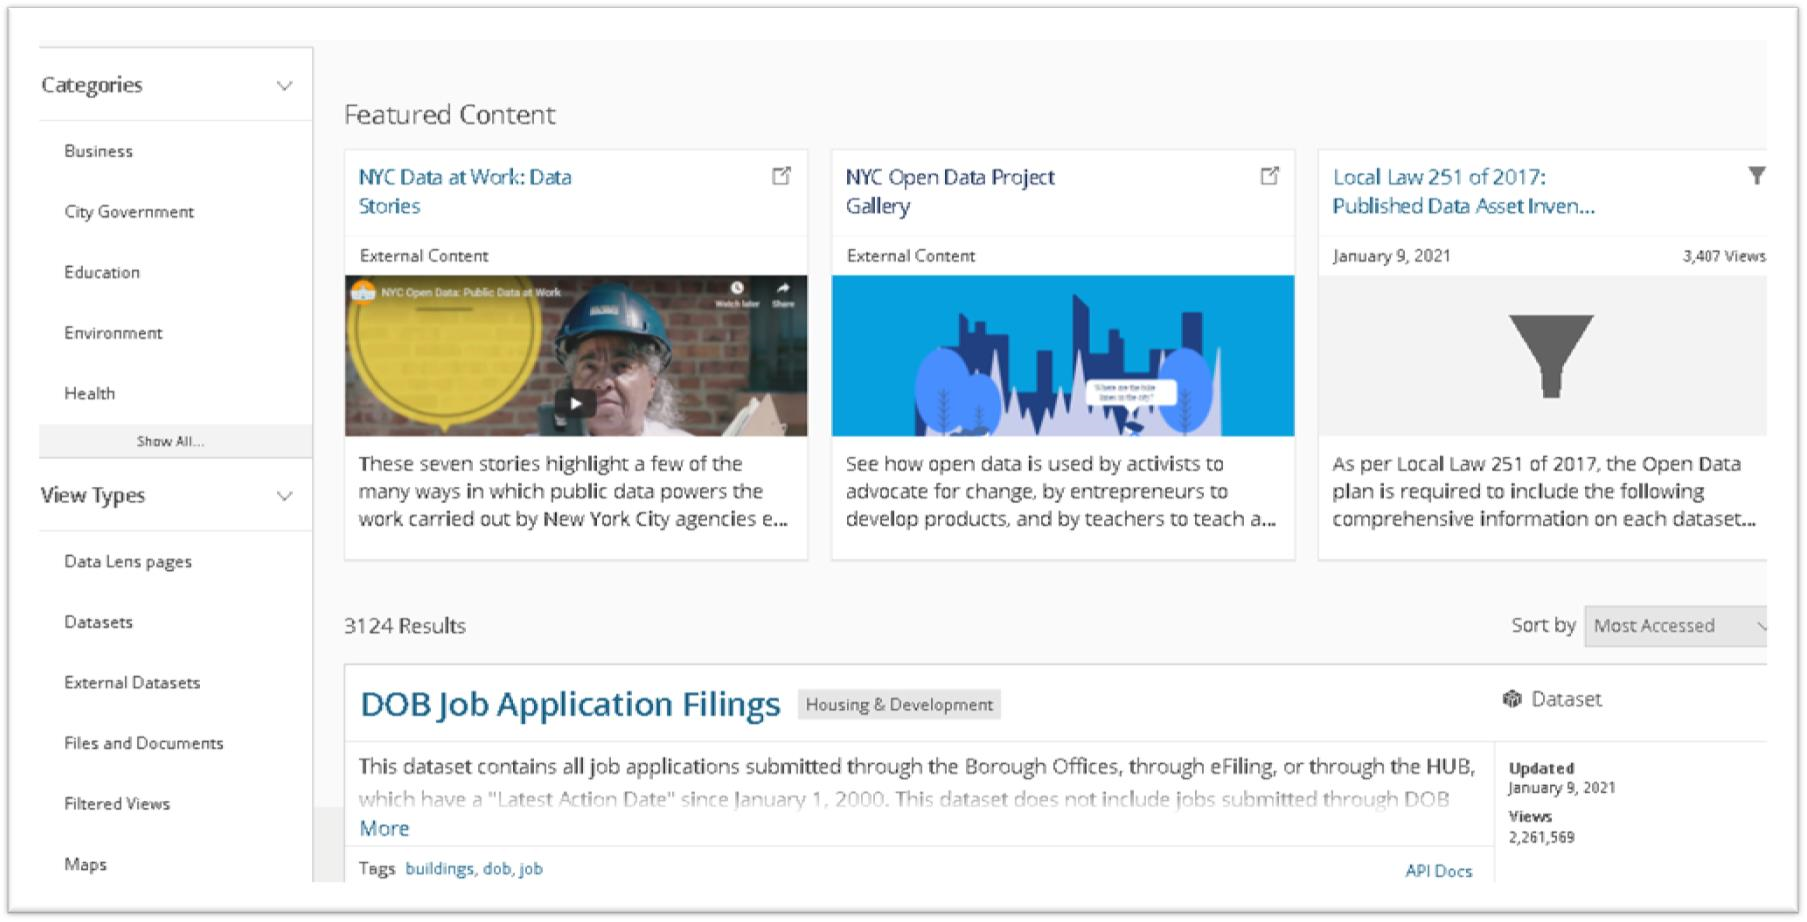
Another Socrata site, NYC Open Data is the big kid in the statewide open data sandbox with over 3,000 datasets grouped into just five categories available from nearly 100 reporting NYC departments.  In addition to just datasets, the site also includes files, documents, and external links.  So, if you are looking for geospatial data for the NYC geographic footprint this is the place to go.  The site has been around for several years already and is the creation of the  Mayor’s Office of Data Analytics (MODA) and the Department of Information Technology and Telecommunications (DoITT). As a hub of analytics in the City, MODA advocates for the use of Open Data in citywide data analytics and in the community.
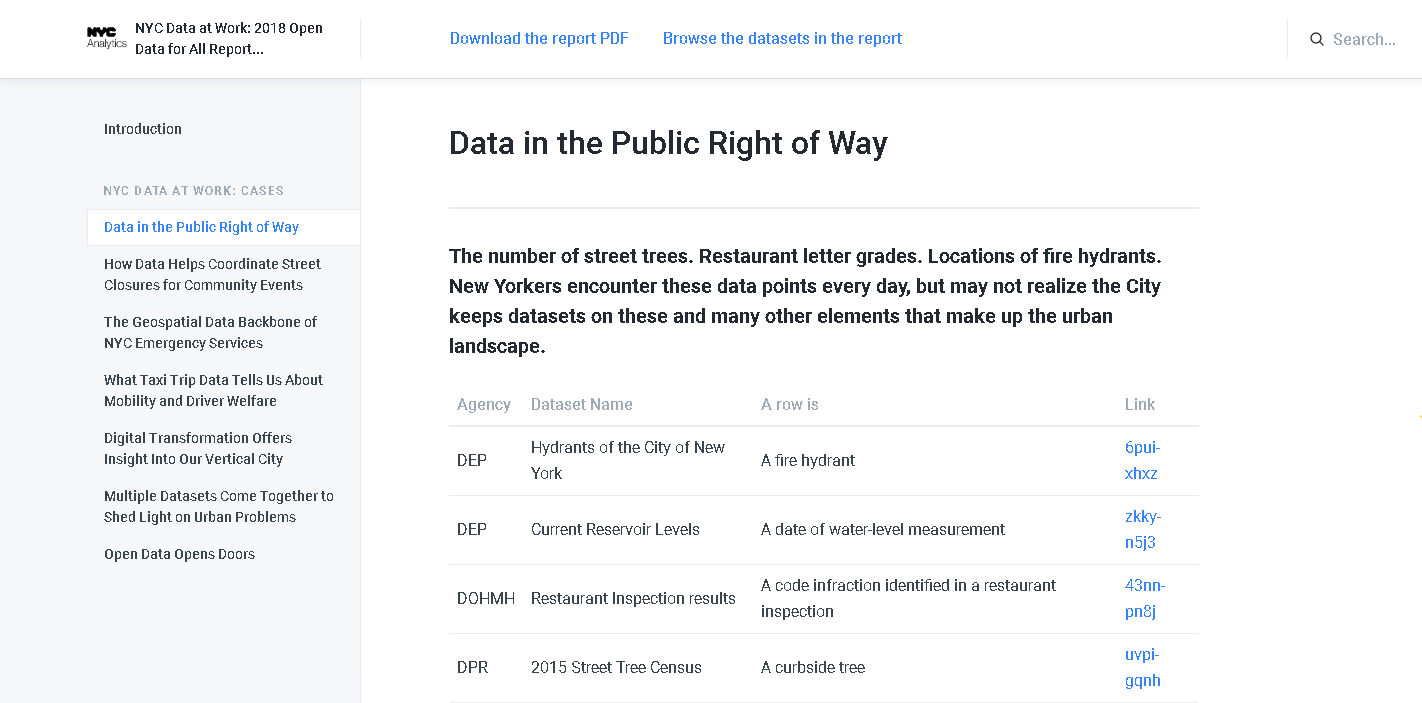
The NYC Open Data Portal also provides excellent narratives and examples of how geospatial data is used and is critical to the operations of city government.

NYC Open Data exemplifies the use of open data giving rise to a broad user community including organizations such as BetaNYC which hosts events such as the NYC School of Data, Open Data Journeys, various Open Data Classes, and in concert with the Mayor’s Office, the signature NYC Open Data Week – this year March 6 – 14. And data from the portal is routinely used in the NYC BigApps competition.

To fully appreciate how far open data has come in NYC, take a look at the list of publications and reports on this web page which chronicles its growth over the past several years.  And if you need further convincing, take a look at the NYC Open Data Project Gallery.

Go to the site and drive around.   Its worth the ride.

City of Rochester (DataROC)

Cities are great units of geography to build data portals in that their governments often oversee management of all the geographic features and data within the municipal boundary footprint.  Albeit this does vary on occasion with regard to utilities and some infrastructure  Geospatial data is consistent at the city level as government business applications are built and deployed to capture data to the same geographic extent.  As city applications continue to be geo-enabled, and open data initiatives are initiated,  this geofencing of the data provides a consistent geographic extent and a great framework to support a geospatial data portal.

DataROC was launched in 2020 and due to the city’s long time relationship with ESRI and staff who are statisticians and/or business intelligence analysts.   “ESRI’s open data framework was a good fit for the city” according to Kate Day, Chief Performance Officer, Mayor’s Office of Data Analytics & Performance.   Prior to the rollout of DataROC, the city already had both a police data portal and a map gallery of different ESRI tools, so the first major part of DataROC was to bring previously decentralized content together and make it easy to search. GIS staff in the city’s IT department assisted as change champions to make sure that the wider GIS community spread out across the City were aware of what the focus of the portal was to be and drive more traffic to the  work analysts in various department had done over the years.  Currently there are 203 items in the city’s open data catalog containing data files, apps, maps, documents.  If you need geospatial data for a project inside the Rochester footprint, this is the portal to visit and search for data.
DataROC offers easy access to data, applications that feature maps curated for a specific purpose, featuring up-to-date data, and a gallery of web maps to get around the city

With regard to an “example” as how specific governments vet data to their portals, the City of Rochester “publishes anything that is classified as public data / documents / applications that have been requested to be published by an internal or external stakeholder, but only after they have been approved by a Data Governance Committee”.  This committee ensures each dataset is truly for public consumption (essentially that it poses no individual or group harm for being published, that it would not violate any law/regulation to publish, and that the dataset meets quality standards to accurately represent whatever subject is being depicted or summarized).

Other illustrative statewide local government data portals include the City of Buffalo (Open Data Buffalo), City of Albany (openAlbany),  Westchester County (GeoHub), and City of Syracuse (DataCuse).

Academic

Cornell University Geospatial Information Repository (CUGIR)

I’ve always been a huge fan of the CUGIR portal and related program offerings.  Housed in academia and on the fringe of the statewide GIS mainstream, its original homegrown portal was built  and developed in Java in the 1990s.   The current CUGIR portal was launched in January 2018 and  is is built on several modern open-source components.  The front-end interface uses GeoBlacklight — https://geoblacklight.org/  which is a collaborative project being developed by several universities, including NYU, Minnesota, Stanford, Princeton, UC Berkeley, Cornell, and others.  CUGIR has made various customizations, some of which have been incorporated back to the project.
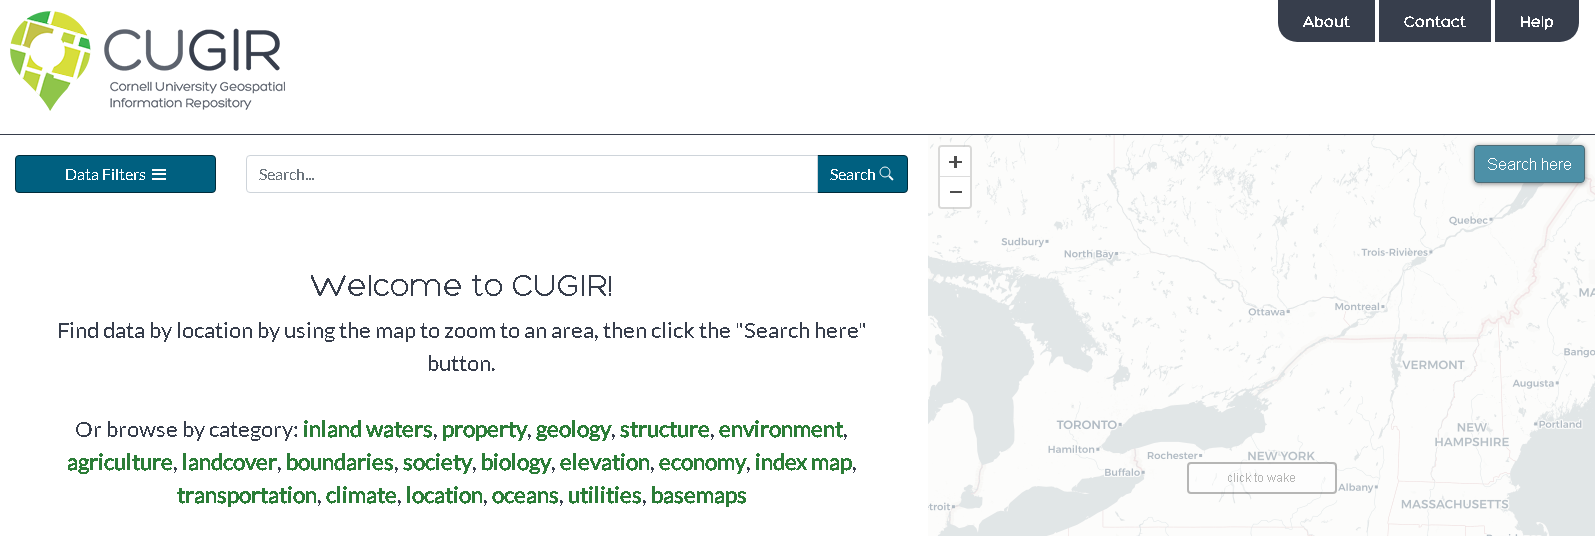
Subjects such as landforms and topography, soils, hydrology, environmental hazards, agricultural activities, wildlife and natural resource management are included  in the CUGIR catalog. All data files are cataloged in accordance with FGDC standards and made available in widely used geospatial data formats.

Behind the scenes, CUGIR uses Solr for searching and faceting (also known as “data filters”).  The site  use GeoServer to access copies of the data in a PostGIS database to generate map previews via publically-accessible WMS/WFS web services for each dataset.  Amazon S3 is used to host all the downloadable data as pre-generated zipfiles, so downloads are quick and reliable. The site uses  Leaflet to display the map on top of a CARTO basemap (which is built from OpenStreetMap data the web viewer.   Maintaining and supporting the site is long-time CUGIR GIS front man, Keith Jenkins.

Today, CUGIR’s datasets total about 15GB.  The total number of “datasets” listed in the catalog is currently 458, which appears much smaller than the nearly 8000 it used to be because in the old system CUGIR had content split up into many smaller downloads to accommodate the bandwidth limitations of the late 1990s and early 2000s.  So to leverage newer technologies and internet speeds, several data series were merged into statewide datasets.  As part of the process, CUGIR also converted old formats like ArcInfo Interchange (.e00) files to shapefiles wherever possible.  As part of the site upgrade, old links which had bookmarked or published were updated as well.  Today, NYS DEC and USDA NRCS have the most CUGIR records with other large catalogs from NYS Department of Agriculture and Markets and Cornell Institute for Resource Information Sciences (IRIS).   Data is also available from nearby Tompkins County GIS.   Excellent filtering tools enable users to search data by  several different categories  and download datasets in Shapefile, PDF, or KML format and export to either KMZ or GeoJSON.

CUGIR focuses exclusively on geospatial data which sets it apart from other general sites like DATA.NY.GOV.  The NYS GIS Clearinghouse and the NYS Geographic Information Gateway are more similar to CUGIR with each having their own unique datasets which in some instances can be confusing for someone looking for data and not sure where to look.  Additional CUGIR functionality includes pointing to and maintaining an index map to external datasets such as the National Elevation Dataset (NED).    Jenkins and his CUGIR team hope to build out similar functionality and integration with other Empire State geospatial portals in the future.
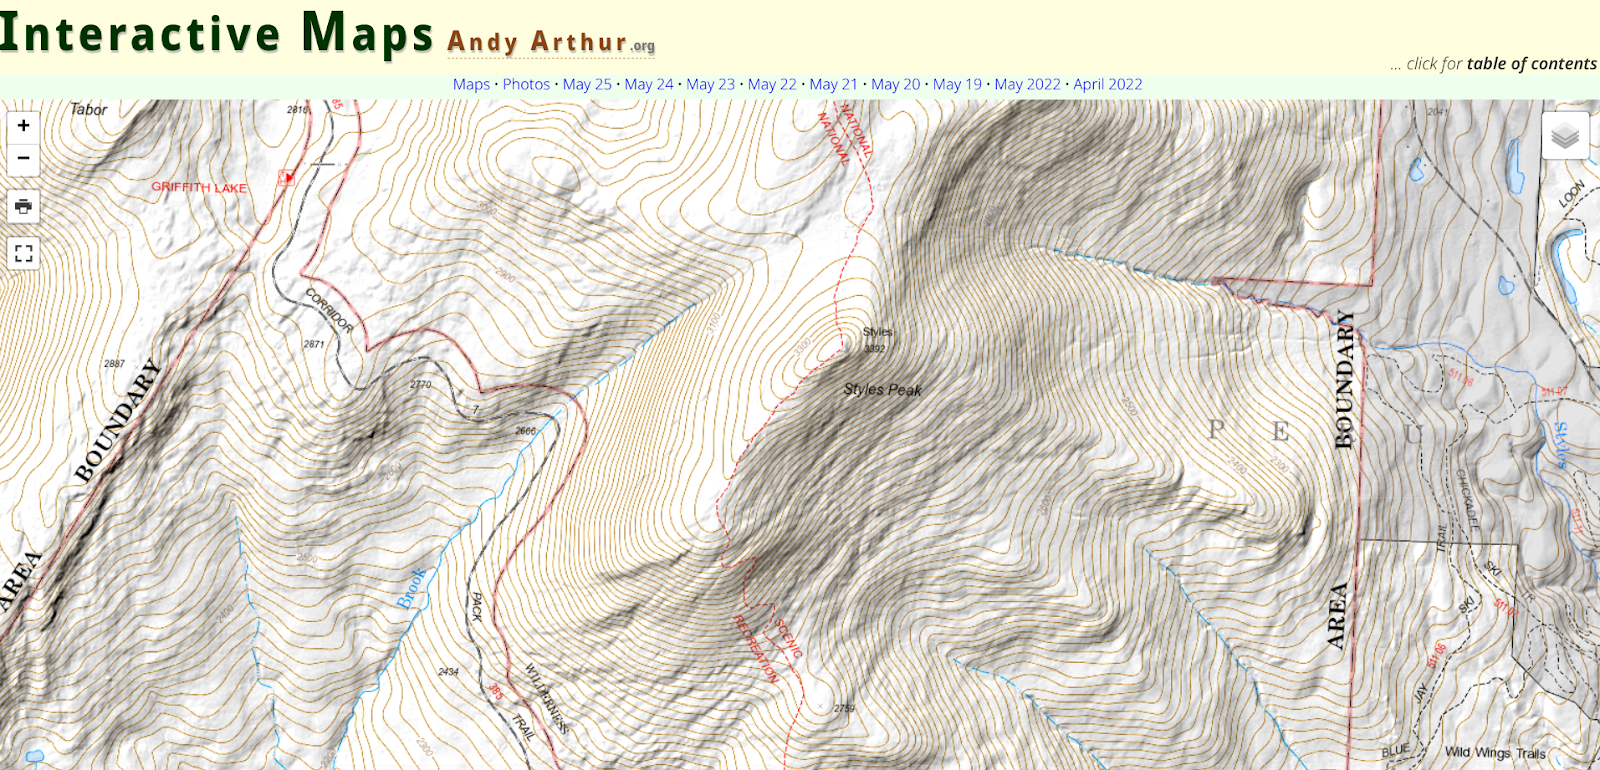
 

The Essential New York Climate Change Science Clearinghouse

There is no lack of geographic information these days on Climate Change and its increasing impacts across the Empire State in the areas of sea level rise, rising heat indexes, more frequent and intense storms, changes to the natural environment and critical habitats, and its influence on a broad range of public health issues to name only a few.  And we see geospatial technologies at the core of sciences being used to analyze, respond, and prepare for future consequences.

Whether it be policymakers, planners, business and industry, residents or community groups, New York State is fortunate to have its own geocentric one-stop website on climate change issues as part of the New York Climate Change Science Clearinghouse (NYCCSC).   Hosted by NESCAUM (Northeast States for Coordinated Air Use Management) , NYCCSC contains documents, data, websites, tools, and maps relevant to climate change adaptation and mitigation across New York State. The goal of the NYCCSC is to support scientifically sound and cost-effective decision-making. It was developed to provide a framework where users can find information in multiple ways, including through interactive tools that use data from different sources.

Established in 2015, the site today contains nearly 2100 resources including over 200 web maps and viewers and an assortment of data products and datasets and is curated by Ingrid H. H. Zabel, Ph.D.  Initially the site was populated by resources that had been referenced in the 2011 ClimAID Report and several other key documents, as well as resources identified by groups of sector experts.  Today, the site curator continues to seek out new content from a variety of sources to keep the site current and fresh.  Submissions to the Clearinghouse are welcome though each are reviewed based on relevance, utility, credibility, and accessibility as described in the site’s Business Rules.   The underlying mission of the site is to provide resources that are relevant to communities of many different sizes around New York State, are focused on practical, applied science and that are open access as much as possible.

Dr. Zabel is assisted by a Content Team and Sector Expert Groups consisting of individuals originally involved in the development of the site, from Cornell’s Northeast Regional Climate Center, the Paleontological Research Institution,  , Northeast States for Coordinated Air Use Management (NESCAUM), Frontier Spatial, and New York State Energy and Research Development Authority (NYSERDA). The sector experts were identified by NYSERDA, NYS Department of Environmental Conservation, and the NYCCSC team, and include individuals from New York state agencies, academia, and nonprofits such as (New England Interstate Water Pollution Control Commission (NEIWPCC),  , and the New York State Floodplain and Stormwater Managers Association (NYSFSMA).

Users can explore and mine through the site via ad hoc interactive mapping, topic specific web maps, data charts, and for published documents and reports.  In addition to offering advanced search tools, site content is also grouped thematically in categories such as Climate and Weather, Sea Level, Energy, Flooding, Plants and Animals, Social and Economic, among others.

Some options on the user interface to dive in and start searching for data include:

Interactive Mapping and Web Maps

One of the focal points of the website is an interactive map of climate change and related data for New York State.   Users can select data layers to display from a menu, filter layers by sector, vary parameters within certain layers, and select from a variety of base layers and regional boundaries. For each layer, links are available to metadata and the original source. Data being made available in the viewer has been curated through more of a group effort, with the NYCCSC team getting requests and feedback from a variety of places, including project managers (NESCAUM) and sponsor (NYSERDA).

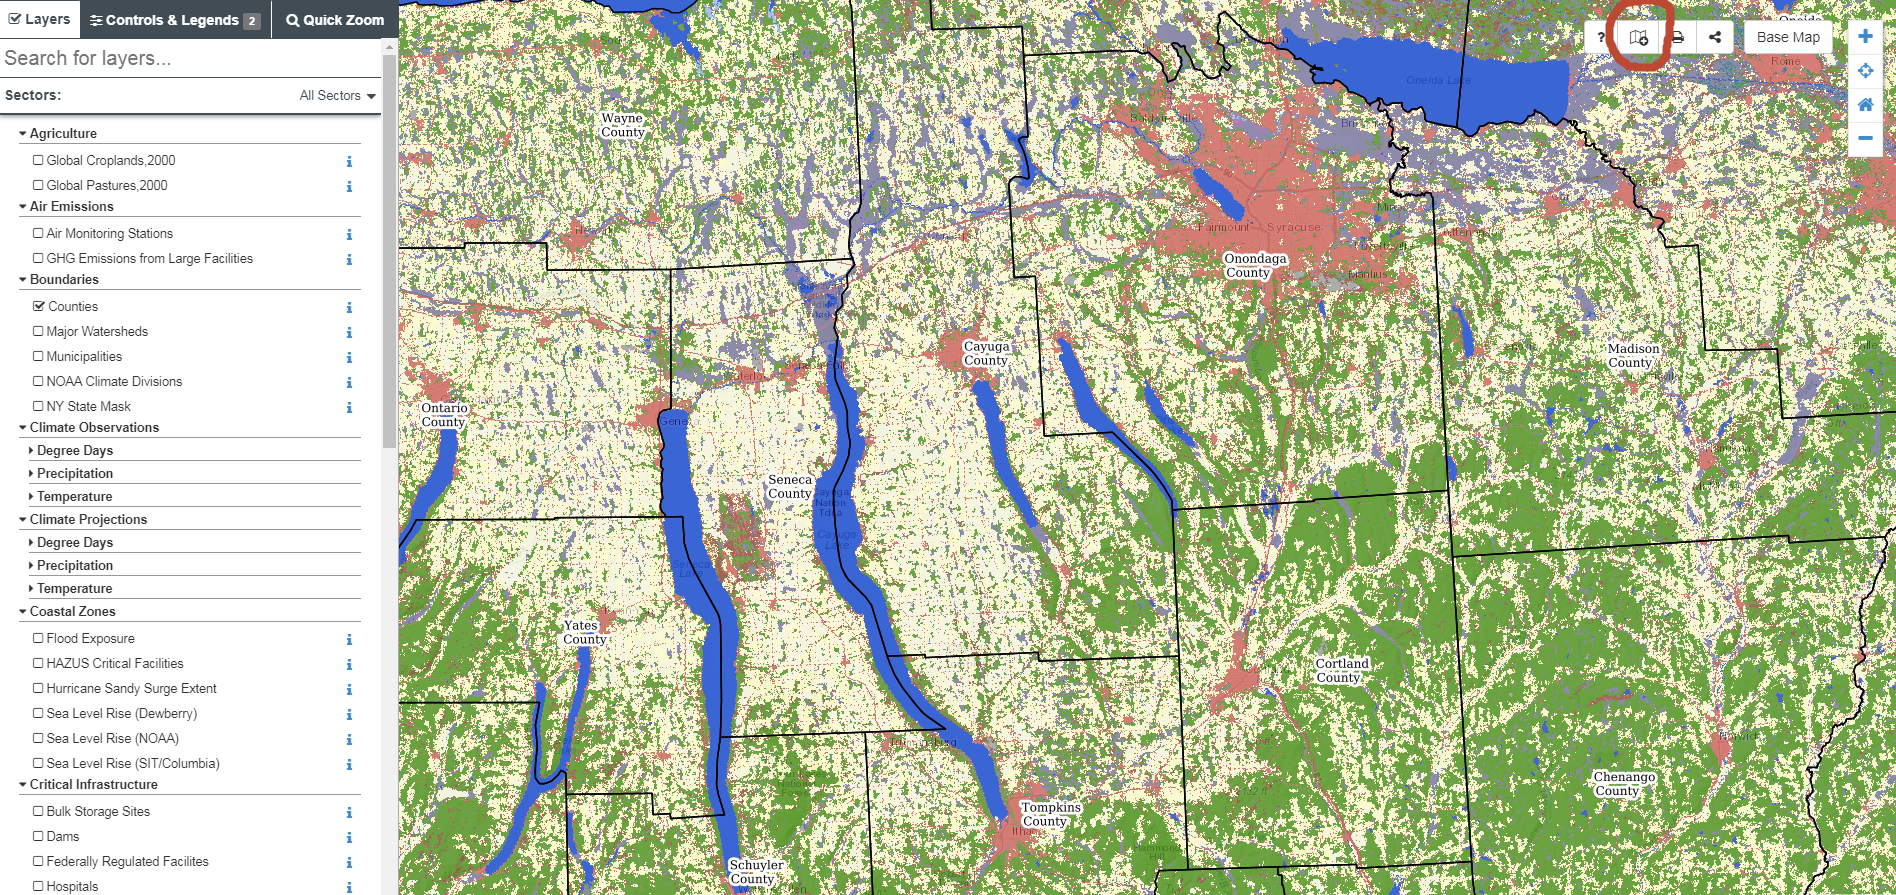
The NYCCSC interactive mapper also leverages map services from authoritative sources. For example, this GAP Land Cover Dataset is a service being published by the USGS. Users can click the ‘i’ icon for a given layer which provides metadata on relevant URLs. The interactive mapper also includes a function for the user to add a map layer of their own using the Layer Import button found along the toolbar in the upper right hand corner of the viewer (circled in red). Imported layers do not get added to the map permanently, but rather are a means to temporarily “mash-up” local data with the permanent collection of content in the application

The site is built almost exclusively with open source products and largely supported by Steve Signell at Frontier Spatial.  PostgreSQL is the geodatabase used to store and manage map layers and metadata.  A combination of Geoserver and Leaflet are used to create and manage the web services and support the user interface. Javascript and CSS coding was used to create the custom UI and map functions.

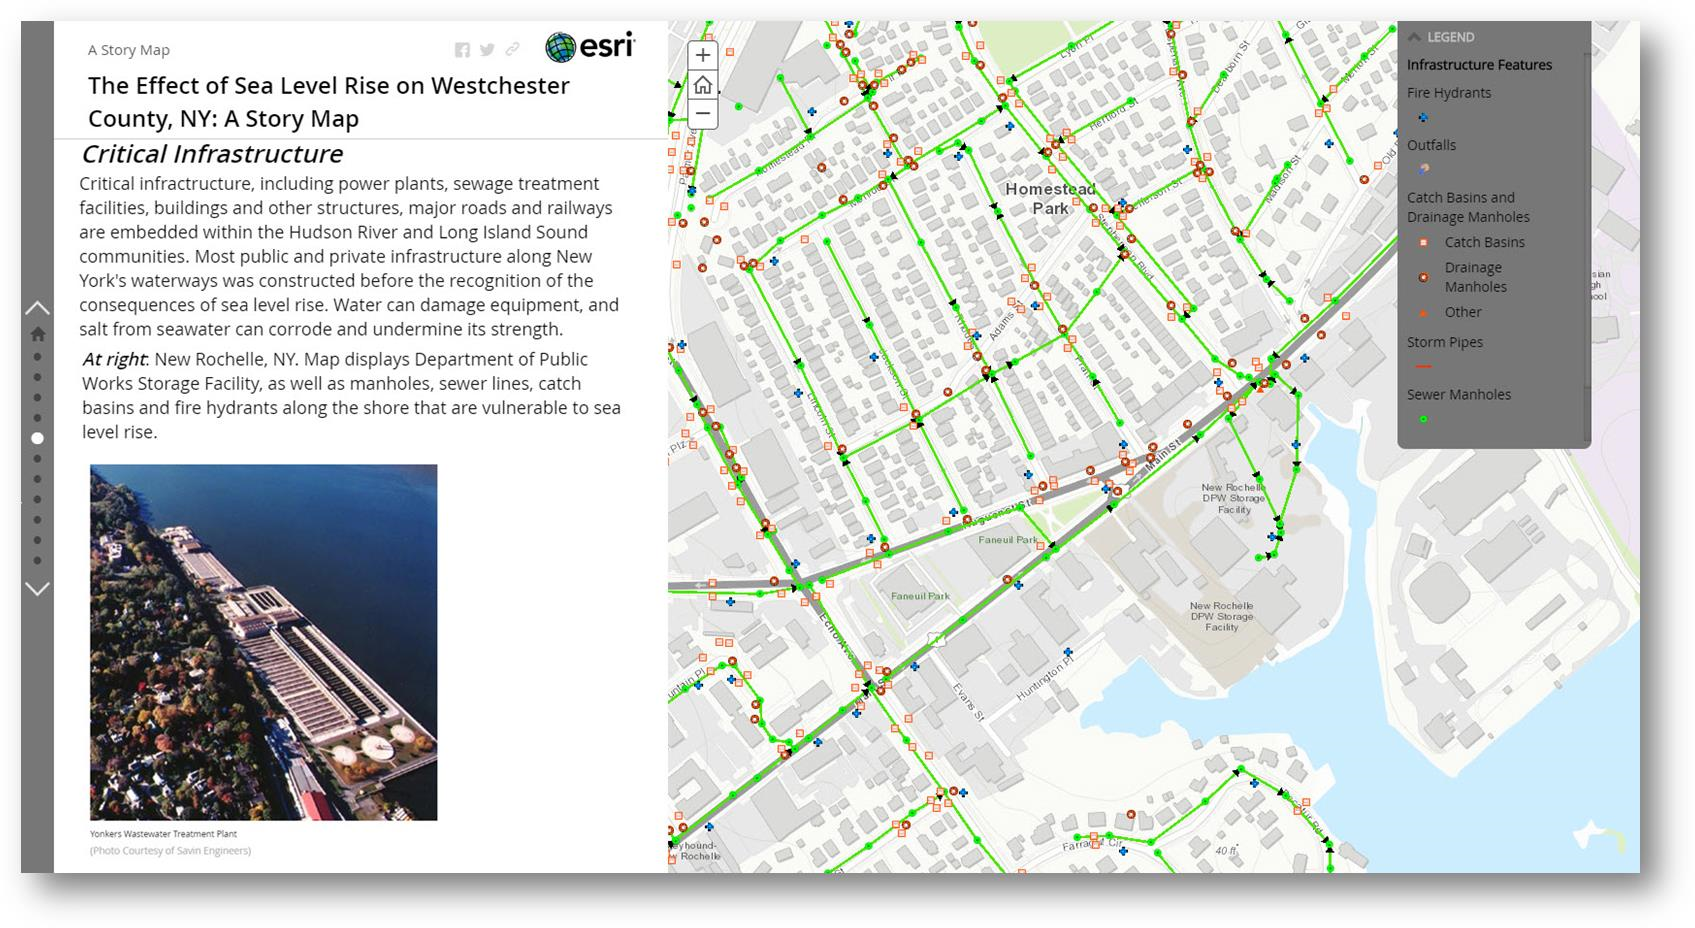
If you’re looking for standalone web and story maps for specific Empire State climate change issues – look no further. As the date of publication of this article, the site listed 203 separate maps from a wide variety of contributors including this one from Westchester County focusing on the potential impacts of sea level rise on critical infrastructure assets.

Among the many great offerings, sites found in the catalog of interest include The Natural Resources Navigator (The Nature Conservancy), New York State Geographic Information Gateway (NYS Department of State), Surging Seas Risk Zone Map:  New York (Climate Central), Environmental Justice Screening and Mapping Tool (U.S. Environmental Protect Agency), and Trees for Tribs Statewide Data Explorer (New York Natural Heritage Program) to name only a few.

Climate Data Grapher

User-generated time series graphs of climate data, both observed and projected (future and historical.)  The data grapher provides access to climate data which can be summarized by the user according to various geographic units such as counties. The same summaries are used in the maps & GIS viewer to attribute the corresponding map layers for county and watershed boundaries.  Both user interfaces (Interactive Mapping and Data Grapher) draw on the same raw data sources but offer different capabilities for query, summary and visualization.

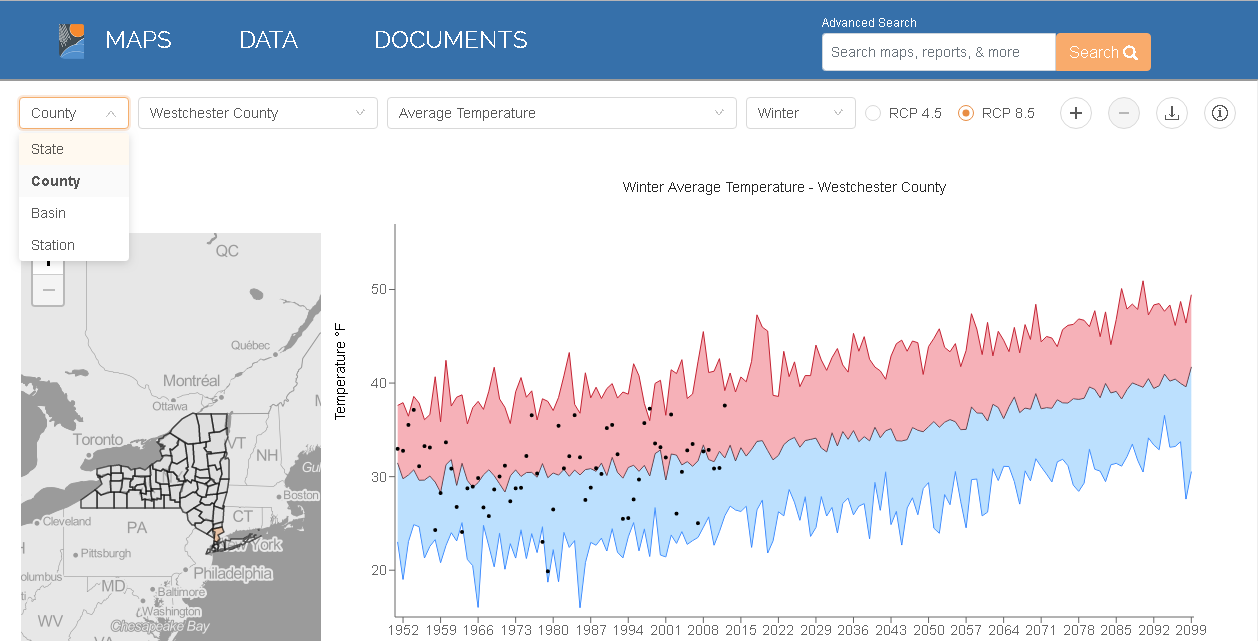
I used the interactive graphing tool to plot Westchester’s Winter Average Temperature. It’s one of
19 types of climate related data which can be charted by either geographic area: state, county, or river basin. (Upper left hand corner pull-down). Other datasets area available by gauging and/or weather stations. The chart renders different results depending on which RCP radio button (4.5 or 8.5) is selected. RCP (Representative Concentration Pathway) 4.5 and 8.5 are scenarios of future climate change based on varying degrees of societal progress in reducing human contributions to greenhouse warming.

Documents

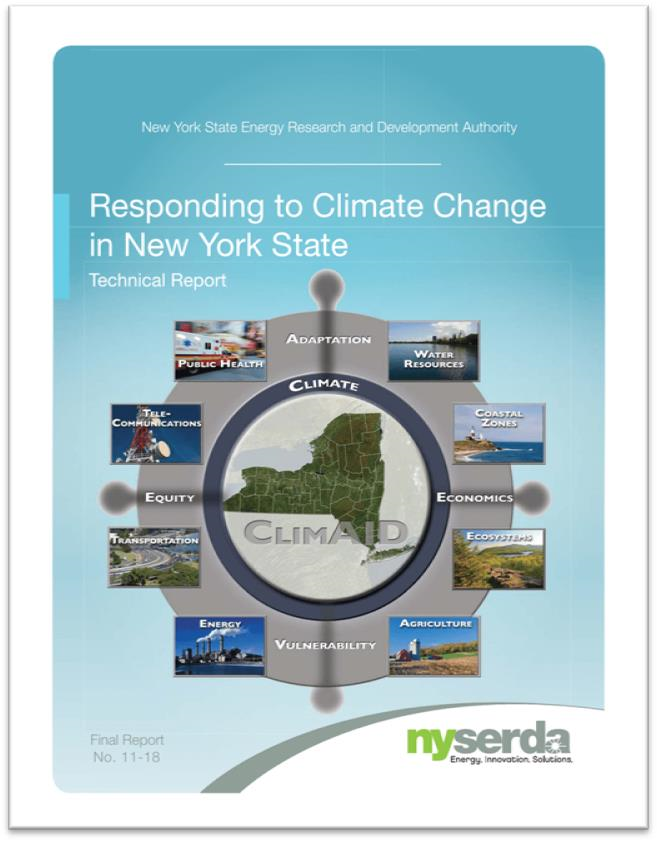
A wide range of documents and reports on statewide climate change issues including the author(s) or publishing agency, a pdf download option and where available a corresponding website URL. The first document itemized –  a document central to the launch of the site – is  Responding to Climate Change In New York State: The ClimAID Integrated Assessment for Effective Climate Change Adaptation in New York State: Final Report (2011) which provided information on climate change impacts and adaptation for eight sectors in New York State: water resources, coastal zones, ecosystems, agriculture, energy, transportation, telecommunications, and public health.

The 2011 ClimAID report is one of the first comprehensive and definitive compilations on the many challenges on impacts of climate change across New York State.

Summary

NYCCSC is a huge repository of geospatial and other content focusing on the ongoing and constantly evolving Empire State climate change issue being made available by a wide range of publishers including governments, academia, nonprofits, and industry.     And whereas much New York State climate change focus in recent years has concentrated on the impacts to our coastal communities (i.e., due to sea level rise, hurricanes/severe weather events, storm surges –  much of which is included in the repository), NYCCSC offers content and case studies covering the entire New York State footprint.   Sometimes, however, the scale of the data associated with individual sites can be an issue when looking at issues at the local level.   But nonetheless the data is there.  Itemized websites are always a good starting point for metadata, individual dataset downloads or access to public facing REST endpoints.  .

It takes a considerable amount of effort and oversight to keep such online clearinghouses up-to-date and to this end NYCCSC is fortunate to have an ongoing relationship with NYSERDA for continued support of the project.  NYCCSC continues to welcome submissions but does not accept every resource that is submitted. At the bottom of the site landing page there is a button labeled “Propose Content” which provides access to a form in which content can be proposed.

Contact:

Ingrid H. H. Zabel, Ph.D.
Climate Change Education Manager and Curator, New York Climate Change Science Clearinghouse
Paleontological Research Institution, Affiliated with Cornell University
(607) 273-6623, ext. 122
info@nyclimatescience.org
nyclimatescience.org

Views on the 2018 New York State Geospatial Landscape

There’s probably enough below for a couple blog posts but I ended up throwing everything in together and stirring it up – so to speak.  The language on Part 189 (tax mapping) could be a post by itself.  Kind of all over the place, even revisiting some topics I’ve touched on before as part of eSpatiallyNewYork.  Part wish list and part commentary.  Ten items. More or less.

  1. Promoting NYS Local and Regional Government GIS Development:  This is a frequent mantra of mine and with the  constant advancements in computing and geospatial technologies it’s worth considering on a regular basis.   And most certainly as part of this year’s wish list. Opportunities abound across the Empire State to help local and regional governments  jumpstart and/or solidify their GIS program.   For example, funding is available through the NYS Environmental Facilities Corporation focusing on infrastructure systems much of which is managed at the local level.  Or the large amounts of funding being made available as part of Zombie Remediation and Prevention Initiative through the NYS Office of the Attorney Genera  And the detailed inter-government discussions on the new Shared Services Initiative  which includes funding as part of the adopted FY2018 state budget.  GIS is the shared services technology. And regional GIS programs as part of the New York State Regional Economic Development Councils or by extension the New York State Economic Development Council?   GIS tools are at the foundation of economic development.   Not perfect fits,  but funding opportunities do exist in these program areas.

At the core of local and regional GIS programs is powerful server technology (local and hosted) that not only has the capabilities to support multi-government day-to-day business functions  but also provides the framework to publish geospatial content via map services.  Call it what you want Open Data, government transparency, or data sharing  but it is within this context that state agencies, nonprofits, academia, as well as  business and industry all have access to local data.  Let’s have 2018 statewide focused discussions on extending local and regional GIS capacity based on cost effective and server-based multi-government initiatives.

  1. Building GIS Association Legislative Capacity: While the Association has grown in so many positive ways over the past decade, the challenge continues for the organization to have its presence and mission heard in Albany’s governing hallways.  It is no small effort – organizationally and financially  to build this capacity.  Many similar professional organizations have full-time staff and Executive Directors whose job is to create awareness among elected officials, secure funding, and promote/influence legislation on behalf of the membership.    But currently the Association’s legislative efforts are in the hands of member volunteers.  And while Legislative Committee volunteers were able to coordinate a “Map Day” last May in Albany to introduce the Association to elected officials, the Association has yet to establish itself on the same playing field of recognition with other statewide geospatial heavyweights such as the New York State Society of Professional Engineering, New York State E911 Coordinators, and the lobbying efforts of large New York State based geospatial businesses.  Complicating the equation are Association members who hold licenses or certifications in other professions (i.e, engineering, surveying, photogrammetry, landscape architecture, AICP,  etc) and find themselves in a quandary as to support the Association’s agenda or the profession/discipline which holds their license.  To some degree, this issue manifest itself as part of the discussion with the Geospatial Data Act of 2017 which initially had lines of support drawn heavily along professional affiliation.  The Association must keep up the good effort and find a way to compete on the Albany stage.  Let’s hope the Legislative Committee can build upon its 2017 accomplishments and make further inroads in 2018.
  1. New York State Geospatial Data Act of 2018:   Not really,  but it DOES sounds great – right?   Close our eyes and make believe there is a state-equivalent of the much hyped (Albany) federal National Geospatial Data Act (NGDA) of 2017.   Just think of it:   A process across the Empire State in place to magically aggregate our local government tax-payer funded geospatial data assets into National Spatial Data Infrastructure (NSDI).  Newly appointed and designated state agencies responsible for providing support (similar to the designated federal agencies)  to make our geospatial contributions consistent with the federal data themes and standards as outlined in Section 6 and 7 of the proposed NGDA legislation.  Ultimately being made available via the GeoPlatformContinue reading

2017 GeoCon Wish List: Part II

In January of this year, I published my first 2017 GeoCon wish list relative to geospatial mapping applications and topics I’d like to see as part of the Lake Placid October 17-19 conference.  Since January, writing and publishing eSpatiallyNewYork has enabled me to communicate with a wide range of individuals and organizations involved in geospatial programs across the state  – some of which are included in the list below.  Others itemized on the list are new business start-ups,  government and nonprofit initiatives, and programs involved in the emerging drone technology.

So without any further adieu, here is Part II itemizing geospatial topics and program areas I’m advocating for 2017 GeoCon in Lake Placid.  Speakers, presentations, and ideas to mix things up and start some new discussion – and why.

Opioid Crisis Mapping

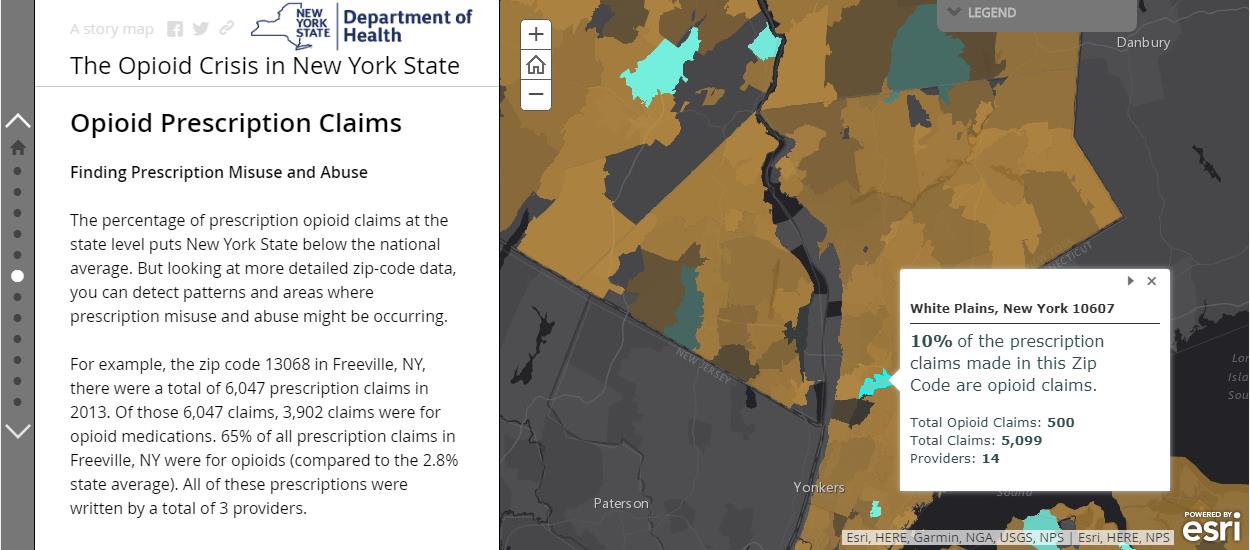
With the opioid crisis well documented in New York State, Story Mapping and data visualization help further detail the magnitude of this public health issue to a much wider audience.  Story Maps also enable authors with much greater flexibility in developing a narrative to accompany the data which might be otherwise be difficult to interpret or understand with just a map by itself.  Here in New York, it’s the hope to see greater use of Story Mapping (not just ESRI’s solution – all platforms) by agencies and organizations which historically have been reluctant to publish maps due to concerns of data which might be sensitive or misinterpreted.  This Opioid Story Map provides a powerful message and can prove to be a catalyst in seeing other statewide public health data being published in a similar geographic format.  It would be interesting to hear more from this Story Map author(s) about the datasets used (availability, sensitive/non-sensitive, sources, etc.) and possible collaboration with other GIS programs and agencies at the federal, state, and local level.  See also the Northern Kentucky Story Map:  The GEOStory of Opioid Addiction and The Urban Observatory: The Opioid Epidemic.

Story Maps provide an easy and powerful framework to combine narrative and maps which is often very helpful when publishing sensitive or “difficult” to interpret data. Publishing agencies have can better help how data is interpreted and read.

New York State Wildland Fire Mapping

Nothing special or cutting edge here geospatial, but I’ve always had a soft spot for wildland fire maps having served on U.S. Forest Service interregional fire crews back in the day in both Idaho and Montana.   Though in context of publishing fire data, it’s unfortunate how little capacity New York State Department of Environmental Conservation (DEC) has built in context of publishing their data and products as services. Not that statewide wildland fire data and map services would be a top seller for DEC, but the image below (scrapped from the DEC website) speaks to the continued reliance on static maps and other enterprise map applications  which cannot be consumed by other viewers.  The map is actually interesting in showing how there are more fires per square mile closer to urban areas (red) than in the more forested areas such as the Adirondacks – where most would think wildland fires occur and with more frequency.   Publishing this type of data as some type of map service would Continue reading

GPS Telematics for Fleet and Mobile Workforce Management

Several of my posts over past 18 months have focused on a core set of applications which I have seen evolve over the past three decades that serve as the cornerstones for many New York State local and county government geospatial programs.  Increasingly and central to many of these geospatial program areas is the “mobile” component albeit much of the attention to date has been on “field/handheld” hardware and software components for both spatial data collection and updates.

Increasingly  it is becoming recognized  another mobile collection technology can add value to  an organization’s work force and business systems productivity.  Originally referred to as Automated Vehicle Locator (AVL) systems, this technology got its start decades ago focusing on the capture (mapping) of a vehicle’s location and display in a GIS or similar digital mapping system. These early systems were expensive and not widely used outside of business and industry.

Over the last five or more years,  fleet managers have increasingly adopted “AVL” technology to assist in the management of  fleet assets especially with availability of lower cost hardware components which connect  to vehicle On Board Diagnostic (OBD) ports.  This capability supports fleet managers with a wide range of metrics  providing  odometer/mileage readings, engine idling, vehicle usage and a variety of other vehicle related information.  Now recognized as “GPS Telematics”, this technology has become more affordable and accessible to a larger range of government agencies and organizations.  This modern use of the technology centers around the use of M2M (machine to machine) and telematics technologies.

Benefits of GPS Telematics

To date, much of the work focusing on capturing and analyzing data associated with field resources has been done the “old way”, i.e., capturing and recording the data by human fingers.  Historically, this method is fraught with inconsistencies. Machine-to-machine (M2M) data capture on average is far more accurate and consistent.

Fleet telematics monitor the location, movement, status and behavior of a vehicle and associated field resources.  This is achieved through a combination of the  GPS telematics device which is installed in each vehicle transmitting  location based data via wireless networks to web servers for near real time availability.  Users access location, movement and status information and metrics of vehicles via special web-based software applications or through existing in-house “vehicle tracking enabled”  business applications.  In essence, GPS telematics systems become platforms to collection and transport valuable mobile resource field information and activities.  In addition to locational data,  fleet telematics solutions provide the status of each vehicle and by extension the corresponding crew an inference of  ongoing work accomplishments and assignments to field resources.  Managers know how each vehicle is being used as well as mileage, idling status, location and speed.  Such systems can be extended to be connected to onboard systems and sensors which log activities such as street sweeping, plowing, spreading, and spraying – workflows which are particularly challenging to capture and document by hand during the normal course of business.  While Return-on-Investments (ROI) can and will vary greatly, calculating the benefits of investing in fleet telematics technology can now be  based on factual metrics such as improved routing and dispatching, reducing labor costs, improved fuel and vehicle usage, and newer more cost-effective system architecture (Cloud). Continue reading

Geospatial Business Spotlight: The CEDRA Corporation

Company Name:         The CEDRA Corportation

Location:                     1600 Mosley Road, Suite 500, Victor, NY  14564

Website:                      http://www.cedra.com

Employees:                 12

Established:               1985

The CEDRA Corporation offers GIS based software for mapping, civil engineering design and modeling, surveying and database maintenance applications. CEDRA’s AVseriesTM suite of software operates directly within Esri’s GIS software (ArcGIS® 9.x and 10.x), thus eliminating the need to switch back and forth between various software packages. CEDRA software is developed entirely in-house and marketed worldwide to public works agencies, tax assessors, utilities, municipalities and private sector companies.
Complementing CEDRA’s Software Development Division is CEDRA’s Professional Services Division which has performed consulting projects throughout the U.S. and specializes in developing, populating and maintaining GIS databases.   CEDRA’s Professional Services Division offers consulting services to clients for a multitude of applications including CEDRA-specific software solutions or can be totally non-CEDRA software related consulting projects. CEDRA staff is highly proficient in GIS Analysis, Data Capture, Data Conversion, Map Production, Routing and Custom Application Development in toth the desktop and server environments.  As an authorized Esri business partner and reseller, CEDRA has a long history in the use and application of Esri’s GIS suite of software dating back to 1987.

CEDRA’s corporate mission is to provide services and software that improves the efficiency and productiveness of its clients. This goal is achieved by (a) developing software that is production oriented and (b) offering services that enable clients to streamline workflows. CEDRA believes the more automated a workflow can be made, the more efficient a client will be and a higher quality product will be produced. CEDRA offers Expertise, Experience and Commitment when undertaking a project.

Illustrative CEDRA products and services include:

Wayne County E911, Lyons, New York

Under this project CEDRA assisted Wayne County staff in developing the County’s E911 street database. Specifically, the work involved acquiring the NYS Street Address Mapping (SAM) data, extracting the street data for Wayne County, and working with the County in verifying and updating the street center line database for use in the County’s E911 system.

In performing this work, CEDRA staff was on-site at the County’s office performing the work and training County staff in the process. A workflow was developed and adopted by the County. Additionally, a training guide was developed enabling County staff to maintain the street center line data with their own resources. Continue reading

10 Questions: David Bubniak

I’ve been going back and forth with David Bubniak for several months on doing a piece on his geospatial work and efforts with the Southern Tier Central Regional Planning and Development Board (STC) where he has worked for over a decade.  Covering three counties – Chemung, Schuyler, and Steuben – David’s GIS work with STC covers many program areas. A lifelong Southern Tier resident, he and his wife and their two sons live in Waverly,  New York.  David can contacted at gisstc@stny.rr.com.

eSpatiallynewyork:  How long have you been with Southern Tier Central Regional Planning and Development Board (STC)?

Bubniak:  I   started at STC in 2005 and worked here for a year. I left and went to work for James Sewall in the Elmira office (formally Weiler Mapping). I then returned to STC in 2008 and have been here since. Prior to STC, I worked for the Chemung County Metropolitan Planning Office (MPO)  in the early 90’s as a transportation GIS analyst. I then became the General Manager of Chemung County Transit. I then went back to doing GIS in the Northern Tier of Pennsylvania for Northern Tier Regional Planning.  A good friend of mine is a surveyor and I worked with him on the side periodically over the years doing property surveys, deed research and construction layouts.  Those experiences have helped me significantly over the years understanding how to assist people with GIS. I am the only designated GIS person in STC office though we do have planners that use it often.

eSpatiallynewyork:  When did you start doing GIS work?

Bubniak: I started using GIS in 1993. I attended Mansfield University and graduated with a Geography degree with an emphasis in Planning. We used Atlas GIS for projects. I worked part time at the Chemung County Planning department right after I graduated in December 1994.  My first project was mapping senior citizen migration from rural areas back into the City of Elmira for the Department of Aging. When I started at the Executive Transportation Committee for Chemung County (Chemung County MPO) in 1995 I used Unix based  pcARC/INFO and AutoCad. I taught myself how to use both just by studying the manuals and using them for projects. I then started to use ArcView when it was released.

eSpatiallynewyork:  What GIS products do you now use/promote? 

Bubniak:  I use both web and desktop applications. I use ArcGIS server as well as ArcGIS online for my web apps. I do promote both web and desktop apps. I have people using ArcView, ArcReader and ArcGIS Explorer.  I have the Elmira Water Board using ArcGIS desktop with several departments accessing data over their network using ArcGIS Explorer (desktop). The Chemung County Stormwater Coalition uses a combination of ArcGIS online, local data, and data through ArcGIS server.

eSpatiallynewyork:  What agencies/organizations do you work with most closely?

Bubniak:  I do a lot of work for Chemung County departments and towns. I do get involved with the state from time to time. I function sort of as the GIS coordinator for Chemung County but not on formal basis. I work with the Stormwater Coalition, public works, Elmira Water Board, Real Property. I do work and assist several of the bigger towns in the county.

eSpatiallynewyork:  Tell us about the “Southern Tier Central Mapping Application for Local Governments”

Bubniak:  I have four basic parcel viewers. I have one for each county then one for the whole region. They all run the same data from a SQL database.  Chemung and Schuyler Counties connect their county sites to their SDG Imagemate Online application.  I have a Chemung County site tailored to soil and water, Public works and local code officials.  Many county departments and officials use it for their GIS. I have a bunch of project specific web apps I built using ArcGIS for Flash and Silverlight including one for the Keuka Lake Watershed,  a planning tool, and the Susquehanna-Chemung Action Plan.  Those apps utilize other public services and data to cover the whole area. It really depends on the application and the need.

eSpatiallynewyork:  In your capacity with STC, what professions do you work with the most on a day-to-day basis? 

Bubniak:  In addition to my daily responsibilities with TC, I work with several other (government, county, local governments, nonprofits, what?) disciplines including engineering, public works, planning/economic development,  transportation, code enforcement and emergency services.   In many respects and functions I serve as a GIS consultant (though not paid as one) to many organizations and governments across the three county region.

eSpatiallynewyork:  Making maps anymore or is everything online now?

Bubniak:  Mostly everything has gone online, though I still make maps from time to time.  Well designed hard copy maps are always still needed for meetings and discussions.  There is no substitute.

eSpatiallynewyork: From your perspective and experience in the Southern Tier, do you think decision makers and elected officials value GIS technology as a necessity or a “nice to have”?

Bubniak:  For many years it was a “nice to have” and called a cool technology toy.   Though more recently the culture and understanding of geospatial technology has changed within government and among elected officials to considering it much more as a “necessary” tool.

eSpatiallynewyork:  Assuming money and administrative support were in place, what are a couple cost effective (and needed) geospatial applications which you feel STC could develop and available for the three county area?

I would like to have an application or applications similar to how the Town of Southampton, NY is making GIS services available on their website.  They have a fee-based viewer (ePortal).   for Land Manger GIS that was presented at the last New York State GIS Conference.

eSpatiallynewyork:  So what’s next?  What are you working on now?

Bubniak:  Chemung County has just purchased an ELA license from ESRI. I am going to be designing, building multi-user databases and setting up applications for the county. We are going to be implementing a true enterprise system and get away from our current departmentalized GIS systems.

I am currently working on an application to allow  Elmira City Council members to report issues they want resolved. This will be done on tablets and cut out a huge amount of paper work and will bring in a geospatial component at the same time.

Eventually we plan on getting social services involved.   Once we get this off the ground and get things going we are going to look how to improve services in this area of government.  While at Sewall we designed a web application for social services to locate day cares, employers, transit routes and client locations which I believe has potential for regional and county governments.

 eSpatiallynewyork:  So what are you doing when you are not working?

Bubniak:  For many years I competed in power lifting but hurt my shoulder and don’t participate anymore.   I enjoy the outdoors and hunt.    We bought a starter home  many years ago and since then I’ve completely redone the house doing all of the plumbing, electrical, drywall, flooring, etc., myself.    It’s a great location on a dead end road and we own 40 acres.

Both of our boys – ages 9 and 14 – are involved in travel sports (baseball, track/cross country, Tae Kwon Do) so following them around to games and practices is one of our main “hobbies” now – which is all worth it.

2016 National Map (TNM) Products and Services for the Empire State

For almost ten years, The National Map viewer has served as one of the more prominent and visible products of the of the U.S. Geological Survey’s (USGS) National Geospatial Program (NGP).  It represents a significant collaborative effort between the USGS and other Federal, State, and local partners in disseminating  nationwide geospatial data, and where available, content from state and local sources as well.

The National Map is easily accessible for display through a web viewer and boasts a rich catalog of map services which can be consumed by and augments a wide range of browser viewing clients.  It now includes the “new” viewer (the original TNM viewer will be retired this year) which provides users with access to geospatial datasets, geographic names, the Historical Topographic Map Collection (HTMC), and the increasingly popular post-2009 US Topo quadrangle product – all for easy access and download.    US Topo maps are modeled on the familiar 7.5-minute quadrangle maps of the period 1947-1992, but are mass-produced from national GIS databases on a three-year cycle.

Selected TNM viewer functions which can be used by the New York State geospatial community will be highlighted in  the  following  sections  including an update on two of NGP’s  most current and visible  projects –  the 3D Elevation Program (3DEP) and National Hydrography Dataset (NHD).  Both of which are made available in the TNM viewer.  If you’re not familiar with the National Map viewer, an easy way to get started is by using newly released USGS TNM tutorials.

3D Elevation Program (3DEP) Continue reading

The Federal Geospatial Data Act of 2015: A NYS Local Perspective

There has been a limited amount of fanfare and support – or even discussion for that matter – here in the Empire State on the proposed Geospatial Data Act of 2015.    Beyond one or two acknowledgements on  the state listservs, the announcement really didn’t generate any buzz or visible discussion throughout the GIS community.   Though it comes as no real surprise as few in New York statewide GIS community have had any meaningful exposure or introduction to past legislation/bills regarding federal agencies referenced in the proposed 2015 act introduced by Senator Orrin Hatch of Utah.  In absence of any real meaningful dialog here in the New York  between the GIS professional community and elected officials on federal legislation (or any geospatial legislation for that matter except perhaps the never-ending “Surveyor” Legislation), one wonders if New York’s federal delegation is even aware of the proposed act.  Or its stated benefits.

At the core of the proposed 2015 Act is a combination federal legislation and policies including (in no particular order of importance) OMB Circular A-16, the National Spatial Data Infrastructure (NSDI), and the Federal Geographic Data Committee (FGDC).   Very government-like and uber confusing, a little background includes: In 1994, Executive Order 12906 was issued by President Clinton to direct the development of the NSDI.  Unfortunately, twenty-one years later,  many of the requirements of EO 12906 have never been acted on.  Circular A-16 was originally issued in 1953, revised in 1967, revised in 1990 (establishing the FGDC), and revised again in 2002 outlining specific federal agency obligations.  A-16 Supplemental Guidance was also issued in 2010. Similar to EO 12906, federal agencies have struggled to implement many of the provisions of OMB A-16 over the same period of time.

The August 2002 revision to Circular No. A-16 was particularly significant in context of naming the stewardship of over 30 data themes to federal agencies in support of both the NSDI and FGDC programs.  Specific datasets included:

 Biological Resources, Cadastral, Cadastral Offshore, Climate, Cultural and Demographic Statistics, Cultural Resources, Orthophotography, Earth Cover, Elevation Bathymetric, Elevation Terrestrial, Buildings and Facilities, Federal Lands, Flood Hazards, Geodetic Control, Geographic Names, Governmental Units, Geologic, Housing, Hydrology, International Boundaries, Law Enforcements Statistics, Marine Boundaries, Offshore Materials, Outer Continental Shelf Submerged Lands, Public Health, Public Land Conveyance, Shoreline, Soils, Transportation, Vegetation, Watershed boundaries and Wetlands.

While all data themes are clearly important in supporting the broad national NSDI efforts, most New York State local governments  have a limited number of day-to-day business work functions directly related to NSDI spatial data themes itemized in the 2002.  (In fact many of the 2002 NSDI spatial data themes are only developed and maintained by federal resources.)  Adding to the disconnect is that many 2015 local government GIS programs, especially in urban areas, have business needs which are not supported by either the content or spatial accuracy of core 2002 NSDI spatial data themes.  For example, local government geospatial programs in the areas of  infrastructure management (drinking water, sanitary sewer, and storm water systems), utilities, vehicle routing and tracking, permitting and inspection systems, service delivery programs in the health and human services, local planning, zoning, and economic development activities are not closely aligned with many of the 2002 NSDI spatial data themes.    While many federal mapping programs and geospatial datasets continue to be consistent at 1:24,000 (2000 scale), most local urban government GIS programs are built on top of large scale (i.e., 1”=100’ or even 1”=50’) photogrammetric base maps.

Not all is lost, however, as some local data products such as parcel boundaries and planimetrics (building footprints, hydrology, transportation) actually are consistent selected 2002 NSDI spatial data themes (Cadastral, Governmental Units, Hydrology, Geodetic Control, Transportation) albeit at a higher degree of accuracy.  Unfortunately, limited capacity or systems have been established to leverage or normalize such datasets into the NSDI.

Unfortunately, even though the federal government continues to identify and list local governments as key stakeholders in most legislative proposals, it’s common belief among federal agencies that resources are not available to monitor or engage local GIS programs (i.e., 3000 counties vs. 50 states).  And there continues to be the (wild) belief state level GIS programs can serve as the ‘middle man’ or conduit between local and federal geospatial programs.  Somehow magically rolling up local government data for use by federal agencies and integrated into the NSDI.  Not really.  At least here in New York State.   And no, old school NSDI Clearinghouses nor the current rage of soon-to-be-yesterday-news “Open Data” portals being equivalent mechanisms in supporting and maintaining 2002 A-16 data themes.

Perhaps sponsors of the Geospatial Act of 2015 could model collection of local government geospatial data assets after the ongoing efforts associated with the HIFLD (Homeland Infrastructure Foundation Data) program.   Though obviously a very different end product from the NSDI, federal agencies producing the HSIP (Homeland Security Infrastructure Protection) Gold and HSIP Freedom datasets have enjoyed relatively decent success in collecting large volumes of local government data – much of which has been paid for at the local level.  And many of the same federal agencies associated with the HIFLD program including National Geospatial-Intelligence Agency (NGA), Department of Homeland Security (DHS), Department of Defense (DOD), and the U.S. Geological Survey (USGS) have stewardship responsibilities of NSDI spatial data themes.  Different.  But similar.   And adding more bewilderment to the discussion is that it is easier to contribute crowed sourced data (structures) to the USGS than it is for local governments to push large scale photogrammetric data of the same features (structures) to federal agencies and incorporated into the NSDI.

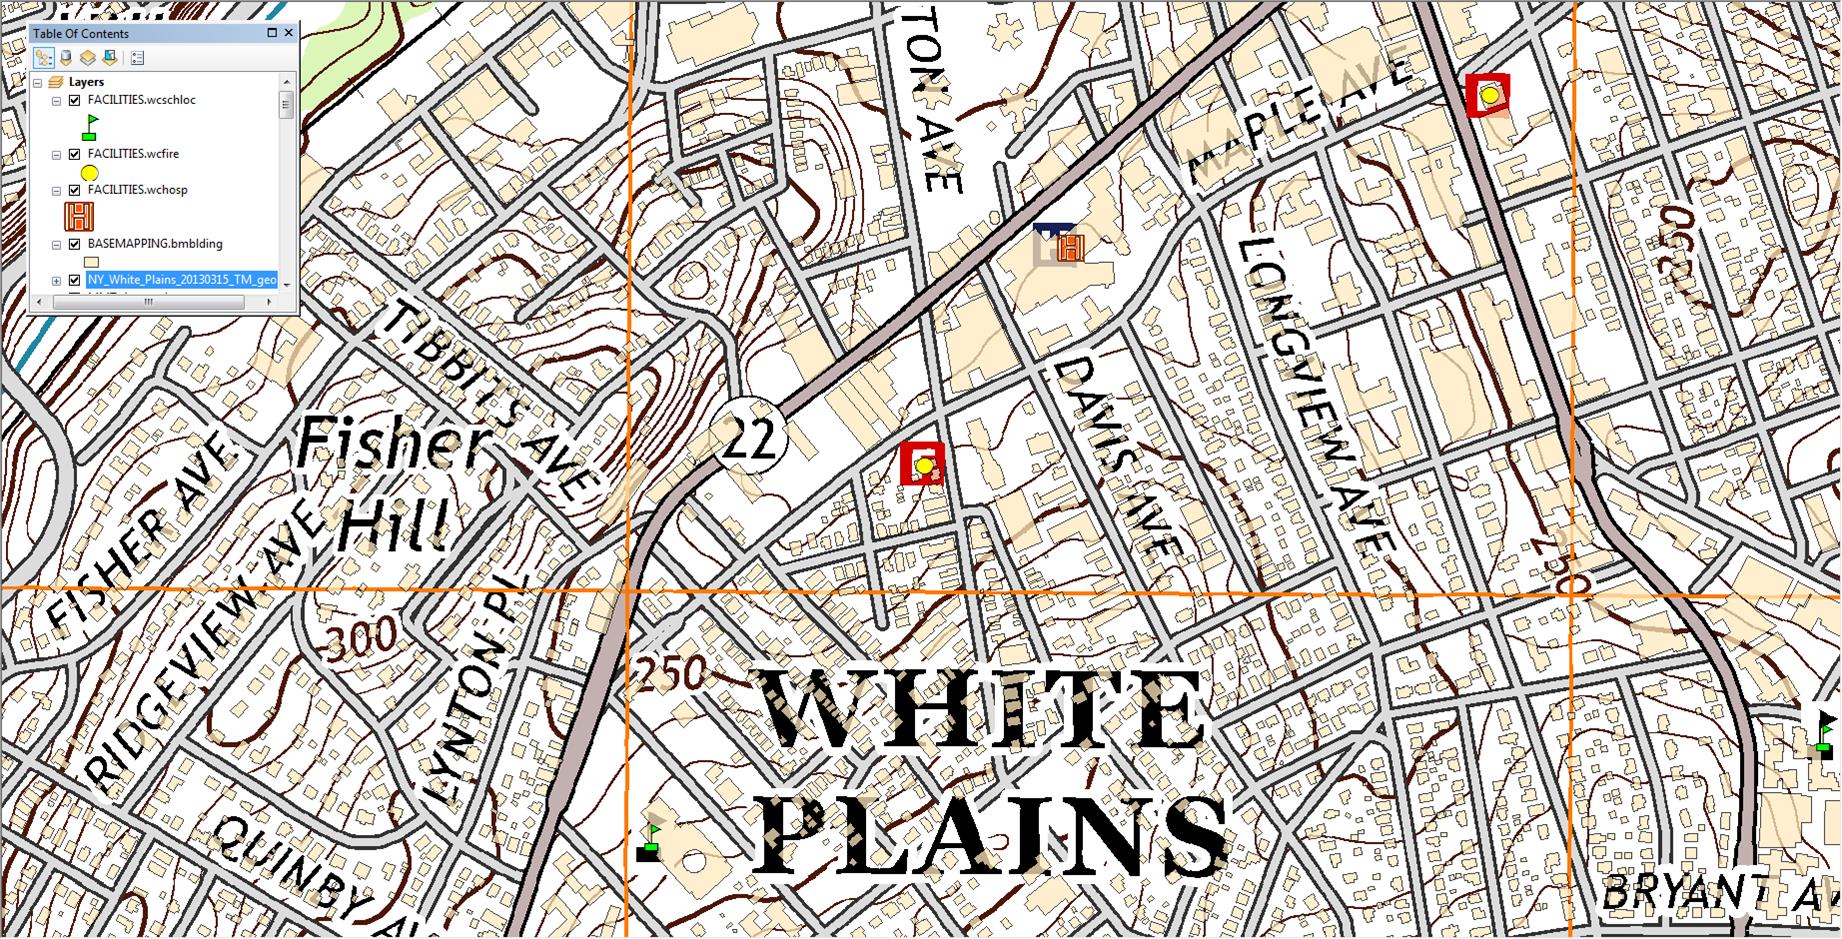
Georeferenced 2013 US Topo White Plains quadrangle.  While selected structures such as schools, fire houses and hospitals are identified on  default US Topo product, this image shows all Westchester County building footprints

Georeferenced 2013 US Topo White Plains quadrangle. While selected structures such as schools, fire houses and hospitals are identified on the default US Topo product, this image shows also shows how local content such as Westchester County building footprints can be made available to the NSDI structures data theme.

Unless a methodical and accepted process – adopted by pertinent local/state/federal stakeholders – is institutionalized  by the FGDC, the Geospatial Data Act of 2015 will continue to be more about federal and state geospatial programs and less about truly integrating and taking advantage of the vast amount of local government data.   The Act needs to specify and fund building work flows which communicate directly with the source of the data as well as working towards reducing the reliance on state “middle men” GIS programs as means to acquire local geospatial data. (Local governments were not even mentioned in a February 2015 General Accounting Office report entitled “GEOSPATIAL DATA: Progress Needed on Identifying Expenditures, Building and Utilizing a Data Infrastructure, and Reducing Duplicative Effort”.  A report which appears to be eerily similar and a rebaked version of the  (ill-fated) 2013 “Map It Once, Use It Many Times”   federal geospatial legislation attempting to reposition the federal effort to coordinate National geospatial data development.

Ironically, just one month prior to the Geospatial Data Act of 2015 being introduced, a scathing report was released by the Consortium of Geospatial Organizations (COGO) entitled “Report Card on the U.S. National Spatial Data Infrastructure”.  In short an overall “C-“ to NSDI effort over the past two decades.  The report falls short in not holding state GIS programs more accountable and responsible as well as most have  jockeyed over the past two decades to be seen as enablers and partners of the NSDI  effort in context of framework layer stewards, recipients of FGDC grants, and establishing/maintaining NSDI Clearinghouse nodes.  States supposedly as “middle men” and conduits to valuable local government geospatial data assets.   Perhaps COGO report cards on individual State government GIS programs are forthcoming.

At the end of the day, NSDI supporters actually do have access to a wide range of local government geospatial assets as files, consumable web services, or perhaps through some other middleware provided by a software vendor.   Or a combination of all the above.  The data and the technology are here.  To the end of furthering the intent of the NSDI, legislation like the Geospatial Act of 2015 will fall on deaf ears and not advance as it should unless the federal government establishes the means to directly engage and connect to local governments.