10 Questions / Preguntas: Daniel Munoz

Daniel Munoz, GIS Manager, Orange County GIS Division, has been an integral part of the Orange County GIS program for over twenty years and involved in geospatial initiatives in municipalities across the county as well.  Somewhat atypical of how other county programs across the Empire State originally evolved, Daniel led implementation of the countywide effort from its beginning from inside the Orange County Water Authority and later on overseeing development into key enterprise programs in the areas of Real Property Tax Services and Emergency Services.  With Spanish being his native language, I also asked Daniel to offer any thoughts/ideas on how to expand and provide geospatial tools to the growing Spanish speaking populations across the Empire State. In further supporting this issue, this eSpatiallyNewYork post is published in both Spanish and English.

Daniel Muñoz, Gerente del SIG, Condado de Orange División de SIG, ha sido una parte integral del programa SIG del Condado de Orange por más de veinte años y también ha participado en iniciativas geoespaciales en los municipios del condado. Un poco diferente de cómo evolucionaron estos programas en otros condados en el Empire State, Daniel dirigió la implementación de los esfuerzos del condado desde el inicio en el Departamento de Agua del Condado de Orange y luego supervisó el desarrollo de programas claves en las áreas de Servicios de Impuestos de Bienes Inmuebles y Servicios de Emergencia. Como el español es su lengua materna, también le pedí a Daniel que ofreciera conceptos / ideas sobre cómo expandir y proporcionar herramientas geoespaciales a las crecientes poblaciones de habla hispana a través del Empire State. Para respaldar aún más esta situación, esta publicación de eSpatiallyNewYork es disponible tanto en español como en inglés.

1.  eSpatiallyNewYork: Let’s start from the beginning.  Where are you originally from and when/how did you end up in Orange County government?

Munoz:  Here is the short story! I’m originally from Mexico City where I earned my Professional Engineer (P.E.) stripes.   I graduated as an industrial engineer from the Autonomous Metropolitan University of Mexico City and initially worked as computer system analyst for an international kitchen appliance company. I was fine with reading English and working with computers programing languages, but struggled with conversational English.  Since I had friends in the city,   I decided to move to Boston, Massachusetts to learn English.  While there I met a woman from Orange County which I married and ultimately moved to Orange County.

eSpatiallyNewYork:  Empecemos por el principio.  De donde eres originalmente y cuando o como terminaste en el gobierno del Condado de Orange?

Munoz: Esta es la historia corta! Soy originario de la Ciudad de México donde obtuve mi titulo de Ingeniero.   Me gradué de Ingeniero Industrial  de la Universidad Autónoma Metropolitana de la Ciudad de México inicialmente trabaje de Analista de Sistemas de Computación para una compañía internacional de electrodomésticos de cocina.  No tenia problemas leyendo ingles y trabajando con lenguajes de programación de computadoras, pero me costaba trabajo el inglés conversacional. Decidí mudarme a Boston, Massachusetts para aprender inglés ya que tenia amigos en esa ciudad. Allí conocí a una mujer del Condado de Orange con la que me casé y finalmente me mudé al Condado de Orange.

2.  eSpatiallyNewYork: What were your earliest Orange County GIS efforts?

Munoz:  I started with the Orange County Water Authority (OCWA) which is a “cousin” of county government.  My title then was digital systems analyst, which in hindsight, was “being in  the right place at the right time”. When I moved here, Orange County had not developed an E-911 system, but OCWA had started gathering  various databases and integrated computer mapping technology to create a county wide Geographic Information System.  Which ultimately led to  OCWA starting  to  serve a significant  supporting role in developing the new computerized E-911 system.  It was during this time I developed my own passion for GIS technology.   Since then I have learned about and worked in the fields of emergency management, planning, tax mapping, public works, and many other areas of county government.  We are providing and integrating data for all services!

eSpatiallyNewYork: ¿Cuáles fueron tus primeros esfuerzos de SIG en el Condado de Orange?

Munoz:  Comencé trabajando para Orange County Water Authority (OCWA) la cual es un agencia del gobierno del Condado de Orange.  Mi título entonces era analista de sistemas digitales, en retrospectiva, fue “estar en el lugar correcto en el momento adecuado”. Cuando me mude aquí, El Condado de Orange no había desarrollado el Sistema E-911, OCWA había comenzado a recopilar varias bases de datos y tecnología integrada de mapeo por computadora para crear un Sistema de Información Geográfica para todo el condado.  Lo que finalmente llevó a que OCWA comenzara a desempeñar un importante papel de apoyo en el desarrollo del nuevo sistema computarizado E-911. Fue durante este tiempo que desarrollé mi propia pasión por la tecnología SIG. Desde entonces, he aprendido y trabajado en los campos de gestión de emergencias, planificación, asignación de impuestos, obras públicas y muchas otras áreas del gobierno del condado. ¡Estamos proporcionando e integrando datos para todos tipo de servicios!

3.  eSpatiallyNewYork: Do you remember the version of ARC/INFO you got started with and what ESRI products are you using today?

Munoz:  Oh boy.  I do and this really dates  me!   My GIS experience didn’t start with ARC/INFO, I started with ArcView 1.0 with option to update to 1.0a.  I still have the box almost intact with the 5¼” installation floppy disks (picture below). We did most of the work with ArcCAD an ESRI plugin for AutoCAD. My first interaction with ARC/INFO was at Version 7. Nowadays we try to keep up to date as much as possible but avoiding the “bleeding edge”. We are in the process of moving our full enterprise GIS to V 10.6.1. I use the full ArcGIS suite including  ArcServer and  ArcMap with the following extensions:  Network Analyst, Spatial Analyst and 3D Analyst.   I have tried ArcGIS Pro but still has some issues.  As far as the web environment, I created all of our websites with the old ESRI flash builder and have started to update them with Web AppBuilder.

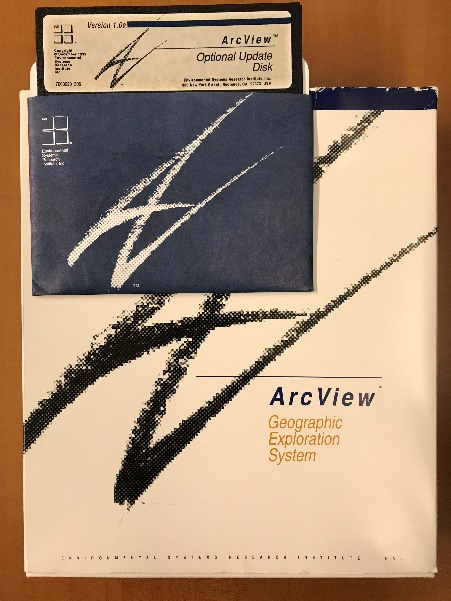
Like many others across the state, Daniel got his start with desktop ArcView software.  Still an ESRI favorite to seasoned GIS professionals.

eSpatiallyNewYork:  ¿Recuerdas la versión de ARC/INFO con la cual comenzaste y que productos de ESRI usasactualmente?

Munoz:  Ay Caramba! Recuerdo bien y revela cuanto tiempo ha pasado! Mi experiencia en SIG no comenzó con ARC/INFO, comencé con ArcView 1.0 con la opción de actualizar a 1.0a. Todavía tengo la caja casi intacta con los discos de instalación de 5¼ ” (imagen abajo). La mayor parte del trabajo fue echo con ArcCAD una extensión de ESRI para AutoCAD. Mi introducción con ARC/INFO fue en la versión 7.0. Hoy en día tratamos de mantenernos actualizados tanto como sea posible, pero evitamos estar a la “vanguardia”. Estamos en el proceso de actualizar nuestro completo SIG a la versión 10.6.1. Uso el paquete completo de ArcGIS, incluyendo ArcServer y ArcMap con las siguientes extensiones: Network Analyst, Spatial Analyst y 3D Analyst. He tratado ArcGIS Pro pero todavía tiene algunos problemas. Entorno de la web, construí  todas nuestras paginas de web con la antigua tecnología de flash pero ya comencé a actualizarlos con la tecnología de Web AppBuilder.

4.  eSpatiallyNewYork: You left GIS  for a while to take another position in County Information Technology –  but then came back to GIS.  Tell us about that.

Munoz:  For me,  GIS & IT always go hand to hand.  While working  for the County,  I always found myself splitting my work projects between GIS & IT.  At the beginning of my career in order to build a better GIS program I had to build a better IT infrastructure.   During this time, I obtained a Windows & Network professional certification. Having this expanded  IT background gave me the opportunity to move to an IT Director position which at the time was a good professional advancement for me.   Two years ago, the County decided to upgrade the County’s  GIS and I was asked  to be part of the team to interview  candidates and  proposals. Going through this process reminded me how much I enjoyed geospatial technology so I made the decision to move back to managing the Orange County GIS program.

eSpatiallyNewYork:  Dejaste el SIG por un tiempo para tomar otra posición en el departamento de Información Tecnología del Condado – pero luego regresaste al SIG. Platícanos a cerca de esto.

Munoz:  Para mí, el SIG & la IT siempre van de la mano. Mientras trabajaba para el Condado, siempre me encontraba dividiendo mi tiempo y proyectos de trabajo entre SIG y IT. Al comienzo de mi carrera, para construir un mejor sistema de SIG tuve que construir una mejor infraestructura de IT. Durante este tiempo, obtuve una certificación profesional de Windows y Redes. Teniendo esta experiencia ampliada en IT me dio la oportunidad de cambiarme a un puesto de director de IT, lo que en ese momento fue un buen avance profesional para mí. Hace dos años, el Condado decidió actualizar el SIG del Condado y me pidieron que formara parte del equipo para entrevistar a los candidatos y sus propuestas. Ser parte de este proceso me recordó lo mucho que disfrutaba la tecnología geoespacial, así que tomé la decisión de regresar a dirigir el SIG del Condado de Orange.

5.  eSpatiallyNewYork: So which areas of County government are the biggest users of geospatial technology?

Munoz:  Definitely Emergency Services!   They have three divisions working  24×7 using and creating data everyday.  Second would be the Planning Department and following very close the Department of Public Works.

eSpatiallyNewYork:  Entonces, ¿Qué áreas del gobierno del Condado tiene los mayores usuarios de tecnología geoespacial?

Munoz:  Definitivamente el departamento de Servicios de Emergencia! Este departamento tiene tres divisiones que  trabajan 24×7 usando y creando datos todos los días. Segundo sería el Departamento de Planificación y siguiéndolo muy de cerca el Departamento de Obras Públicas.

6.  eSpatiallyNewYork:  The County still offers hardcopy maps, shapefiles, and other products for download.  How has this changed, if at all, over the years?

Munoz:  It seems that technology is always driving the associated GIS changes.  The GIS offices are quieter these days as the phones don’t ring as much.  We use to answer the phone constantly to take requests, return calls to inform the caller their  request had been completed.  Today, our online automated GIS request website has taken care of many of these issues.   Individuals can create accounts, make  mapping or data requests, and be notified when the request has been fulfilled with instructions on how to obtain the request.  The website also has an area for data downloads and can notify registered users when County data layers have been updated by our staff.

eSpatiallyNewYork:  El Condado todavía ofrece mapas impresos, shapefiles y otros productos para descargar. ¿Cómo ha cambiado esto, si es que ha cambiado, con los años?

Munoz:  Parece que la tecnología siempre está impulsando los cambios asociados al SIG. Las oficinas de SIG son más silenciosas en estos días ya que los teléfonos no suenan tanto. Solíamos contestar el teléfono constantemente para recibir pedidos, devolver llamadas a nuestros usuarios para informarles que su pedido esta completo. Hoy en día, nuestro sitio de web tiene un sistema de pedidos automatizados y se ocupa de muchos de estos problemas. Las personas pueden crear cuentas, realizar pedidos de mapas o datos y recibir notificaciones automatizadas cuando el pedido se haya cumplido e instrucciones sobre cómo obtenerlo. El sitio web también tiene un área para descarga de datos y puede notificar a los usuarios registrados cuando nosotros actualizamos las bases de datos del Condado.

7.  eSpatiallyNewYork: Any integration with the AutoCAD environment?

Munoz:  Currently, a  small group of engineers from DPW and the tax mapping division are the only ones that still use AutoCAD.  Some years ago the tax mappers started to maintained the parcel boundaries from their tax maps in  an enterprise database with AutoCAD.  As  previously mentioned, our current  GIS upgrade project includes moving the full tax map maintenance program  to our ArcGIS environment.  Stay tuned!

eSpatiallyNewYork:  ¿Alguna integración con el programa de AutoCAD?

Munoz:  Actualmente, solo un pequeño grupo de ingenieros de el Departamento de Obras Públicas y la división de mapas de cadastro son los únicos que todavía utilizan AutoCAD. Hace algunos años, los mapas de cadastro se comenzaron a mantener a través de una base de datos con AutoCAD. Como se mencionó anteriormente, nuestro proyecto actual de actualización del SIG incluye mover el programa de mantenimiento de mapas de cadastro a nuestro sistema de ArcGIS. ¡Mantente al tanto!

8.  eSpatiallyNewYork:  As GIS Manager, what are your biggest challenges today?

Munoz:  I would have to say staffing.  Believe it or not in the last two years I have had to replace the GIS technician positions four times.  While each time each person has been  a competent young professional,  It seems to me the new generation of GIS technicians wants to keep moving on with the next opportunity for advancement.  As opposed to staying in one place for while and building a career in one place.   I find myself training people to see them gone within  6 – 12 months.   A huge challenge!

eSpatiallyNewYork:  Como Gerente de SIG, ¿cuáles son tus mayores desafíos hoy?

Munoz:  Tendría que decir que es el personal. Lo creas o no, en los últimos dos años he tenido que reemplazar las posición de técnico en SIG cuatro veces. Cada vez la persona ha sido un joven profesional competente, pero me parece que la nueva generación de técnicos en SIG siempre anda buscando la próxima oportunidad de avance. A diferencia de permanecer en un lugar por un tiempo y construir una carrera en ese lugar. Me encuentro entrenando personas para que desaparezcan en los próximos 6 – 12 meses. ¡Un gran reto!

9.  eSpatiallyNewYork: What’s the next big geospatial thing in Orange County?

Munoz:  The County is finalizing the Orange County Shared Services Property Tax Savings Plan.  One section in particular reads:

The County of Orange will offer geographic information services (GIS) to any and all of its 43 municipalities. This will include all cartography and geographic data services such as map development, maintenance and printing.

Coordinating and standardizing 43 municipalities will be our biggest project and will keeps us busy for a good while.  I’m hoping for staff continuity!

eSpatiallyNewYork:  ¿Cuál es la próxima gran cosa geoespacial en el Condado de Orange?

Munoz:  El Condado está finalizando el Plan de Servicios Compartidos de Ahorro de Impuestos de la Propiedad del Condado de Orange. Una sección en particular dice:

El Condado de Orange ofrecerá servicios de información geográfica (SIG) a todos y cada uno de sus 43 municipios. Esto incluirá todos los servicios de cartografía y servicio de datos geográficos, como el desarrollo de mapas, el mantenimiento y la impresión.

Coordinar y estandarizar 43 municipios será nuestro mayor proyecto y nos mantendrá ocupados por un buen rato. ¡Espero y el personal sea continuo entonces!

10.  eSpatiallyNewYork:  You are of Hispanic background.  Do you have any thoughts or ideas on how GIS technology could be extended to the regional Spanish speaking population?  Where and how would you start?

Munoz:  The beauty of GIS is that it can help everyone in so many ways.  But the challenge continues to be building applications which are relevant, accessible, and easy to use.  Research show that Hispanics are less likely to have an internet connection at home.  Hispanics are early technology adopters, and Hispanics are mobile-first community. These statements contradict each other a bit but it is because the Hispanic demographic is young. Based on this information I would focus available resources to build, design and post GIS apps in Spanish on mobile platforms (cell phones and tablets) where we know Hispanics are spending their time. These early adopters will spread the message among their social groups faster than any other method.

eSpatiallyNewYork:  Eres de origen hispano. ¿Qué piensas o que ideas tienes sobre cómo la tecnología de Sistemas de Información Geográfica (SIG) podría extenderse a la población regional de habla hispana? ¿Dónde y cómo empezarías?

Munoz:  Lo bonito del SIG es que ayuda a todos, pero debemos asegurarnos de distribuirlo a ellos. Las investigaciones demuestran que los Hispanos tienen la menor probabilidad de tener una conexión de internet en casa, los Hispanos adoptan la tecnología tempranamente y son una comunidad que usan los dispositivos móviles primero. Estas declaraciones se contradicen un poco, pero es debido a que la demografía hispana es joven. Basado en esta información yo pondría todos los recursos disponibles en crear, diseñar y publicar aplicaciones de SIG en plataformas móviles (teléfonos celulares y tabletas) donde sabemos que los Hispanos pasan la mayoría de su tiempo. Estos pioneros difundirán el mensaje atreves de sus redes sociales más rápido que cualquier otro método.

The Geography of an Adirondack High Peaks Unsupported Thru-Hike Record

Background

Since early July this summer when our youngest son Lukas and close friend Mike Jock completed and established  a new record for an unsupported thru-hike of the 46 Adirondack High Peaks, I’ve been asked by various friends and colleagues across the region (who became aware of the accomplishment) as to whether or not any professional geospatial/GIS technology was used in some capacity in supporting the effort.   Each time my humbling answer has been pretty much the same:  Not Really.  However, they did carry some new gadgetry which is currently used ubiquitously across the adventure and extreme sports landscape to collect data that was used to authenticate their achievement.  But more on that later.

Starting their trek at the trail head to Seward Mountain at 3:30 AM Thursday, June 27th on the west side of the Adirondacks, the two covered the 46 High Peaks in 7 days, 2 hours, and 52 minutes finishing by summitting Mount Esther, on the northern shoulder of Whiteface shortly after 3 AM on July 4th. Ultimately making it down to the Mount Ester trail head at 6:20 AM to complete the trip.   All said, nearly 212 miles and 70,000 feet gained in elevation – more than twice the elevation of Mt. Everest.  They averaged well over a marathon a day, covering some 25-30 miles. On the final day they kept moving for more than 23 hours covering 45 miles.

Michael, left, and Lukas at the summit of Armstrong Mountain with Gothics Mountain in the background. The two were soccer teammates at SUNY Cortland. Mike King photo.

Preparation was more old school than one would think.  Nothing in this space replaces on-the-ground knowledge of the trails, trail junctions, where and when to bushwhack, locations of rock cairns for reference points, as well as planning and hiking/testing certain stretches of the route ahead of time.  Yeah, practice runs.  Luke had the benefit of many years of experience having first started ADK trail hiking since he was barely in kindergarten.  Like many other young children, his first “mountain” being Mt. Jo overlooking Heart Lake adjacent Adirondack Loj.  Safe to assume that through the family ties, his spatial orientation has always been pretty decent. Mike, a local boy, grew up in the Plattsburgh area.

This was their third attempt.   And such accomplishments don’t come without the element of good fortune avoiding injuries (which was the case in 2018) and a bunch of days with generally decent weather.  The 2018 attempt was also impacted due to an encounter with a black bear.  Yet another ADK backcountry hiker lesson in overnight food storage.

Given the enormity, location, and challenges of the effort, it would clearly not be safe, if not irresponsible,  to rely solely on the new generation of lightweight/handheld navigational devices as a means to lead one through the Adirondack Mountain wilderness.  There is no substitute for first-hand knowledge of the trail network and a pre-determined plan.  They carried only the essentials such as lighweight sleeping bags, tents, change of clothing, raingear, first aid/basic emergency gear, water filters,  and food.  Counting every ounce in keeping their backpacks to about 40 pounds.  Even omitting the weight of gas canisters/gas stove and in doing so did not prepare anything hot the entire trip.  Zero assistance.

Cool Gadgets

It’s amazing how far the adventure mapping and video/data collection market has evolved since GoPro technology was introduced nearly a decade ago, if not earlier.  The ability to playback Mike and Luke’s accomplishment – made available below via a series of links – is amazingly made possible by just a one simple mobile (wearable) component.  They used a Garmin Fenix 5 GPS Watch to collect X,Y and elevation data which, based on wireless connectivity, automatically uploads to Garmin Connect.  Upon completion of their hike, the entire trip dataset was downloaded to Relive an outdoor 3D video website which allows further rendering and interactive use of the data.    Two Anker PowerCore 26800 pre-charged power banks kept their phones and Garmin device charged.   Of sufficient size to recharge their phones/devices numerous times over.  They took two but in fact only needed one.   The Garmin app also collects heart rate, estimated calories burned, pace (minutes per mile), elevataion gain/loss, and total daily distance – all of which is made available in interactive and graphic form.  In addition to the default Google basemap, data can be rendered on other base maps including satellite, terrain, OpenStreetMap, and Here.  Amazingly compact, yet powerful tools.

The Daily Numbers

The following section includes a brief narrative – Mike’s own words- and links which can be used to highlight trail and body metrics as well as mapping visuals for each hiking day.  For those familiar with hiking and trekking in the Adirondacks, the visuals certainly help put Luke and Mike’s daily segments in better perspective.

Hold on to your seats.

Thursday June 27

Hiker Notes: 3:30 am depart from Corey’s Road.   Day consisted of seven mountains: Seward, Donaldson, Emmons, Seymour, Santanoni, Panther & Couchsachraga. Out and backed the first four.  Trekked approximately 10 miles to Santanoni range.  Set up camp at the base, then we went up the expressway to summit Santanoni first, followed by Panther, and then finished with Couchsachraga. We came down the Panther brook trail before staying at camp at base of expressway again. Approximately 37.84 miles.

Instructions for all similar images below: Click on map for additional graphics and daily metrics. Or click the black triangle button at the bottom of the screen to see hiker movement over the course of the day.

Instructions for all similar Relive 3D Interactive links below: Click on the icon circled in red to see daily hiker movement on top of a 3D base map and associated photos. Clicking on the “View Interactive Route” button enables the ability to interact with the map and trail data “twirling” the image to see from the north, east, south, and west perspective.

Friday June 28

Hiker Notes: From camp, hiked over to Allen mountain, out and backed it before moving up towards Colden/Avalanche Lakes. We out and backed Mount Marshall before setting up camp over the dam at Lake Colden. We summited two mountains and covered approximately 28.47 miles.

June 28thRelive 3D Interactive

Saturday June 29

Hiker Notes: The ADK Loj Loop day. Summitting eight mountains and doing a big circle before returning to the same place we camped the night before. We started by going up the backside of Colden, then Tabletop, Phelps, Street, Nye, Wright, Algonquin and finishing on Iroquis. Approximately 32.18 miles

Note: The only day “noise” was either user generated or introduced by the Garmin device itself. In the vicinity of Street and Nye – Illustrated by the “straight” additional red line. Also reflected in the Relive 3D viewer.

June 29thRelive 3D Interactive

Sunday June 30

Hiker Notes:   Audible day. Started by moving to the base of Cliff and Redfield (out and bacs), then trekking up towards Gray, Skylight, Marcy, Haystack, Basin and finishing with Saddleback. Due to it raining all day, made the game time decision to check out and head towards Johns Brook Lodge where we camped at the trailhead of Big Slide Mountain (setting ourselves up the next day to finish the Great Range and start moving east). Summitted eight mountains and covered approximately 22.5 miles.

June 30th:  Relive 3D Interactive

Monday July 1

Hiker Notes:  Out and backed Big Slide early in the AM, before climbing up towards Great Range. First we summited Lower Wolf Jaw, then Upper Wolf Jaw, Armstrong, Gothics and Sawteeth. We then headed down trail to Lower Ausable Lake. Next we did Colvin and Blake before camping between those two mountains.   In total we summited eight peaks again and covered 23.97 miles.

July 1st:  Relive 3D Interactive

Tuesday July 2

Hiker Notes: Started by ascending Nippletop, moved on over to Dial, then bushwhacked down towards the Dix Range. Once we got down from bushwhack/brook we dropped bags and then out and backed the entire Dix Range: Dix, Hough, South Dix, Grace Peak & Macomb. From there we got our bags again and then moved our stuff over to Roaring Brook and the base of Giant Mountain. In total we covered 25.26 miles and summitted seven peaks.

July 2nd:  Relive 3D Interactive

 Wednesday July 3

Hiker Notes:  The 24 hour day. Woke up at 3 am and went to get Giant and Rocky Ridge Peak (out and backs). From there we picked up our stuff again and schlepped ourselves 5.5 miles down route 73 toward Marcy airfield. Next up was cutting from one side of 73 to the Lake Placid side of 73 along the ridge trail that summitted Porter and Cascade Mountains. Off of those we had then a 10 mile stretch on route 73 and then River Road towards the trai lhead to Whiteface mountain. Using the trail by Connery pond we entered that portion at 1030 PM and was able to summit both Whiteface and then Esther by 3:15 am. About 23 hour and 30 minutes of moving time we summitted our final 6 peaks and covered 44.18 miles. Passed out for an hour and reached Memorial Highway by 06:22 AM, where a time-stamped photo was taken.

July 3nd:  Relive 3D Interactive (Part 1)  Incredible day!!

July 4th:  Relive 3D Interactive (Part 2)

Summary

Quite an effort  and on top of setting the record, between this trip and last year’s attempt, the two helped raise nearly $18,000 for the Dubin Breast Center at Mount Sinai Hospital in New York.  Their accomplishment was covered by Backpacker Magazine as well as a selected number of upstate New York online publications (UpstateNewYork and NNY360) among others.  The articles are generally similar in content though do offer more details about food and other daily nuances/items which I omitted here.  Choosing rather to highlight and focus on the immense geographic element of the effort.

Both Luke and Mike are personal trainers living and working out of New York City.  More information can be found on their website Team Adventure Portal.

The Essential New York Climate Change Science Clearinghouse

There is no lack of geographic information these days on Climate Change and its increasing impacts across the Empire State in the areas of sea level rise, rising heat indexes, more frequent and intense storms, changes to the natural environment and critical habitats, and its influence on a broad range of public health issues to name only a few.  And we see geospatial technologies at the core of sciences being used to analyze, respond, and prepare for future consequences.

Whether it be policymakers, planners, business and industry, residents or community groups, New York State is fortunate to have its own geocentric one-stop website on climate change issues as part of the New York Climate Change Science Clearinghouse (NYCCSC).   Hosted by NESCAUM (Northeast States for Coordinated Air Use Management) , NYCCSC contains documents, data, websites, tools, and maps relevant to climate change adaptation and mitigation across New York State. The goal of the NYCCSC is to support scientifically sound and cost-effective decision-making. It was developed to provide a framework where users can find information in multiple ways, including through interactive tools that use data from different sources.

Established in 2015, the site today contains nearly 2100 resources including over 200 web maps and viewers and an assortment of data products and datasets and is curated by Ingrid H. H. Zabel, Ph.D.  Initially the site was populated by resources that had been referenced in the 2011 ClimAID Report and several other key documents, as well as resources identified by groups of sector experts.  Today, the site curator continues to seek out new content from a variety of sources to keep the site current and fresh.  Submissions to the Clearinghouse are welcome though each are reviewed based on relevance, utility, credibility, and accessibility as described in the site’s Business Rules.   The underlying mission of the site is to provide resources that are relevant to communities of many different sizes around New York State, are focused on practical, applied science and that are open access as much as possible.

Dr. Zabel is assisted by a Content Team and Sector Expert Groups consisting of individuals originally involved in the development of the site, from Cornell’s Northeast Regional Climate Center, the Paleontological Research Institution,  , Northeast States for Coordinated Air Use Management (NESCAUM), Frontier Spatial, and New York State Energy and Research Development Authority (NYSERDA). The sector experts were identified by NYSERDA, NYS Department of Environmental Conservation, and the NYCCSC team, and include individuals from New York state agencies, academia, and nonprofits such as (New England Interstate Water Pollution Control Commission (NEIWPCC),  , and the New York State Floodplain and Stormwater Managers Association (NYSFSMA).

Users can explore and mine through the site via ad hoc interactive mapping, topic specific web maps, data charts, and for published documents and reports.  In addition to offering advanced search tools, site content is also grouped thematically in categories such as Climate and Weather, Sea Level, Energy, Flooding, Plants and Animals, Social and Economic, among others.

Some options on the user interface to dive in and start searching for data include:

Interactive Mapping and Web Maps

One of the focal points of the website is an interactive map of climate change and related data for New York State.   Users can select data layers to display from a menu, filter layers by sector, vary parameters within certain layers, and select from a variety of base layers and regional boundaries. For each layer, links are available to metadata and the original source. Data being made available in the viewer has been curated through more of a group effort, with the NYCCSC team getting requests and feedback from a variety of places, including project managers (NESCAUM) and sponsor (NYSERDA).

The NYCCSC interactive mapper also leverages map services from authoritative sources. For example, this GAP Land Cover Dataset is a service being published by the USGS. Users can click the ‘i’ icon for a given layer which provides metadata on relevant URLs. The interactive mapper also includes a function for the user to add a map layer of their own using the Layer Import button found along the toolbar in the upper right hand corner of the viewer (circled in red). Imported layers do not get added to the map permanently, but rather are a means to temporarily “mash-up” local data with the permanent collection of content in the application

The site is built almost exclusively with open source products and largely supported by Steve Signell at Frontier Spatial.  PostgreSQL is the geodatabase used to store and manage map layers and metadata.  A combination of Geoserver and Leaflet are used to create and manage the web services and support the user interface. Javascript and CSS coding was used to create the custom UI and map functions.

If you’re looking for standalone web and story maps for specific Empire State climate change issues – look no further. As the date of publication of this article, the site listed 203 separate maps from a wide variety of contributors including this one from Westchester County focusing on the potential impacts of sea level rise on critical infrastructure assets.

Among the many great offerings, sites found in the catalog of interest include The Natural Resources Navigator (The Nature Conservancy), New York State Geographic Information Gateway (NYS Department of State), Surging Seas Risk Zone Map:  New York (Climate Central), Environmental Justice Screening and Mapping Tool (U.S. Environmental Protect Agency), and Trees for Tribs Statewide Data Explorer (New York Natural Heritage Program) to name only a few.

Climate Data Grapher

User-generated time series graphs of climate data, both observed and projected (future and historical.)  The data grapher provides access to climate data which can be summarized by the user according to various geographic units such as counties. The same summaries are used in the maps & GIS viewer to attribute the corresponding map layers for county and watershed boundaries.  Both user interfaces (Interactive Mapping and Data Grapher) draw on the same raw data sources but offer different capabilities for query, summary and visualization.

I used the interactive graphing tool to plot Westchester’s Winter Average Temperature. It’s one of
19 types of climate related data which can be charted by either geographic area: state, county, or river basin. (Upper left hand corner pull-down). Other datasets area available by gauging and/or weather stations. The chart renders different results depending on which RCP radio button (4.5 or 8.5) is selected. RCP (Representative Concentration Pathway) 4.5 and 8.5 are scenarios of future climate change based on varying degrees of societal progress in reducing human contributions to greenhouse warming.

Documents

A wide range of documents and reports on statewide climate change issues including the author(s) or publishing agency, a pdf download option and where available a corresponding website URL. The first document itemized –  a document central to the launch of the site – is  Responding to Climate Change In New York State: The ClimAID Integrated Assessment for Effective Climate Change Adaptation in New York State: Final Report (2011) which provided information on climate change impacts and adaptation for eight sectors in New York State: water resources, coastal zones, ecosystems, agriculture, energy, transportation, telecommunications, and public health.

The 2011 ClimAID report is one of the first comprehensive and definitive compilations on the many challenges on impacts of climate change across New York State.

Summary

NYCCSC is a huge repository of geospatial and other content focusing on the ongoing and constantly evolving Empire State climate change issue being made available by a wide range of publishers including governments, academia, nonprofits, and industry.     And whereas much New York State climate change focus in recent years has concentrated on the impacts to our coastal communities (i.e., due to sea level rise, hurricanes/severe weather events, storm surges –  much of which is included in the repository), NYCCSC offers content and case studies covering the entire New York State footprint.   Sometimes, however, the scale of the data associated with individual sites can be an issue when looking at issues at the local level.   But nonetheless the data is there.  Itemized websites are always a good starting point for metadata, individual dataset downloads or access to public facing REST endpoints.  .

It takes a considerable amount of effort and oversight to keep such online clearinghouses up-to-date and to this end NYCCSC is fortunate to have an ongoing relationship with NYSERDA for continued support of the project.  NYCCSC continues to welcome submissions but does not accept every resource that is submitted. At the bottom of the site landing page there is a button labeled “Propose Content” which provides access to a form in which content can be proposed.

Contact:

Ingrid H. H. Zabel, Ph.D.
Climate Change Education Manager and Curator, New York Climate Change Science Clearinghouse
Paleontological Research Institution, Affiliated with Cornell University
(607) 273-6623, ext. 122
info@nyclimatescience.org
nyclimatescience.org

Belated News Flash: Empire State GIS Web Maps Got Juice!!

Maybe a bit of yesterday’s news, but apparently many of us in the statewide GIS/geospatial circles were asleep at the wheel this past December when Governor Cuomo signed Senate Bill 9061 amending section 4511 of the Civil Laws and Practices Rules (CLPR).  In laymen terms, the bill “gives Google Maps and other global imaging websites the presumption of accuracy when they are used as evidence in New York courts.   Information taken from similar sites (web mapping services, etc) to Google Maps would be presumed accurate unless “credible and reliable evidence” is presented showing that it is not.”   The bill was introduced by Senator Michael Gianaris (D-Queens) earlier in 2018 and approved on June 15, 2018.  I reached out to Senator Gianaris’s office to inquire regarding his interest and/or constituent support in this space, but my emails were not answered.  If you are so inclined, the full grownup version of the bill can be found here.

This downtown Peekskill, New York Google Maps image is a staple in context of submitting “imagery” as evidence in New York State courts. Though readily available and easy to access by litigants, other government-based web mapping programs across the state often contain more detailed information and are available for increased use in court cases.

The reasons for the lack of notice, or interest for that matter, are probably for a myriad of reasons.  Could be there was simply a lack of attention because the statewide geospatial community was still dizzy from excitement by passage of the National Geospatial Data Act of 2018 last fall and its anticipated benefits to government and business GIS programs across the Empire State.  (Btw – if you are keeping a GDA scorecard, here is a May 2019 presentation on how the Act is moving forward on behalf of your GIS program.)

Though having received little attention and discussion across the GIS/geospatial communication channels and/or social media, the approved S9061 2018 legislation actually received a fair amount of dialogue in New York State law journals and blogs (i.e., Bleakley & Platt, Neufeld, O’Leary & Giusto, and Sahn Ward Coschignano among others).  With no real formal monitoring process or legislative agenda to effectively influence legislation on behalf of the statewide “profession”, legislation such as S9061 may continue to go unnoticed.  By comparison in contrast to the legislative agendas and committees of aligned Empire State geospatial professions such as surveying and engineering.

While Google internet mapping content will continue to be a norm, this legislation provides the opportunity for expanded credibility on the value of government and public facing internet web mapping sites to the legal community and in support of the  judicial process.   And by extension, one of the primary reasons in passage of S9061 – cost savings – as the new law should save litigants significant time and money and speed up trails.  In some instances, litigants have had to pay for companies to fly over a desired area and photograph it at a high cost, so that a witness would be available to authenticate the picture. Passage of S9061 also represents yet another way in which New York State legal rules are changing for the better to accommodate new technology. Notes Adam Rodriguez, Esq., attorney at Bleakley & Platt in White Plains, “This is a very practical amendment to the C.P.L.R. that will promote efficiency by saving time”

Using approximately the same Peekskill footprint as the image above, this Westchester County web mapping application renders completely different data including planimetrics, utility poles, and a sanitary sewer network. Increased outreach from government GIS programs to the legal community can illustrate the detail and richness of data which can be obtained from online web mapping programs.

Of course while the legislation gives the legal community more freedom in the use of online mapping content, it still recognizes that it may not be entirely correct and gives relief to opposing parties to challenge admis­sion of the web map content through “credible and reliable evidence that the image, map, location, distance, calcula­tion, or other information” does not “fairly and accurately portray that which it is being offered to prove.”  As such, expanded use and access to online web mapping content will increasingly require attorneys to better understand both the accuracy and limitations of the geospatial products (particularly hardcopy products generated from online applications) being submitted as evidence.

Post-World War II (1947) imagery of the same Peekskill footprint. While the Westchester County 1947 photography is of outstanding quality, conversion of such panchromatic photography to digital format can often introduce various types of errors and distortions. As such, not all “online content” is always correct and the legal community will need to continue to be cautious – and educated – about using “as is” online web mapping products.

The bill will make New York State practice consistent with Federal practice, which allows courts to take judicial notice of Google Map images because they “can be accurately and readily determined from sources whose accuracy cannot reasonably be questioned” under Federal Rule of Evidence 201.

Another plus for our tax payer funded geospatial products.  Albeit not on a day-to-day basis, but nonetheless, providing cost efficiencies in the judicial system and a little more something for the GIS program return-on-investment (ROI).

Talk to your government attorneys or firms which represent your GIS program about Senate Bill S9061.

BuildingFootprintUSA: Setting the Foundation in Albany

Somewhat fitting a new geospatial start-up would emerge in the Albany area.   The region being home to MapInfo, an early player in the desktop GIS software market appearing at number 23 in Inc. Magazine’s annual list of the 500 fastest-growing private companies in the U.S. in 1992.   While the software product is still around, the company has since been acquired by Pitney Bowes.  Across the Empire State geospatial landscape it’s not uncommon to bump into someone working in the GIS space with ties to MapInfo.

Case in point, in 2016 four ex-MapInfo colleagues, each with over 25-years of experience in the geospatial space focusing largely on data development, went out on their own and launched BuildingFootprintUSA with the intent of providing to the geospatial industry spatially accurate and attribute rich building footprints covering the United States.  Their initial focus has to been to provide data to the location based advertising, insurance, and telecommunications industries.  In January of this year, Geoawesomeness included BuildingfootprintsUSA (BFUSA) in the 2019 Top 100 Geospatial Companies and Startups List.

BuildingFootprintUSA’s 3D model of Albany including the Empire State Plaza. Buildings are commonly attributed with addresses and assessment data.

Given that the company is only three years old and has only a handful of full-time employees, BFUSA might be considered a typical tech start-up.  However, co-owner Scott Robinson notes that the company is in the midst of significant growth with a growing list of clients nationwide.  The company is an ESRI Emerging Business Partner and is part of the START-UP NY Program in a partnership with SUNY Albany.

The fast-growing company’s catalog already includes over 90 million footprints covering 75% of the US population, several large clients and to date has not required any external funding.  Using an addressed building footprint as the foundation of their product line, BFUSA routinely connects a wide range of attribute data to the footprint including, but not limited to, census designations and demographics, assessment files, property and facility information, and business characteristics such as category and size of company.  For residential structures, detailed demographics (i.e. age, race, income, education, etc) and household profiles on consumer behavior and lifestyles are also available.  Structure height (z-value) is also included in the footprint dataset which is derived from available LIDAR databases as well generated from their own photogrammetry or other BFUSA business partners.

We are committed to data integrity”, notes co-owner Scott Robinson, “our work is essentially a  huge data curation effort – blending and harmonizing data from many different sources including open data portals, government websites, and commercial data services”.   Specific and very detailed attention is given to the spatial/positional accuracy of the footprint as well as the numerous data fields associated with the footprint.  Robinson points out that not all building footprints are created alike noting that many “single” footprints can be comprised of several offices or living spaces such commercial buildings and/or condominiums and apartment buildings.  Similarly the same footprint can have different heights (z-value) which factors into line-of-sight analyses and wireless signal studies.  He continues “It’s not uncommon to find at least 25% of the building footprints we receive from others to be off at least 100 feet”.

Specific examples of how BuildingFootprintUSA products and services are used include:

Insurance

In assessing structural risks in designated flood plains, using building footprints versus parcel centroids provides a more informed evaluation. In this example, dots represent parcel centroids. In some instances where parcel centroids are located in the flood plain, associated parcel structures may/may not be (orange and yellow) vulnerable to flooding. Both a red dot and red footprint indicate a more vulnerable property while both a green dot and green footprint imply major property assets are not subject to flooding.

Telecom

A Telco company uses BuildingFootprintUSA data to understand optimal placement of 5G network towers in NYC; based identifying what buildings the signal can reach and what are the characteristics of the building itself. In this picture residential buildings are shaded by affluence of the residents.

Location Based Advertising (AdTech)

Detailed business data attributed to building footprints can then be integrated with consumer movement data generated by mobile devices. Buffers around specific buildings can support a variety of pattern analyses which provides a very educated guess on where a mobile device has been over a period of time. Using both store visit insights and foot-traffic data, building footprint data empowers retail analytics firms and real estate asset managers to conduct live trade area analysis and give retailers insights on the characteristics of these people, and know the reasons that are drawing people to those locations.

BuildingFootprintUSA data products are currently available via ESRI Shapefiles and geodatabase (GDB) and MapInfo TAB in Coordinate System WGS84.  Later in 2019 the company plans to offer data via an API. Datasets are typically sold as nationwide coverages though smaller geographic footprint are available as well.  Data is offered by annual license with quarterly updates.

Summary

Refreshing to see a geospatial start-up emerge in Albany only minutes from the Empire State Plaza.  With the UAV technology well recognized and established from Syracuse into the Mohawk Valley Region, we can be optimistic that BuildingFootprintUSA’s success – and perhaps by extension its association with START-UP NY – will be recognized and brought to the attention of the state’s elected officials.  Highlighting both the company’s contribution to the local and state economy and illustrate how geospatial marketplace commodities are routinely produced and made available by industry.

Perhaps a start to similar industry growth in the greater Albany and Hudson River Valley region.

Contact:

Scott Robinson, VP Strategy
scott@buildingfootprintusa.com
BuildingFootprintUSA
200 Great Oaks Blvd, Suite 214
Albany, NY 12203
518-218-4444

10 Questions: Christine Gayron, Gayron de Bruin Land Surveying and Engineering, PC

Christine Gayron currently serves as President of Gayron de Bruin Land Surveying and Engineering, PC (GdB) based in Melville, New York.   The company provides a wide range of geospatial products and services for clients in the Empire State.  As part of eSpatiallyNewYork’s continued effort to reach out to the statewide geospatial professions, we were able to meet and have a conversation at the 2019 New York State Association of Licensed Surveyors (NYSAPLS) annual conference.

eSpatiallyNewYork:  GdB was created in 2010.  The company has made a lot of progress in a relatively short period of time and adding a lot of new technologies along the way – GIS, drones, laser scanning, etc. – how is the company making it all happen?

Gayron:  I only hire people who are awesome. They are the ones who make it happen. I just bring in the work and create a company culture that makes the employees want to be the best at what we do. I have to credit my partner, Greg de Bruin, for constantly pushing the envelope, and insisting on investing in technology, and Jason Graf, my partner in charge of operations, for putting the technology in everyday use. Greg introduced GIS in the 90’s before I started my career. I actually think my contribution was my ability to run the business and bring work in, creating a revenue stream that would allow us to afford to make the investments. So I grew the company and oversaw things and generated profit, while the technology nerds in the company figured out how to customize software and put new technology into use.

eSpatiallyNewYork: Tell me a little bit about your education.   B.S. in Geology – how did you make the jump to surveying?

Gayron: I have a BA in Geology from CUNY Queens College and a minor in secondary education. I thought I was going to be an Earth Science teacher, but a month into student teaching, I realized teaching was not for me. I wasn’t sure what to do. My stepfather saw an ad in the paper for GIS Specialists at an engineering firm called A. James de Bruin & Sons, the predecessor firm to Gayron de Bruin.  It was in Bethpage, NY, the next town over from where I live. I had taken one class in GIS in college. The mapping aspect of geology interested me more than the rocks and minerals part, so I applied for an entry level position. I was hired to draft utilities and base maps for utility company conduit design drawings. Then I worked with one of the engineers on the conduit design. I designed hangers to support conduits underneath a couple of bridges over the Long Island Expressway (LIE).   I also designed horizontal directional drilling of conduit underneath the LIE. When the conduit design work dried up, I started doing more boundary surveying and control surveys for NYSDOT.  I used GIS to plan control networks.  At 23 years old, I was managing design survey projects. There was lots of opportunity at the small family owned firm and I was good at seeing what needed to get done. As I approached licensure in 2010, my boss, Greg de Bruin, and I decided to partner and form Gayron de Bruin.  It was time for Greg to start planning for retirement and I was the successor.

eSpatiallyNewYork:  Early on, traditional surveying and engineering companies were a bit slow embracing GIS technology/software but today this intersection is complete.  GdB is part of the ESRI Partner Network and has ArcGIS Online Specialty Did GdB have ESRI capacity from the beginning?

Gayron:  We’ve always been an ESRI shop. We saw how ESRI had discounted licenses for schools and government and we knew that was key. As we are geospatial data collectors and data managers we push GIS as a data management tool to our clients.  We try to provide this to all of our clients. GIS is just one of the tools in the toolbox. It used to be a hard sell to get clients to use GIS, but ArcGIS Online (AGOL) has made that a lot easier because we can set up the GIS tools, bring the data in, and show them how to view, analyze, and manipulate it.

eSpatiallyNewYork:  Are the new/younger generation of surveyors – and engineers – who are just getting into the work force have a broad enough understanding/experience with GIS software?

Gayron:  We hire a lot of people right out of college with GIS education. We find that they have a basic understanding of what it can do, but how we use it in surveying and engineering is usually new to them. Most of it is learned along the way. I think this is true of most industries – college gives a basic foundation and only scratches the surface. Getting into the workforce is where the detailed applications and user expertise is developed.

eSpatiallyNewYork:  Speaking of data, what has GdB’s experience been in obtaining government data?  I see that elevation certificates and tax parcel data are key business components in your space.    What’s been your experience in getting this digital data across New York State?

Gayron: Orthoimagery has been very attainable and useful. Parcel data is useful for elevation certificates as you suggested. Tax map line work is valuable for getting an idea of what the parcel layout may look like, but it can be deceiving. We try not to use it on our drawings because we are licensed land surveyors and if we put a line on the drawing, it’s got to be in the right place. We love to see government offices scanning their maps and storing them in a GIS and making them available, but this is still rare.

eSpatiallyNewYork:  Drone technology is becoming a geospatial game changer.  What’s the GdB read on this evolving technology?

Gayron: So drones are all the rave, but they are really just another cool option in the geospatial tool box – a glorified robot camera holder.   It’s really the software that connects drone flights to GPS and uses drone photography to create point clouds and 3D surface models that I find impressive. Like other tools such as LiDAR, it is the accurate and precise control that yields accurate 3D models. The software is key in reconciling the data with the ground control.

eSpatiallyNewYork:  This is impressive  – “GdB is ranked in POB Magazine as one of the top 100 Geospatial firms in the United States.”

POB magazine gathered data in 2015 and 2016 on revenue in the geospatial community. I’m attaching the articles so you can see how they used the data to rank firms. They stopped doing it after 2016, but I’m certain we would rank even higher on the list now!

eSpatiallyNewYork:  How does Honeoye Falls, New York fit into the GdB business plan? It’s a long way from your Long Island headquarters!

Honeoye Falls is just outside of Rochester. So we wanted to expand the company and it seemed we had the choice to expand geographically providing the same services or we could expand our range of services to include more civil engineering. We decided to stick with what we are good at and do it farther away. My partner, Jason Graf, LS, found New York State Department of Transportation (NYSDOT) data available online. It listed NYSDOT projects by location and contract budget. He manipulated the data in GIS and created a heat map to see where NYSDOT was spending the most money. The New York City area glowed the brightest, of course. The next “glowiest” cities were Buffalo, Rochester, and Syracuse. With Rochester in the middle of those three cities, it seemed like a place to look into. We had some contacts there and did our research. Within one year of starting to think about a Rochester office, we had the branch office open with 5 employees. 18 months later, we have 11 employees and they are all busy! Scott Smith, LS, the Branch Manager, is building an all-star team upstate. I truly believe that the bringing on the right people drives our success. As we grow, we are putting effort into making our operation more structured and efficient, but as stated above, we only hire people who are awesome, and I want them to feel appreciated for their ideas and contributions.

eSpatiallyNewYork:  What are some of GdB’s current larger or unique projects using geospatial technologies? 

Power companies are putting out very large corridor projects requiring surveying and mapping of several miles along a proposed power line route. I think these projects are coming about as new forms of energy generation are being developed. They need transmission lines to connect the new power plants, solar panel fields, and wind farms to traditional power grids. We also do large mapping projects for design of infrastructure in New York City. The city’s infrastructure is crumbling and needs upgrading. One of the first steps is mapping the existing conditions. These jobs are always a huge rush.

eSpatiallyNewYork: Considering all of GdB’s business – what is the breakdown between private and business clients? 

Most of our work is for government agencies. The breakdown is aboutt 80% government agency work, and 20% private clients.

eSpatiallyNewYork: Tell us about the online teaching you do through GeoLearn?

I met Joe Paiva, the founder of GeoLearn, before I got licensed because I took his review course when I prepped for the Licensed Land Surveyor test, and then I would see him at conferences a couple times per year. Joe is an excellent presenter. Joe knew that I was doing some presentations to professional organizations and he knew that my company was using GIS and other new technologies in Land Surveying – so he asked me to present courses on GIS for GeoLearn.  I prepared power point slides just like I would for a live presentation. I flew to GeoLearn’s studio in Kansas City to record them. It’s actually much easier to present this way, because you only have to present 10-15 minutes at a time to create the segments. Being in the studio was a very cool experience!

eSpatiallyNewYork:  Work aside, I understand you’re a triathlete and compete in many similar events.  What’s next on your calendar? 

Last year, I qualified for XTerra World Championship race in Maui. This is an off-road triathlon consisting of an ocean swim, mountain bike, and trail run. Unfortunately, I was injured a couple weeks before the race and didn’t go. This year, I am not signed up for any races, which is an interesting experiment, because I’m still training, but without the pressure of an upcoming race. So I know I’m doing it because I really love it. I usually wake up at 4:30am and train early in the morning. I’m done by 8am in time to get my kids off to school and get to work. I am married to a NY City Firefighter and we have three amazing children, who are very active. Right now, I’m ok with putting my racing career on hold to attend their lacrosse games, concerts, and cheer competitions.

Contact:

Christine Gayron, President
Gayron de Bruin Land Surveying and Engineering, PC
cgayron@gayrondebruin.com

2019 Westchester GIS User Group Meeting

Making it the largest annual event to date, nearly 200 individuals attended the 2019 Westchester GIS User Group Meeting May 16th at Purchase College. The annual event included a diverse mixture of user presentations and demonstrations for attendees representing local and county government, utilities, nonprofits,  business and industry, and academia (both college and high school programs). Faculty and facility support from the College’s Environmental Studies program and sponsorship from twelve vendors again helped enable the Westchester County GIS community to meet and discuss the countywide geospatial agenda.  And by virtue of the venue, promoting SUNY GIS educational opportunities as well.   It was a great GIS day for all attending and participating.

As the day progressed, nearly 200 registrants assembled as part of the 2019 Westchester GIS User Group Meeting at Purchase College. The main lecture auditorium was filled to capacity with standing room only by mid-morning.

2019 Agenda and Speakers

While the 2018 agenda had a specific theme, this year’s agenda was intended to be more diverse covering a wide range of topics including health and human services, pavement management systems, oblique imagery applications, training workshops, forestry inventories, public safety, mapping and visualizing the human brain, the 2020 Census, and a special presentation by ESRI focusing on accessing the County’s new planimetric datasets via web services.

Session I:  Allison McSpedon and Jeff Worden from the Westchester County Continuum of Care Partnership for the Homeless led the day off with a presentation focusing on the use of mobile technology as part of the annual Homeless Point in Time (PIT) Count taken in January 2019.  This was followed by Nancy Birnbaum, Manager of Software Architecture, Westchester County Dept. of Information Technology who presented the new Westchester County Online Community Mental Health Directory.

Managers from the Continuum of Care Partnership for the Homeless detailed the pros and cons on the use of mobile data collection technology as part of the January 2019 count. They anticipate even better results and ease of use when deployed in the next count.

Andrew Reinmann, Advanced Science Research Center, Graduate Center of CUNY and Department of Geography, Hunter College followed with the use of geospatial tools as part of the Westchester County Forestry Inventory: Mapping and Ecosystem Services Assessment.  The morning session ended with a series of lightning talks highlighting the use of the County’s new oblique imagery.

Session II: After intermission, VHB and staff from Westchester County Dept. of Public Works and Transportation discussed the new Smart Asset Management and Inventory System (SAMIS) application which was followed by an excellent demonstration on the use of Laser Scanning technology by the Westchester County Police Forensic Investigations Unit.  Patrick Gahagan, Technical Analyst at ESRI finished the morning session discussing advancements in civil engineering and surveying integration between the Autodesk and ESRI platforms.

Detectives from the County Police Forensic Unit captivated the audience on the use of laser scanning in crime scene investigations. GIS staff is now working with the Forensic Unit on integrating laser scanning data into the enterprise GIS environment.

Session III:  After lunch – and an audience participation session of GeoJeopardy – Jonathan A. N. Fisher, Ph.D., Director of the nearby Neurosensory Engineering Lab at the  New York Medical College in Valhalla provided an overview of his project called Neurodome which centers on the mapping of the human brain with an assortment of technology and visualization tools.   Daniel Wickens, Solution Engineer from ESRI then gave two overviews on “What’s New with ArcGIS Field Apps and ArcGIS Online.”  Concurrently in separate locations training classes were offered on how to use the new online CONNECTExplorer oblique imagery viewer and the ESRI “Explore Future Climate Change” tutorial.

Session IV:  The last section of the agenda was brief and included an update on mapping efforts association with the 2020 Census by Margaret Baker, Geographer, from the U.S. Census Bureau Manhattan office.  The final presentation by Westchester County GIS staff included the latest developments and anticipated upgrades to the Westchester County GIS website including the scheduled launch of the Westchester GIS Geospatial Gateway

Individual meeting presentations can be accessed and downloaded using this link.

The U.S. Census Bureau is ramping up for the 2020 Census and has a variety of mapping and geospatial products in their toolbox. GIS technology is essential in helping identify areas which have had low counts and responses.

Little Things Make it Work

I’ve written before about the small details which we believe enable the Annual Westchester GIS User Group Meeting to continue to be successful – and we’re the first to admit there is always the element of luck.  Even the weather matters.  To the extent possible, elements such as keeping the content and speakers “Westchester” focused, minimal –  if any –  registration fees, lots of time for interaction with the sponsors on the exhibit floor, and the centrally located venue at Purchase College – all matter. One of the ironies, and downsides, of having the show on a college campus in mid-to-late May is that spring semester is already over and students have fled campus.  However,  there is normally a handful attending looking for summer or full-time work and passing out resumes.    The naturally lighted vendor area in the Natural Sciences Building, albeit small, adds to the personal “feel” of the show.    Easy access and plenty of parking is also essential.  And don’t forget lots of proactive outreach to the professional organizations and societies  we work with on a day-to-day basis:  police/fire, engineering, surveying, public works, assessors, nonprofits, and the planning community.   The added message here is to encourage consultants which are supporting local governments across the county – to attend the meeting.  To learn more about accessing and leveraging Westchester County GIS products and services and how this improves service and cost efficiencies to municipalities they serve.   Individually, any of these items listed above may seem trivial,  but they all add up in delivering a show that will bring the same people back next year.

The exhibit floor was busy (and loud!) during breaks with all vendors noting interaction with attendees was good and productive. All attendees can complete a Vendor Bingo Card and be eligible for a raffle prize at the end of the day. This year’s prize was a vendor donated iPad!

Summary

Over the next couple weeks, conference organizers will be sending out a survey to both attendees and vendors to gather more detailed information on the various elements (presentations, speakers, refreshments/breaks, vendor interaction/feedback, facility issues and the like) of the show.  This information will help guide decisions about content and any changes that may need to be made, if any, about the structure of the show.

Staff will take a few months off and begin planning for the 2020 show in the fall of this year.  In doing so, we look forward to the continued relevance and position of the Westchester GIS User Group Meeting in promoting countywide geospatial development and use.

Geogames: The Intersection of Geospatial and Games

Behind the scenes in the various worlds of films, games, science, military, government, and even the maker culture, is how “geo” has been gradually verging/bringing all of these industries together. The proliferation of smart phones with maps and searches for food and entertainment, geotagging, as well as ride sharing has brought “geo-data” to everyone and seemingly everything.  Though geospatial data, geospatial analysis, and basic mapping and cartographic concepts have been well established for many years, it’s only been within recent years that technology has enabled science to push and combine animation and gaming with real world geometry.

Here in the Empire State, faculty at Rochester Institute of Technology (RIT),  recently ranked #4 in the United States in Video Game Design Schools, Brian Tomaszewski and David Schwartz, are currently working on this technology “convergence” supported through a grant from the National Science Foundation (NSF).  This effort combines Dr. Tomaszewki’s recognized work focusing on GIS (geographical information systems) applications in the areas of disaster management and risk assessment.  He currently serves as Associate Professor and runs the Center for Geographic Information Science and Technology. Augmenting this work is Dr. Schwartz’s background and ongoing work in game programming, prototyping, and design, which he uses to build academic collaborations across RIT program areas including liberal and visual arts, engineering, business, and now the geospatial sciences. He serves as Director and Associate Professor in the  School of Interactive Games and Media (IGM).

“The world of games has long sought academic legitimacy, which for the most part has been achieved, by demonstrating ‘seriousness,’” notes Schwartz.  Some of the best games are great at teaching players to play those games, many of which have been designed at RIT: Lost and Found (religion), IPAR (computing security), and others.

Lost & Found is a game series that teaches medieval religious legal systems with attention to period accuracy and cultural and historical context. Both games are set in Fustat (Old Cairo) in the 12th Century.

If designers can capture that same immersive engagement for learning, training, education, then game development can make traditional learning, or “non-fun” entertaining and more participatory. There have been several great examples, and there are all kinds of offshoots with government, military, humanitarian, scientific applications, e.g., Instructional Design, Games for Health, and Cybersecurity.

Some of the underlying concepts and building blocks of mashing gaming and GIS software, what is called geogames and location-based games, together include, but not limited to, are:

  • Focusing on creating applications around a recent and “real life” historical event that has relevance to end users
  • Using industry accepted development tools to create the geogame
  • Demonstrate that a location-based game based on real-world data can promote and teach spatial thinking skills
  • Provide a “game” to emergency responders and local users that provides a framework for future refinements and enhancements to the game
  • Demonstrate that a serious geogames have academic and research merit

With respect to the intersection of gaming and geospatial, Pokemon Go has recently demonstrated people interacting with a virtual world “on top” of the real world, incorporating location-based data into visual interactive, decision-making environment. “The Games for Change” organization based in New York City has generated considerable attention to showing how game creators and social innovators drive real-world change using games that help people to learn, and improve their communities.

Convergence of Films and Games through GIS

One reason for the excitement on the evolution of geogames is this convergence of various disciplines, technologies, and software environments. Geogames being developed at RIT include free and open source software (FOSS), such as Open Street Map for ubiquitous baseline street data, as well as  Unity—a leading and popular game engine for rapidly making games. Unity (which is free for certain applications) has been incredibly important for the “indie” game scene, as well many other industries in professional games, movies, advertising, marketing, and more.

Other key aspects of the convergence include ESRI’s CityEngine, which historically has been used for urban design and 3D modeling.  It has had success in various films in making the worlds for Toy Story 2 and Coco. Even RIT’s hometown of Rochester, New York, was an early adopter of City Engine. Other pieces include real-world geospatial datasets, such as elevation models and flooding reach information.

Taking real-world mapping data into City Engine and then porting everything into a game engine enables game developers to visualize a real-world city or landscape. The game then renders graphics and animation,  handles interactions (player controls and responses), and embeds (through a lot more programming and design) the game rules (what happens, or outcomes, when the player interacts in specific ways.

Project Lily Pad:  Bringing the Pieces Together

Tomaszewski and Schwartz’s NSF grant and support of RIT’s computing college includes research experience for undergraduates (REU), which took eight undergraduate students from around the United States and four School of Interactive Games and Media (IGM) students from RIT to study how geogames can improve visualization for disaster planning.  Their study area was city of Dickinson, Texas, where Hurricane Harvey hit the city on August 30, 2017.

The program was developed integrating GIS and game technology by transferring (and updating) data/models from Open Street Map to ArcGIS to CityEngine and finally to Unity. Both local elevation model and flood data were used to model the city and create the game with almost real-life accuracy as best the team could in only a few weeks of summer work!

Project Lily Pad was developed over Summer 2018 with the purpose of teaching spatial thinking in terms of disaster resilience. The game is set in the city of Dickinson, Texas, which was impacted by Hurricane Harvey on August 20, 2017.

Through a series of lectures and background on geogame research, game jams (rapid prototyping of games), game design, programming, geographical information systems (GIS), spatial thinking, and more, the students developed and implemented Project Lily Pad—a serious geogame to demonstrate how to educate citizens about wayfinding in a disaster, like a flood. The name “Lily Pad” derives from the concept of higher elevations where people go to rise above flooding.

Responders in the Dickinson flooding had a chance to review the first generation of the geogame and offered suggestions. There is a new team of REU and IGM students who will collaborate this summer to improve the game, its workflow, and learn more about what a geogame can do as part of RIT’s new MAGIC building. This project is just one of many that bring together films, games, and other technology. Future ideas include investigating virtual reality (VR) for deeper immersion for players, using procedural generation for creating urban environments, and involving residents for crowd sourcing accuracy of urban environments.  It is hoped the geogame concept can be applied for planning for other disaster scenarios besides flooding. The Lily Pad user manual and a game download can be accessed here.

The above images are screenshots from the game. The main character has to navigate Dickinson using a “paper” map and notepad. Playing the game repeated helps the player to develop spatial reasoning of the actual town.

Summary

While the concept has been around for a while (ArcNews Summer 2017), the convergence of geospatial technologies and the game world is only now beginning to take hold in the Empire State.  We are fortunate to have work and research being done in this space at a university, which has strong and established geospatial/GIS and game development credentials. The School of Interactive Games and Media has recently hired tenure-track faculty with research interests in geogames, and so, we look forward to more from RIT in their continuing work this summer and into the coming years.

Contact: 
David Schwartz, PhD
Rochester Institute of Technology
disvks@rit.edu

Editor’s Note:  The author acknowledges the contribution of David Schwartz towards the development and content of this article.

Geospatial Business Spotlight: EagleHawk One, Inc.

Company Name:                EagleHawk One, Inc

Website:                             www.eaglehawkone.com

Established:                       2016

Employees:                       6 + Nationwide network of certified drone pilots

EagleHawk was founded in 2016 by Willard Schulmeister and Patrick Walsh in Buffalo, NY, and has grown to be one of the most successful drone data and services operations in New York State today. Together they bring years of technological and business expertise to the fast moving startup company. Willard has a Master’s degree in Geographic Data Science and Geography from the University at Buffalo and Patrick holds a Master’s degrees in Aerospace Mechanical Engineering from the Rochester Institute of Technology as well as an MBA from Rollins College. Both are licensed sUAS (drone) pilots with the Federal Aviation Administration. EagleHawk has recently added Jonathan Byrd to its executive team. Jon holds an MBA from Harvard Business School and has over 15 years of experience in strategy, finance, engineering, and operations, and has held leadership roles in a variety of companies and industries. EagleHawk’s professional staff includes engineers, pilots, data scientists and industry experts located at their offices in Buffalo, Syracuse, Charlotte and Orlando, as well as other remote locations in the U.S.

EagleHawk has built a solid reputation within the drone community and has completed work for over 100 customers to date, many of which are repeat clients. EagleHawk is a Launch NY portfolio company and an Esri Emerging Business Partner. They are active in the NYS GIS Association and in both the central and western NYS GIS  communities. EagleHawk recently won $500,000 prize in GENIUSNY, the world’s largest business accelerator program for drone systems and technology based in Syracuse, NY.

Geospatial Products and Services

EagleHawk provides a portfolio of specialized services, but they are most often sought out by corporations, universities, and developers for their expertise in campus-wide aerial infrared roof inspections. To date, EagleHawk has inspected over 800 buildings and has found that nearly 80% of those roofs show signs of leaking.

The company has established a routine inspection program that empowers clients with a means to proactively manage and extend the average lifespan of their roofs, enabling a logical and fiscally responsible approach to capital planning and budgeting for roof maintenance. EagleHawk is currently developing a GIS-based asset management software solution that uses artificial intelligence and machine learning to derive meaningful insights from the data they collect.

EagleHawk specializes in the following areas:

  • Geographic Data Collection and Map/Data Processing
  • University and Corporate Campus Physical Inspections
  • Aerial Infrared Roof and Building Analysis
  • Utility and Infrastructure Inspections
  • Sensor Integration with UAV’s

A more detailed listing of EagleHawk’s services can be found at: www.eaglehawkllc.com/droneservices

University and Corporate Campus Mapping & Inspections

EagleHawk has conducted several large inspections for universities and corporate campuses throughout the Eastern United States.  For these projects, the campuses are carefully mapped in order to generate useful information for the inspection, such as building dimensional information, or roof elevation profiles.  EagleHawk conducts both façade and roof inspections  using advanced thermal imagers to detect issues not visible to the naked eye. EagleHawk certified data analysts conduct a building-by-building evaluation and generate meaningful insights from the data collection.

This image, from a SUNY campus, identifies wet and areas of concern within the building roof insulation invisible to the naked eye.  These areas are within the georeferenced “red rectangles” in the upper right image.

Pre-Construction Site Analysis

For this project EagleHawk collected approximately 550 acres of map data and imagery over a rural area in upstate New York for a client. Elevation data was needed for a pre-construction site analysis in order to determine if the area was viable for development.  EagleHawk generated an orthomosaic map, elevation contours and a massive 3D point cloud which allowed for critical decision making regarding plans at the site. This project was a great example of the benefits of drones in capturing geographic data for a large site effectively and efficiently.

For this upstate project, EagleHawk used two drones with 20MP cameras to collect imagery in one field day.  Imagery captured was processed to generate orthomosaic and topographic data delivered in common GIS & CAD formats. Clients receive the data as well as access to an interactive GIS with the data.

Buffalo Niagara Waterkeeper

EagleHawk has worked with Buffalo Niagara Waterkeeper on more than a dozen different project sites throughout western New York including the Buffalo River, the Niagara River, Ellicott Creek and at Tifft Nature Preserve. EagleHawk collects aerial imagery and maps project sites to document change and also generates useful geographic data to aid in shoreline enhancements and restoration efforts.

The Buffalo River is one of eight habitat restoration projects in the Buffalo area that EagleHawk  is collecting imagery on.

Contact:

Patrick Walsh CEO – pwalsh@eaglehawkllc.com
Willard Schulmeister COO – wschulmeister@eaglehawkllc.com
Jonathan Byrd CFO – jbyrd@eaglehawkllc.com

EagleHawk One, Inc –  844-4-UAS-DATA  |   716-810-1042  | info@eaglehawkllc.com
FAA Certified Commercial Drone Operations

Social Determinants of Health: How Place Can Affect Health Outcomes

Why does location matter for health?

In 1948, the World Health Organization defined Health as “a state of complete physical, mental and social well-being and not merely the absence of disease or infirmity.” This definition has evolved over time to recognize additional factors that have been found to impact health. Driven in part by improved understanding of socioeconomic influences, technological changes, and increased attention on health policy, there has been a growing effort to more thoroughly elucidate factors that determine health. Genetics, individual behavior, social factors, the physical environment, health services and governmental policies all have been found to play a role in health outcomes. Crafting effective policy depends upon a solid understanding of each of these factors, as well as their complex interactions.

Social determinants of health—as distinct from medical care—are increasingly recognized as influencing a broad range of health matters, from access to outcome. According to America’s Health Rankings, when compared with other developed and many developing nations, the U.S. ranks at or near the bottom for health outcomes related to life expectancy. However, data from the Organisation for Economic Co-operation and Development (OECD), which seeks to understand what drives economic, social and environmental change across governments, show that the U.S. continues to exceed other countries in healthcare spending.

While the United States trails other developed countries in life expectancy (years), it still leads all others in healthcare spending.

Moreover, evidence illustrating the powerful role of social factors in determining health suggests “the effects of medical care may be more limited than commonly thought, particularly in determining who becomes sick or injured in the first place.” Studies have shown that states with a higher ratio of social to health spending had significantly better health outcomes for adult obesity, asthma, mentally unhealthy days, days with activity limitations, and mortality rates for lung cancer, acute myocardial infarction, and type 2 diabetes. Some studies have estimated that medical care is only responsible for 10-15% of preventable mortality in the U.S., indicating that social factors can lead to—or help prevent—poor health outcomes and inequalities.

To address this, the World Health Organization created the Commission on Social Determinants of Health in 2005. By 2008, the Commission concluded in their final report that “inequities are killing people on a grand scale”. Recommendations included improvement of daily living conditions, addressing the inequitable distribution of power, money and resources, measuring and understanding the problem, and assessing impact of action. Growing awareness also led to U.S. Centers for Disease Control (CDC) research, and implementation of a program to advance health equity called Healthy People 2020 which advocates for the creation of “social and physical environments that promote good health for all”, one of their four overreaching goals for the decade.

The Role of GIS

Location affects health. We see dramatic differences in life expectancy between countries, as well as between zip codes. Socioeconomic differences between countries are tied to disparities in health outcomes. Within the U.S., poverty and transportation affects access to healthcare. At a smaller scale, we know that safer neighborhoods, healthy and secure housing, and access to healthy food and open space are associated with healthier populations. U.S. Census data, American Community Survey data, and other sources can help tie such social factors to geography, allowing for better understanding, measurement 
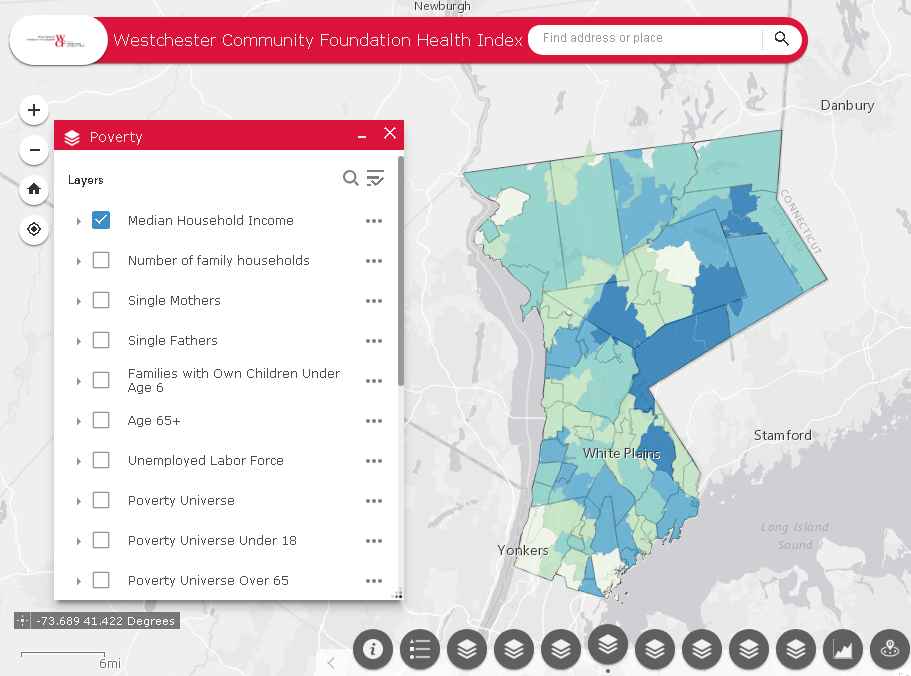
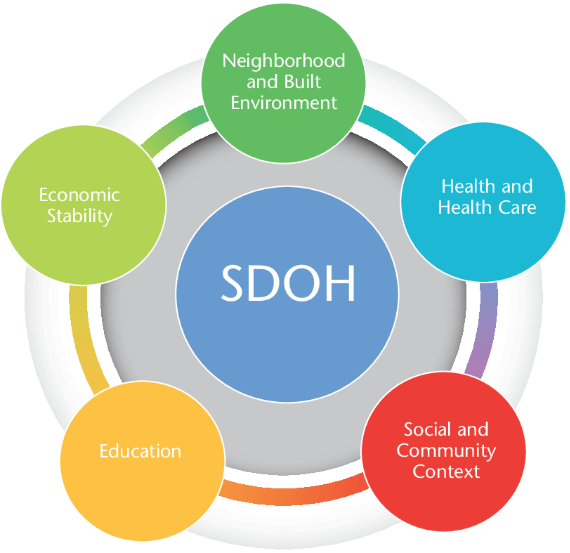
and tracking of social determinants of health. Universities, governmental and non-profit organizations now routinely collect such data and utilize GIS to help inform analysis and better decision-making, leading to stronger policies. The Healthy People 2020 Approach to Social Determinants of Health employs a “place-based” organizing framework, organized around Economic Stability, Education, Social and Community Context, Health and Healthcare, and the Neighborhood and Built Environment.  Many factors reflecting economic stability, such as poverty and employment, can be mapped within a GIS framework. Mapping education levels, literacy and language, quality of housing, environmental contaminants and areas with high concentrations of chronic disease can help to identify vulnerable populations, reallocate resources and better plan interventions and public education and awareness campaigns. Much of this data is readily available and free of charge. Furthermore, GIS lends itself well to Disparities Analytics, the development of analysis and visualization methods to monitor and report health disparities.

The Westchester Community Foundation and the Westchester Index

For 40 years, the Westchester Community Foundation, a division of the New York Community Trust, has worked to improve local and regional quality of life in Westchester County, NY by addressing community issues, promoting responsible philanthropy, and connecting donors to critical, local needs. In this capacity, the Foundation, together with the Community Healthcare Association of New York State (CHCANYS) and Westchester County GIS recently developed and released the Westchester Index, a tool developed to help understand social determinants of health in Westchester County.  The collaboration relied on data from American Community Survey, the U.S. Census survey, the New York State Department of Health as well as school districts for select health outcomes and socioeconomic indicators. The CDC Social Vulnerability Index (SVI), created by the Geospatial Research, Analysis, and Services Program (GRASP) of the CDC, was also included in the Westchester County Index. The SVI uses 15 U.S. census variables at the census tract level grouped into 4 themes (Socioeconomic Status, Household Composition, Race/Ethnicity/Language, and Housing/Transportation) to help identify communities that may need support in preparing for hazards or recovering from disaster.  Westchester County GIS provided detailed data on public transportation, land use

A collaborative effort between Westchester County GIS and the Westchester Community Foundation, the Westchester Index contains data on over 200 indicators reflecting social determinants of health.

categories, as well as locations of environmental hazards. In addition, zip code, census tract and block, school district, municipality, County Legislative district, New York State Senate and Assembly district, and U.S. Congressional district boundaries were provided by Westchester County GIS, allowing for a user to further tailor an analysis. Overall, the Westchester Index contains data on over 200 indicators reflecting social determinants of health. The interactive tool is expected to be used by planning officials, community healthcare networks, school districts, non-profit organizations and others to explore the data and better understand the factors that drive health outcomes in Westchester County, leading to more informed decision-making for greater health equity.  View the Westchester Index Story Map here.

Editor’s Note:  This article was prepared by Anjali Sauthoff.  Ms. Sauthoff is an environmental health scientist currently working with Westchester County GIS to develop integrated approaches that address climate adaptation and community resilience. Her previous research at the Energy Institute at the University of Wisconsin at Madison focused on potential mitigation strategies for reducing transportation-related climate emissions. She received her PhD from Columbia University, where she developed an air pollution exposure model and received training in the health effects of environmental exposures. Her Master’s degree is in Neurobiology from SUNY Stony Brook. She can be reached at ap768@columbia.edu.