10 Questions: Elisabetta (Lis) DeGironimo

Earlier this month it was announced that Lis DeGironimo was appointed New York State’s Geographic Information Officer (GIO). Quite a accomplishment having started her geospatial journey over three decades ago with a copy of MapInfo.  I initiated a conversation with Lis at the end of 2023 which is summarized in the following questions and answers.  The NYS geospatial community is fortunate to have her in this new statewide leadership role.

eSpatiallyNewYork:  How did you get started in geospatial technologies?  

DeGironimo:  My undergrad is in Landscape Architecture from SUNY ESF, so I was very familiar with McHargian overlay analysis for site suitability.  I also always loved computers.  Soon after I started working in the site planning group of a large A&E firm,  I was handed a box of MapInfo software to use for space planning for a military base master plan.  I loved it!  It was my introduction to GIS.  From then on, I started taking courses and eventually went to grad school – also at SUNY ESF –  to pursue a career is GIS.

 eSpatiallyNewYork:  You were with the Mohawk Valley Water Authority for over 20 years.  What were some of your responsibilities there?  

DeGironimo:  At the Mohawk Valley Water Authority (MVWA), I was the GIS and Watershed Coordinator.  Besides being responsible for the GIS/GPS program, I also was responsible for emergency management and water withdrawal reporting.

eSpatiallyNewYork: How did the connection to the NYS GIS Program Office begin?

DeGironimo: At the 2006 NYS GIS Conference in Lake Placid, I was approached by Tom Hart & Dennis Wishman.  They asked if I’d be interested in serving on the NYS GIS Coordinating Body (the precursor to the GAC (Geospatial Advisory Council).  For the next eight years, I attended the quarterly meetings and participated in GIS strategic planning workshops.  The GAC was definitely my favorite professional committee role.  During my GAC tenure, I participated in state-wide GIS strategic planning, and I was blessed with the opportunity to meet some of the legends of the NYS GIS community, such as you!

 eSpatiallyNewYork: What was the biggest challenge stepping into both the Acting GIO and Director of the GIS Program Office position,  and for the most part, managing and directing the program on your own for almost a year and a half? 

DeGironimo: The biggest challenge was learning the scope of the GPO’s involvement.  I’ve been here for 18 months and I’m still learning all the systems in place at NYS.  Building a network within NYS ITS – an organization of over 3,400 people, is a challenge but I’m excited for the opportunity.  Our team expanded about six months after my arrival to include the ITS GIS team that was organizationally located in Shared Data Services.  That part of our GIS team supports many state agencies such as DOT, DEC, Parks, Ag & Markets, and many others.  So in many ways, we are a new organization with an expanded focus.  I’ve spent most of my time focusing on our organization and operations. 

With my recent promotion to GIO, the Deputy GIO (formerly GIS Program Office Director) position opened and we were able to promote Tim Ruhren into the Deputy GIO position.  With Tim’s promotion and his assistance, I look forward to having the time to work more outwardly with our stakeholder community. 

eSpatiallyNewYork:  The GIS Program Office was recast as Geospatial Services in 2023.  What was/is behind this change and name?

DeGironimo:  As I mentioned in my response above, in 2023, the GIS Program Office grew to include all the GIS teams within NYS ITS.  In June 2023, our team moved from a Section in the CTO (Chief Technology Office) to a Bureau with three Sections in the CDO (Chief Data Office).  Our GIS leadership team collaborated on developing a new name and identity.  Our three Sections are: Geospatial Enterprise Services, Geospatial Client Services, and Geospatial Data Services – which houses the framework data programs that comprised the GIS Program Office.

eSpatiallyNewYork: Do you see any changes in the focus of the program over the next several years?  Any movement to become more involved in building additional online applications? (vs publishing data/content)

DeGironimo: We are working on completing a three-year Geospatial Strategic Plan.  Our mission is to deliver geospatial information and capabilities to benefit all of New York – a broad and exciting mission to be sure!  One of the areas we will be bolstering is our governance (organizational, data, web).  We also directly serve many NYS agencies and are working on improving our intake procedures for state agencies requesting services.  I also expect we will publish additional datasets of statewide importance and develop additional public-facing applications.  One of our recent additions is to add a bookmark to our Basic Viewer App.  This bookmark loads a curated set of layers for the surveyor community.

 eSpatiallyNewYork: Any other new major initiatives planned for your office over the next 18-30 months? 

DeGironimo:  We are embarking on a major GIS enterprise architecture modernization project beginning in April.  We are looking to improve physical address geocoding and are exploring address validation.  We also will be modernizing CIRIS (Critical Infrastructure Response Information System) and the Discovery Data NY app.  Internally, we are developing a geospatial service catalog for NYS agencies.

 eSpatiallyNewYork:  Several years ago there was considerable  outreach and promotion by the State GIS program office on NextGen911.    What’s become of this effort?  

DeGironimo: Our team is very active in supporting the NYS entities shepherding NextGen 911 implementation.  Jason Baum, from our team, is co-chair of the GIS Working Group of the State Interoperable & Emergency Communication Board.  Jason also leads our Public Safety GIS Program which serves NYS agencies.  Since GIS is central to NextGen 911, our office will be involved with the implementation. 

eSpatiallyNewYork:  In your new position, what role do you see the Geospatial Advisory Committee (GAC) contributing towards impacting the direction of the services and products offered by your office? 

DeGironimo:  GAC was very involved with our recent Geospatial Strategy workshops and the development of the draft plan.  The GAC will continue to be the voice of our stakeholders.  We are considering adding representatives from the surveying and open-source communities.  We are only scratching the surface of what we can do with the new NYS GIS Clearinghouse.  We will be engaging the GAC to help steer the direction of the Clearinghouse.

eSpatiallyNewYork:  You’re involved with the GIS Certification Institute (GISCI) – you having designed the new Institute logo adopted earlier in 2023 – as a board member and involved in their outreach programs.  What’s your sense of the future of the GISP in New York State compared to other certifications and licenses?  

DeGironimo: I think the GISP credential will continue to gain popularity and recognition.  The December 2023 exam had the largest group to sit for the exam.  Our current GISCI Board Chair is another New Yorker,  Dr. Jochen Albrecht.  Jochen is spearheading exploring the development of a “Pre-GISP” credential for new college graduates.  I am a proponent of both of these credentials because of the rigor of the exam ensures a strong GIS knowledge base and commitment to the profession.

eSpatiallyNewYork: Before your career path drifted into the direction of GIS/geospatial, what were your other professional interests?  Ever think of another profession or job that might have been fulfilling as a career?

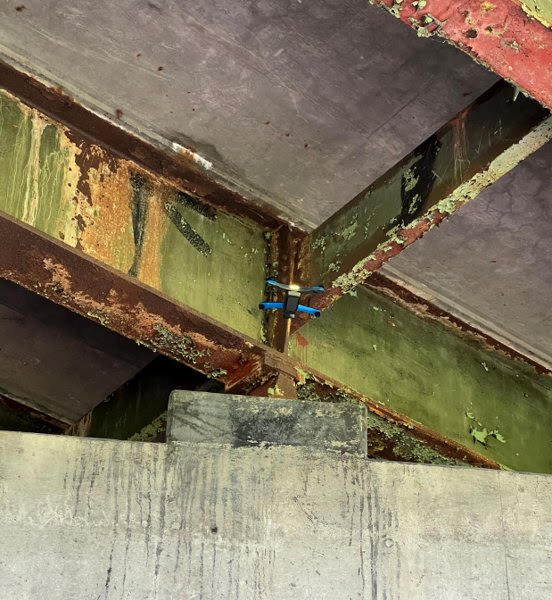
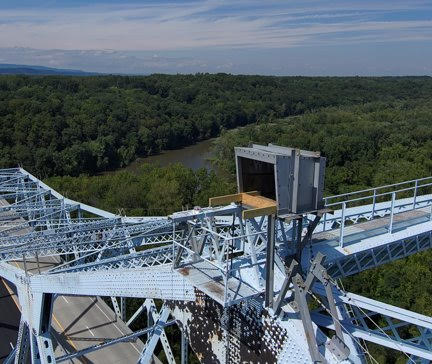
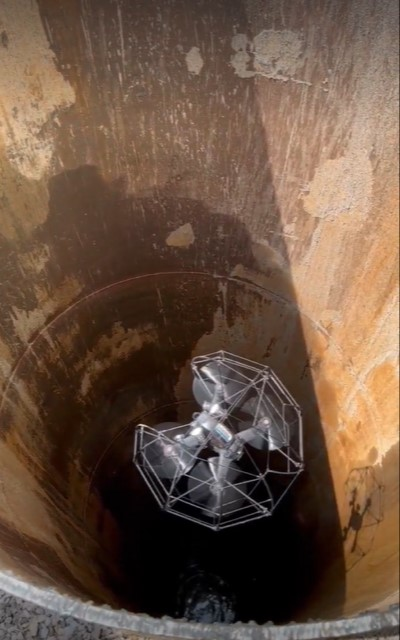
DeGironimo:  My first love (and college major) was architecture.  I also considered majoring in biomedical engineering.  I do a fair amount of architectural design (2D & 3D), construction, and carpentry.  I love designing and building things, so I’m sure I’d find that fulfilling.  I wish robotics were more of a thing when I was younger – though I may be a UAV pilot for my retirement gig.

 eSpatiallyNewYork:  Sorry, but others want to know – how’s your golf game?

DeGironimo:  Not as good as I’d like it to be, but I hope to remedy that in 2024 as time and weather allow!

Contact:
Elisabetta (Lis) DeGironimo, GISP
NYS Geographic Information Officer
New York State Office of Information Technology Services


5 Barriers to Building GIS Programs in Small Governments in New York State

Some barriers instead might be considered missed opportunities but there continues to be specific issues which stifle geospatial growth

Over my 30+ years of managing the Westchester County GIS program, I worked extensively with local governments across the County.  Forty-three in all, ranging from Yonkers, now the third largest city in New York State to several villages which are little more than one-square mile in size such as Buchanan along the Hudson River with a population of 2,302 (2020 Census). All uniquely different in their attempts – and interests – to build geospatial capacity.  Some have been successful while many others have struggled for a myriad of reasons.  This is particularly true among the 23 villages.

Now “on the other side of the firewall” (thanks, Sue Knauss) and working for myself, I’ve been able to see and work further into the organizational framework of these smaller governments.  Confirming many of the observations I made while working with Westchester County that I believe inhibit the development of building geospatial programs at this level of government. Admittedly, the small Westchester County village just north of the Bronx is different in many ways from a small village in Chemung County and one could argue the sample size is too small to be reflective of the entire state of New York, but I would suggest these obstacles to geospatial development are conceptually very similar across the state.   Furthermore, the term “Village” is not necessarily synonymous with small government as the Village of Port Chester 2020 population here in Westchester County was 31,581 – larger than many towns across the state.  So as a point of reference for this article small governments generally mean those with a population of less than 5,000.  Plus or minus.

GIS implementation “how-to” articles, management and primer books, and cautionary experiences shared by software vendors and consultants often include recognized issues such as budget constraints, limited technical expertise, or the lack of a realistic, phased implementation plan, as major culprits in initiating geospatial efforts.   I experienced and witnessed many of these same reasons, though the following are five specific barriers which I believe have a major impact in building GIS programs in small governments across New York State. 

In no particular order:

  1.  Staff Continuity: On the urban fringes, professional staff, particularly in the front offices, turn over at an amazing rate.  Assistants to Village Administrators, Managers, and department heads/commissioners – those who are often tasked to coordinate or serve as a liaison to special projects covering several departments such as GIS implementation – are often on the move.    And it’s not just in the administrative offices where staff turnover is impactful, but also throughout key program offices and departments which touch on GIS implementation such as planning, assessment, public works, and water departments, among others.     Any successful GIS Manager will tell you one of the most important factors in building the program, or any new government initiative, is staff continuity.  Including those who are in charge of managing consultants involved in helping build the GIS program.  Losses in these areas are often a major setback and derail any progress that may have been made in the GIS effort.  In some cases, losing years of work.  It doesn’t matter how good the implementation plan was or the technology being deployed.  

2.  IT Support:  Many small governments often do not have full-time IT staff and normally contract out for this support.  And with it, much of the focus is on infrastructure items such as the network, desktop and peripheral hardware components, client software installations/upgrades and as is the case in all governments and businesses now – maintaining the firewall and supporting cyber security efforts. These contracts, which are often with smaller IT firms, rarely include the support or guidance on multi-department applications such as geospatial programs which increasingly include mobile applications and its peripheral components.  This is not to say smaller IT firms cannot support GIS, it’s just not normally in their wheelhouse.   In small governments, needed GIS support from IT resources for a “government-wide perspective” is often extremely limited.

3.  Software Application Silos:    In small governments where there is often an absence of an overarching “IT committee” and/or the like, as well as combined with the lack of full-time IT staff as noted above, it is not uncommon for individual departments to be left to themselves to make their own business software decisionsAnd as software vendors continue to push for and offer cloud-based/browser only solutions for their software products, it is even easier for individual departments and programs to go rogue and operate further in obscurity from the primary or seemingly “adopted” computing environments in the organizationIn fact, it’s not uncommon for IT support in small governments (I’ve even seen this at the City level) to not even know what browser-based business solutions some departments are using on a day-to-day basis.

What makes this difficult in the GIS space is that practically all business software solutions now include some kind of “mapping” component –  if only to render the application data on some form of generic base map.  Most often Google Maps.   Often the user interface even includes the term “GIS” when simply viewing program data on a map – this being the extent of the “GIS” functionality.  And if and when the broader discussion of a GIS for the government is ever started, these same departments are slow, if ever, to join the effort.  Not knowing the larger intricacies and benefits of a shared, multi-department GIS program – the response is normally  “We already have a GIS“.  Little interest in the shared data model, to say the least of a common address file which most business software products normally ship  to support geocoding.  This cloud-only software application delivery model (mobile apps, too) is very common now in local government permitting, code enforcement, inspections, and even public safety disciplines to name just a few.

If it’s not broken, they are not going to try and fix it.  Let alone spend more money.  Making it very difficult to garner interest for a government-wide discussion on a unified GIS solution.  

4.  VIPs with an Attitude:    That may sound a little harsh, but the fact of the matter is that  just one dominant personality in small governments can impact the  decision making process over a wide range of internal technology issues – not just GIS.  Such individuals exist in all levels of government, but in smaller ones, where staff are few in numbers and  VIPs normally being senior staffers – frequently with decades of service – his or her opinion is often unquestioned.  Your first onsite meeting with folks who are genuinely interested in the GIS goes well – that’s why you’re there in the first place.  But during the second or third on-site meeting which is held to take a deeper dive into the concept – the VIP with an Attitude shows up out of nowhere acting like Lord Vadar.  Often packing a lightsaber.

Because of their decades of institutional knowledge, they have been ordained to know what is best for the good of the order.   Even if he or she isn’t even directly involved in geospatial.  Like a good defense lawyer, raising just an iota of doubt on what is deemed such a good idea by so many others.

Magically the VIPs have the ear of the Budget Director, Comptroller, Finance Director, fellow high ranking directors, or highest elected official.  Or the Town Board.  And so forth.  Across the municipal landscape they can be found in one of many program areas:  Public Works, Finance, Building Department, maybe a small Planning office, or even a long standing consultant who isn’t even on the payroll.  For whatever reason, he or she feels threatened by the technology which is being considered and increasingly adopted elsewhere.    Particularly if the VIP has not taken the time to understand the benefits that geospatial programs can bring.

But it’s not going to happen while they are still around and/or have something to say about it.  In my hometown, early GIS efforts were thwarted by the Receiver of Taxes.  Yes, Receiver of Taxes.  Largely because this office was responsible for “computer related” expenditures.  And nothing was going to compromise his/her annual computer software and hardware needs.  To this day, the program has never gotten on track.

There is really no good solution for the VIP with an Attitude problem in small governments. Sometimes retirement and attrition takes care of the problem though this may take years.  A change in administration sometimes helps, but in small governments new administrators rarely question long standing, senior staff members.  If anything they embrace the input and advice of VIPers.

And the beat goes on.  

5,  Consulting Engineers: Small governments often do not have a professional engineer on staff and normally contract out needed engineering services.  Engineering firms, whether small or large, which secure these services can have a profound impact on the use and development of GIS in small governments.  Though many small governments today do not see or consider their consulting engineers in this capacity.  Most aren’t even aware of the possible connection.

Back in the day of desktop/client GIS solutions, such support by consulting engineers was unrealistic.  But now, with easy-to-use cloud-based offerings such as ArcGIS Online, consulting engineers, along with their arsenal of AutoCAD related products and technologies, can simply envelope this “GIS service” into annual support services contracts.  At many levels of government, and particularly true in smaller ones, consulting engineers come in contact with all types of municipal geospatial data.   While infrastructure data (storm, sanitary, water distribution systems) are often the most obvious, consulting engineers duties also often include staffing local Planning Boards, serving as a liaison to utilities and a myriad of regional, state, and federal programs which include geospatial connections, as well as being involved in a host of local surveying and land/property record issues.    Depending on the in-house GIS resource capacity the consulting engineer maintains and the licensing agreement with the software vendor,  consulting engineers can offer a range of GIS capabilities to get small governments started for minimal investments. 

The reasons are many why this connection is not more common, but this “barrier” is more of a business relationship that more small governments should try and leverage with their consulting engineers.  There are positive and long term benefits for each party.   

Summary

At the end of the day, yes, the scale of small government operations and the scope of the geographical area covered may not seem to justify the investment in a comprehensive geospatial program.  Leading to a perception among the local elected officials, perhaps even department heads, that the benefits may not outweigh the costs.  Though the path I took in and out local government buildings, a basic lack of education and awareness of the geospatial benefits was still always an issue.  Particularly among the highest elected official and governing boards.  But it doesn’t stop there as I believe there still continues to be a significant lack of awareness or understanding of the broad spectrum of geospatial technologies among elected state representatives as well.    

For years, I’ve passively monitored the websites of New York State Association of Towns and New York Conference of Mayors as a source of ideas for articles for this blog.  Both organizations represent elected officials (including council members, boards, clerks and other municipal staff members as well) and are an excellent source of advocacy for small government programs and funding where geospatial technologies can be applied (i.e., transportation, infrastructure, public safety, environmental protection, etc).   Even New York State Association of Counties (NYSAC) for the most rural of our state counties serves in this capacity as well.  If one takes the time to drive around and research each of the association websites, including using key word search tools, there is little reference to GIS or geospatial technologies.  Or for that matter, little of the technologies that geospatial is wrapped into. 

These organizations would be an excellent source of geospatial awareness at their newly elected training programs or annual conferences – which are extensive.  Helping connect geospatial to the programs they fund and how the tools are applied locally.   (For this article I looked for similar training sessions for newly elected New York Assembly members but could not find any specific programs).  Perhaps an opportunity for organizations like the NYS GIS Association or our emerging academic programs to provide training session/seminars to these associations.

There will continue to be exceptions, but until the opportunities and awareness of geospatial technologies are better understood, small government GIS programs in New York State will continue to struggle.

GIS and Mapping Activities at Mohonk Preserve in the Shawangunk Mountains

While traditional trail maps (hardcopy and digital) are still paramount and important, Mohonk Preserve uses GIS for environmental and facility management purposes as well.

 Mohonk Preserve is a nature preserve in the Shawangunk Mountains in Ulster County consisting of over 8,200 acres of cliffs, forests, fields, ponds and streams, and a wide range of unique environmental habitats. It also has over 70 miles of carriage roads and trails for hiking, cycling, trail running, cross-country skiing, snowshoeing, and horseback riding. It is also a major destination for rock climbers in the eastern United States. The Preserve is New York State’s largest nonprofit nature preserve with an estimated 300,000 visitors annually.

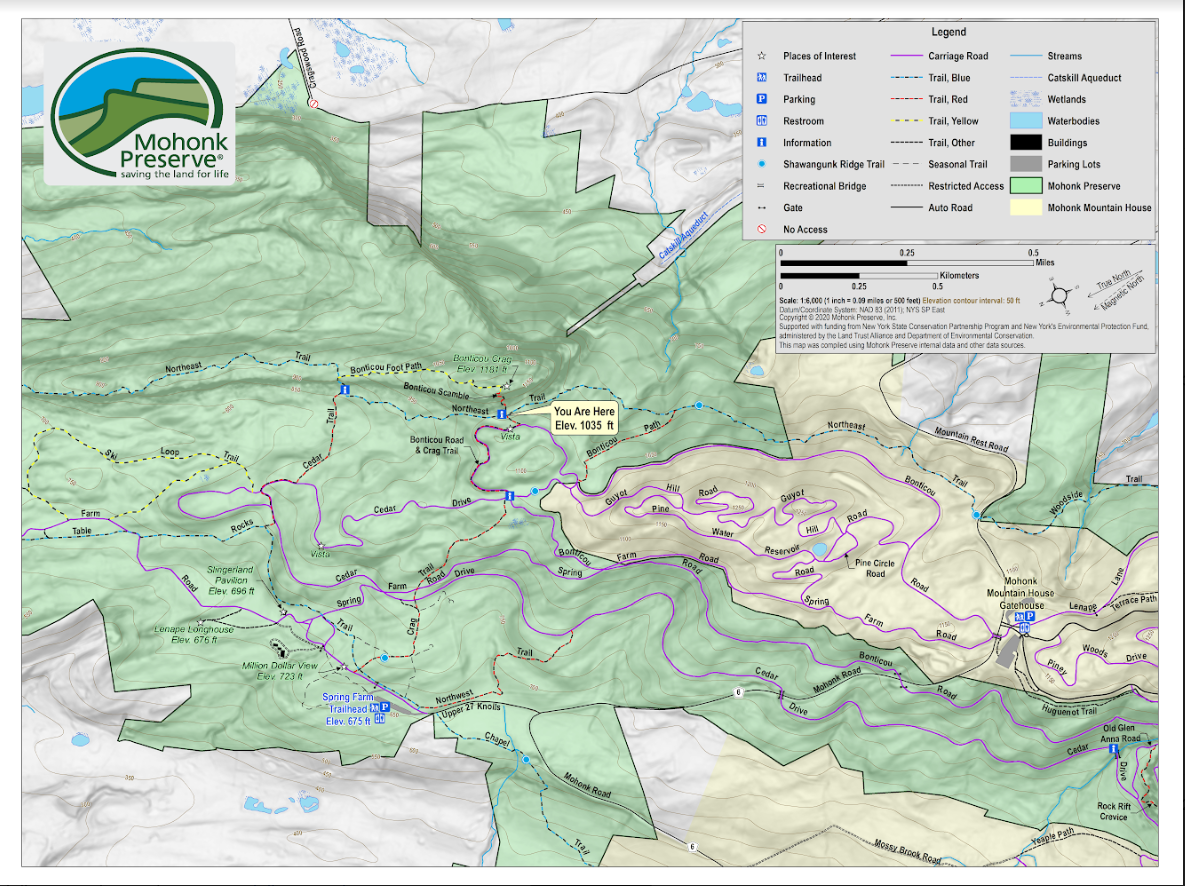
Map making and cartography are still particularly important skillsets at Mohonk
Preserve given the focus on trail use and rock-climbing activities. This is the
wayfinding or locator map that is on the ground (board attached to post) at the intersection of
Crag Trail and Northeast Trail, near the base of the Bonticou Crag Scramble.

Due to its rich biological diversity, New York State’s Shawangunk Mountains (a.k.a the “Gunks”) is one of the most important sites for conservation in the northeastern United States. Because of the many rare natural communities and species found here, the New York Natural Heritage Program ranked the Shawangunks highest in biological diversity. The northern Shawangunk Mountains support 42 state rare species, eight state rare ecological communities, and three globally rare ecological communities in a forested landscape surrounded by residential housing and agricultural uses. Geospatial technologies have supported many government and non-profit-led scientific efforts and studies in the region for years.

Current GIS Applications

Since the early 2000s Preserve staff have been using GIS to inventory and map rare species and habitats in ArcGIS, as well as a wide range of recreational trail maps and related products. Leading the current and most recent use of GIS at Mohonk Preserve is Ed Pestone who serves as Land Protection and GIS Manager. Pestone’s geospatial toolbox includes: ArcGIS client (Map/Pro), ArcGIS Online, Field MapsSurvey 123, and Quick Capture.  Helping support higher accuracy field data collection, support staff also use Bad Elf GNSS Surveyor with real time kinematic (RTKpositioning. For the final rendering of maps and cartographic products, staff use several of the apps found in the Adobe Creative Cloud platform.

In recent years, Pestone and the entire Preserve staff have embarked on a major redesign of the preserve-wide map which was a nearly 20-year-old, hand drawn map by artist Jack Fagan. While still functional, the Fagan map was missing several elements both staff and visitors felt needed to be included in an updated map. Approaching the update with a focus on “wayfinding” – in both the hardcopy and digital format – the new map would include new trailheads, new lands acquired by the Preserve, emphasize and better symbolize elevation, and be a product which could be used at trailheads and widely distributed (color and greyscale versions). It was also hoped and intended that the new map would reduce the number of lost hikers. It was an incredibly comprehensive and inclusive redesign effort which is documented in this Hudson Valley online news journal article. A more comprehensive overview of the project is included in the YouTube video from a 2021 inhouse webinarA geo-referenced version of the new map is available for the Avenza app which can be accessed using this link.

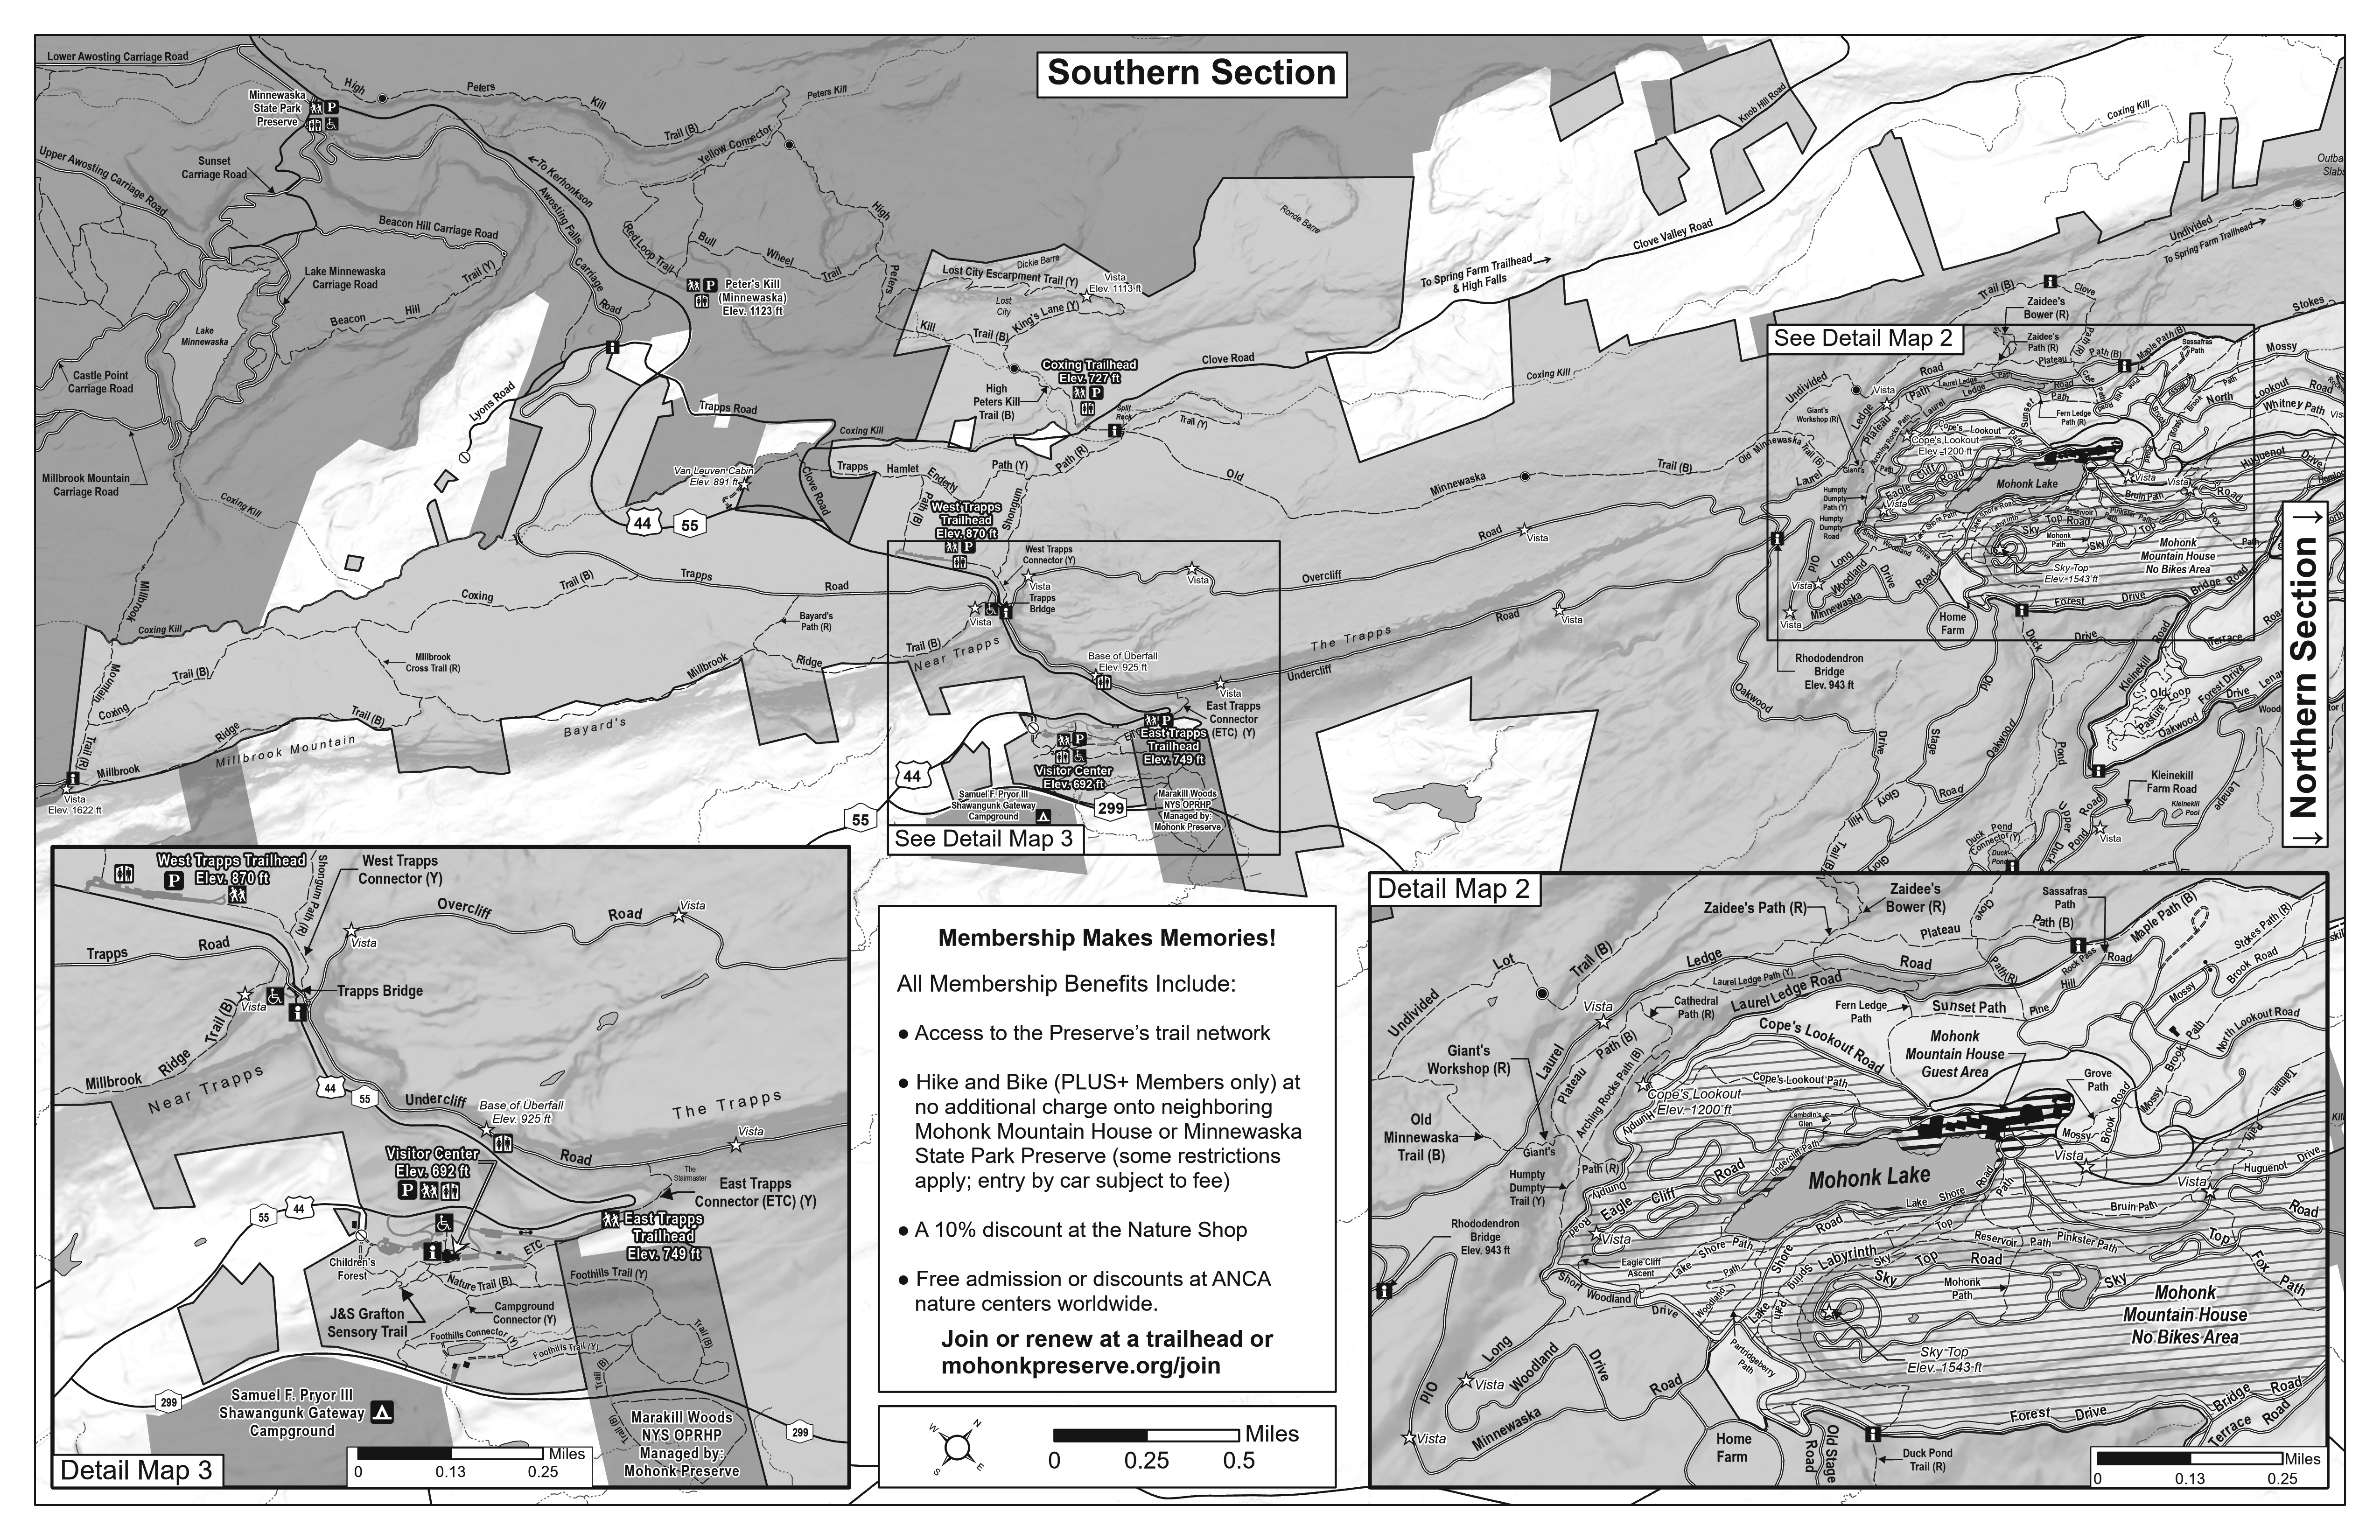
At the request of Preserve Rangers, redesign of the new map included the production of a
greyscale fold-up version which is broken into a “Southern Section” on one side and a Northern Section” on the other (not shown). Rangers wanted an easy to reproduce map that could be given out for free on the trails to hikers and other recreationists.

Geospatial Data

The Preserve data catalog includes an extensive range of both
natural/environmental, cultural, and human-made geographic features. Mobile data collection efforts have collected built environment datasets such as culverts, bridges, signage, waterbars, trailheads, buildings, and parking lots. A majority of this current data was collected in Field Maps by our 2021 Scheuer Intern. The Preserve's carriage roads/trails (as well as the Preserve boundary) are publicly available on ArcGIS Online, they are also both on ESRI vector basemaps through the Community Maps Program. Environmental datasets include forest types (including forest health plots) protected lands, deer and land management units, and significant habitats/species (contributed by both NY Heritage Program and Preserve staff). GIS mapping has also been used to document the locations of rock shelters, historic building foundations, and burial grounds, as well as in support of mapping (courses, mile markers, and aid stations) for special events
such as the Shawangunk Grit. Just a sample of the man-made features mapped at the Preserve include, but not limited to, 356 interpretive signs, 288 trail/directional signs, 290 culverts, 43 gates, 156 waterbars, and 148 traffic/parking signs among others.

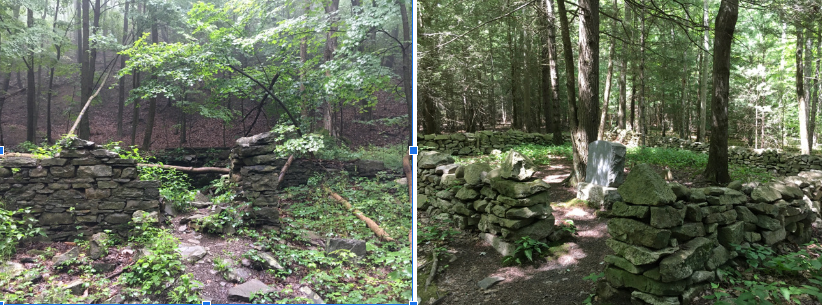
Two of the many man-made and cultural features inventoried in the Preserve using ArcGIS Field
Maps by seasonal staff: historic building foundations (left) and cemeteries (right).

Local data such as parcel, surface water, and zoning datasets are
obtained from Ulster County GIS.  GIS work at the Preserve also
leverages data from many sources including the NYS GIS Clearinghouse, NYS Dept. of Environmental Conversation, NYS Office of Parks, Recreation and Historic Preservation, as well as CUGIR at Cornell University, U.S.G.S (national wetlands inventory, National Hydrology Dataset [NHD], and digital elevation data), the Nature Conservancy, and Scenic Hudson. Quite a list.

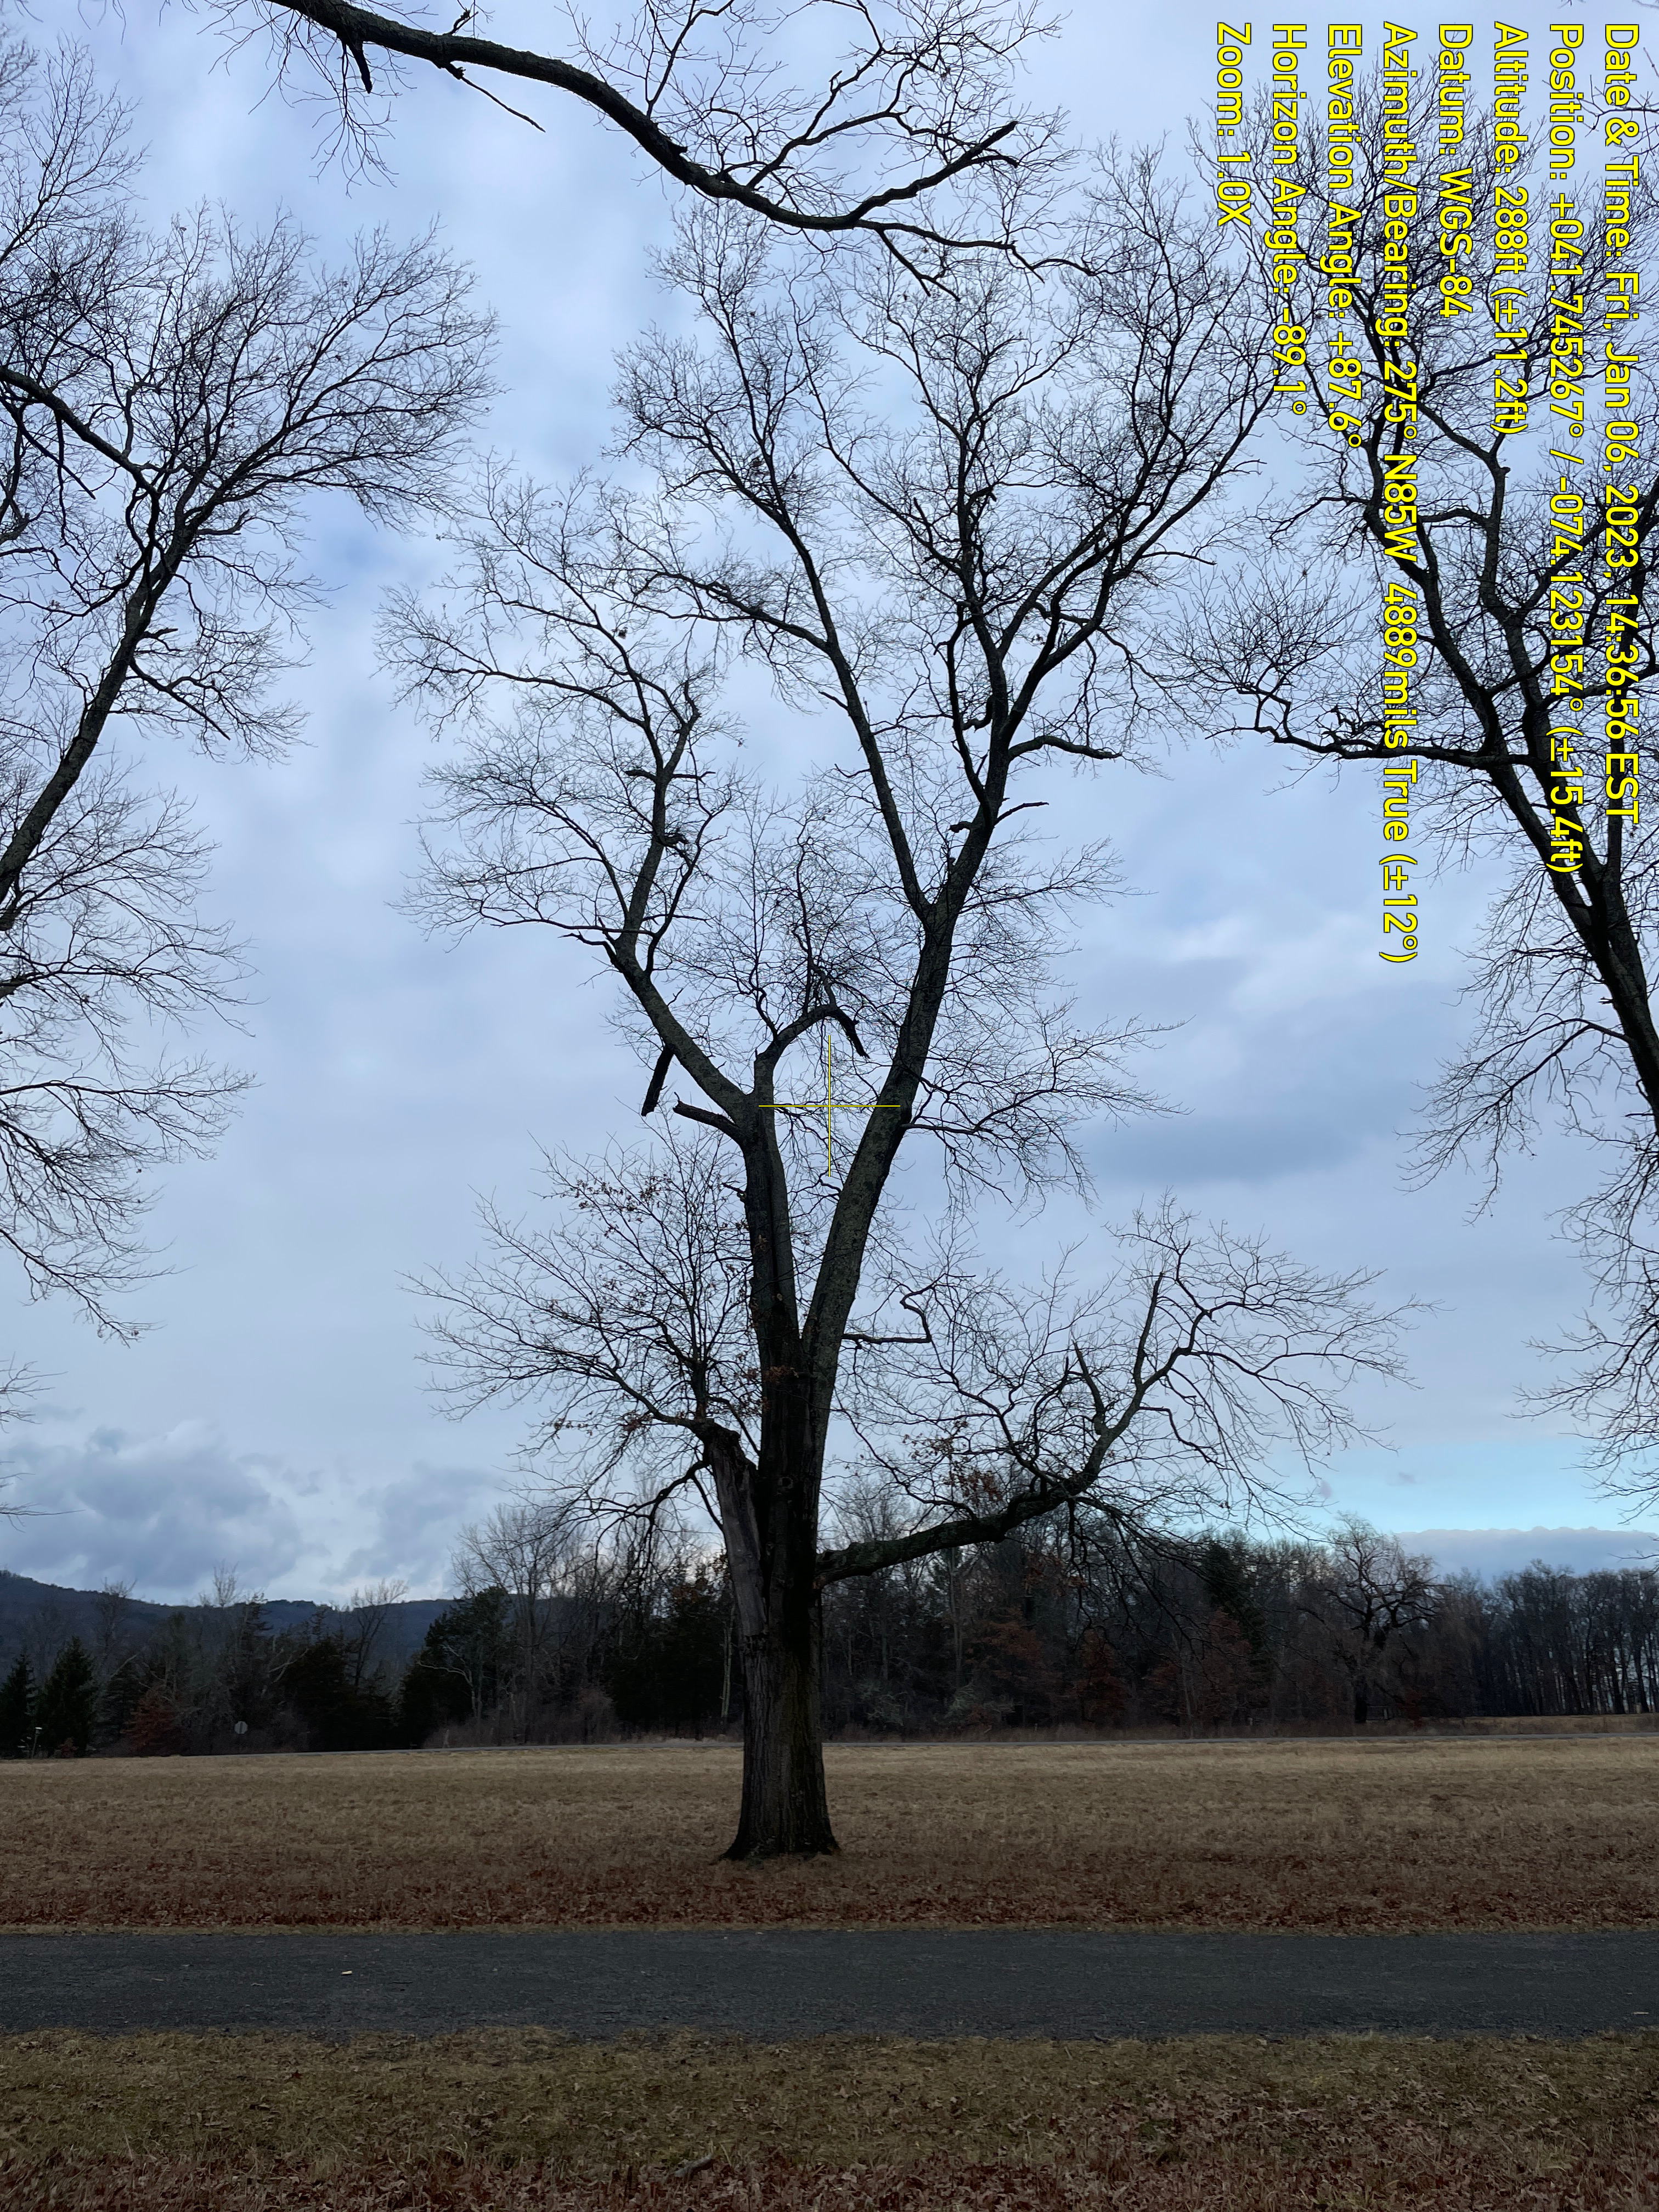
Pin Oaks (Quercus palustris) are an important tree species on the Preserve often bordering some
of the most historic carriage roads. Many of the oaks along carriage roads are at or nearing
their general life span. The Preserve has mapped the location of the Pin Oaks monitoring and
documenting the condition of trees at least once annually (leaf off for photos) using Field Maps.
Work such as cabling, pruning and removing some of the trees is involved in the management
program.

Summary

“Mapping and GIS are integral parts in all aspects of managing the built and natural environment at Mohonk Preserve” notes Pestone. He adds “In the future we see expanding use geospatial technologies by both seasonal and full-time staff and with our collaborating agencies. I anticipate no shortage of uses and applications.”

Contact:

Ed Pestone
GIS and Land Projects Manager
Mohonk Preserve
epestone@mohonkpreserve.org


Mesonet Collects High-Accuracy Weather Data for Mapping and Data Visualization Applications

University at Albany Program Hosts Third Annual Symposium September 13-14

Background

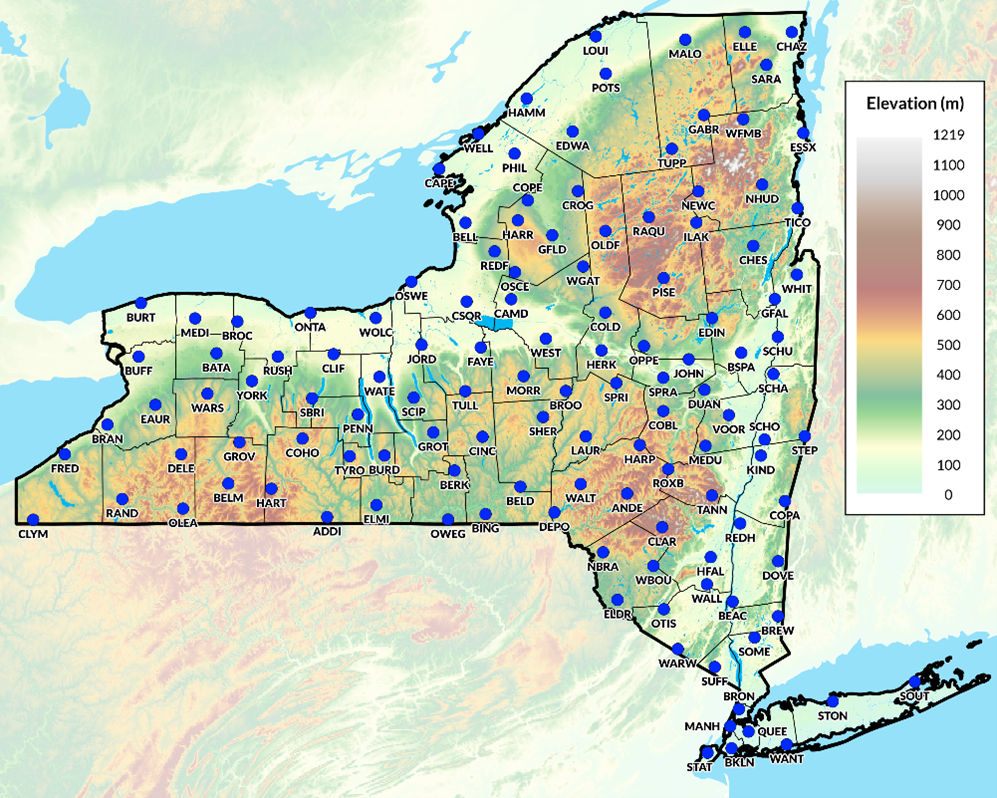
In April 2014, the State of New York in collaboration with the Division of Homeland Security and Emergency Services funded the University at Albany to design, install, and operate the NYS Early Warning Weather Detection System. The centerpiece of the system is the New York State Mesonet (NYSM) network of 126 weather stations across the state, with at least one site in every county and borough. Each of the Mesonet’s 126 weather stations collects observations of surface temperature, relative humidity, wind speed and direction, precipitation, solar radiation, atmospheric pressure, snow depth, and soil moisture and temperature at three depths (5, 25, and 50 cm). Each site is also outfitted with a camera that collects still images.

In addition, several sub-networks of specialty sites have been deployed. A Profiler Network of 17 sites, which leverages LiDAR technology, provides additional atmospheric data in the vertical (up to 6 miles above ground); a Flux Network of 17 stations monitors the surface energy and a Snow Network of 20 sites which measures snow water content. Operated by the University at  Albany, the New York State Mesonet collects, archives, and processes data in real-time every five minutes, feeding weather prediction models and decision-support tools for users across the greater New York region. The NYS Mesonet implementation is part of the larger National Mesonet Program. NYSM is a cross-disciplinary team supporting a standard of excellence in delivering high-quality weather data across the Empire State.

The Mesonet network includes stations in all 62 New York State counties including the five boroughs of New York City

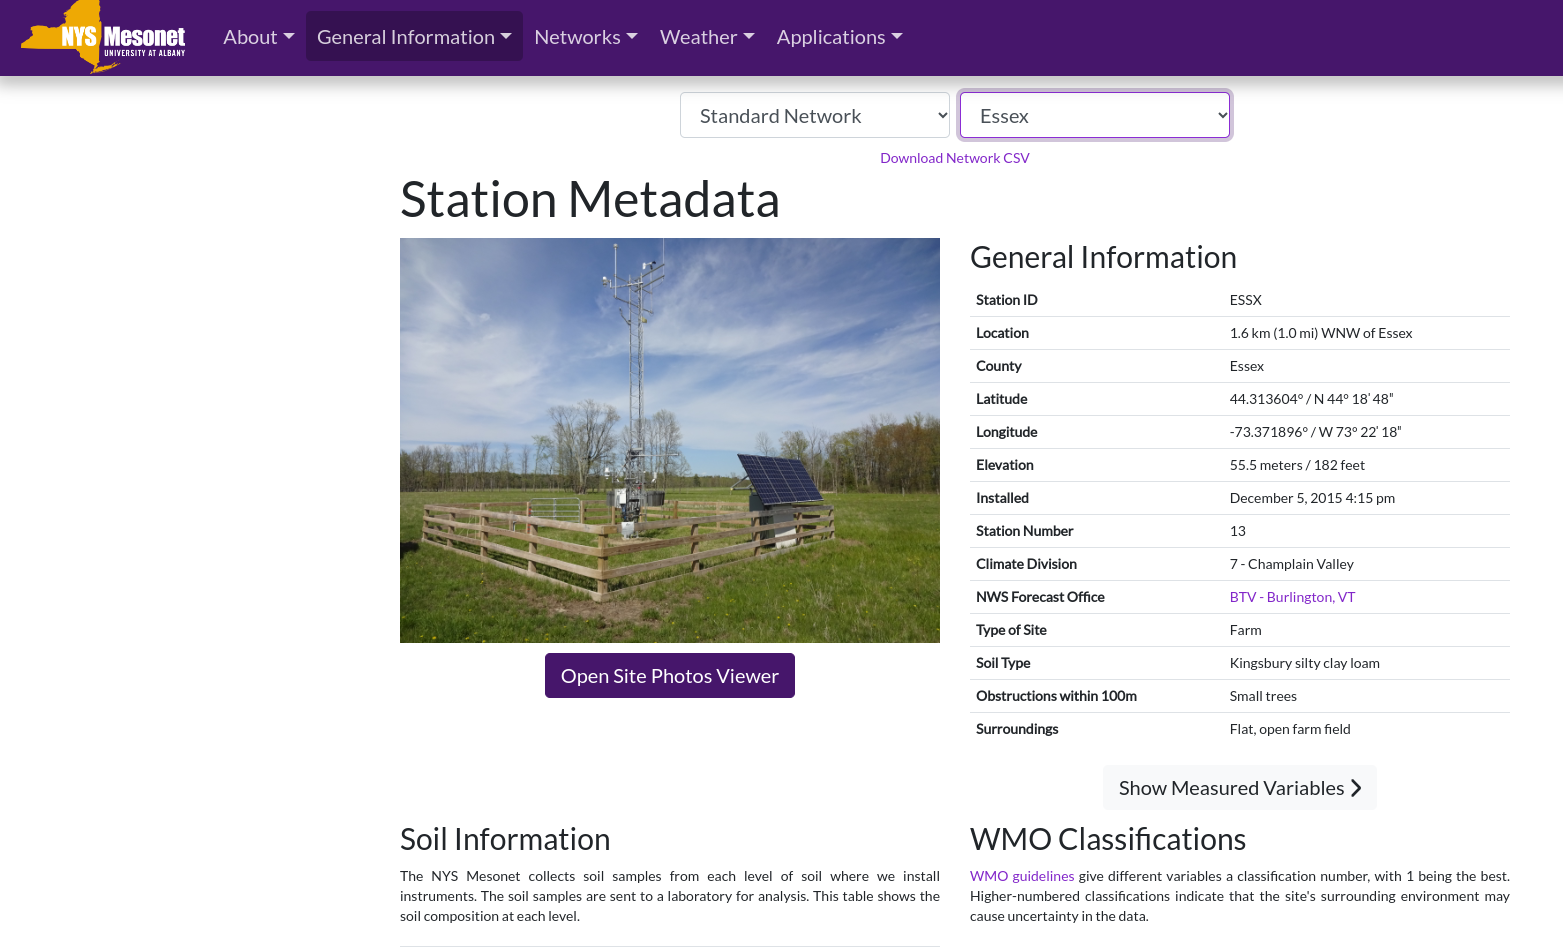
Metadata is provided for each site including lat/long, local landscape characteristics, pictures, elevation, soil classification, among other items.  Adjacent variables, such as obstructions, are reflected in a World Meteorological Organization (WMO) rating which indicates that the site’s surrounding environment may cause uncertainty in the data.

Detailed metadata is available for each station across the Mesonet network which can be used in supporting local weather-related mapping and analysis applications

Data and Geospatial Products

NYSM utilizes these high quality weather data to create end products designed for use by government, academic, and with commercial partners. NYSM supports solving real-world problems in agriculture, emergency management, energy, transportation and protecting public health. Much of the mapping and data visualization products on the Mesonet site is the responsibility of Nathan Bain, Sr. Software Engineer, NYS Mesonet, University at Albany, SUNY.  “The core set of software products I use in publishing content on the website include OpenLayers, python scripting, REACT for website development, and Highcharts for interactive time-series plots and line graphs.”

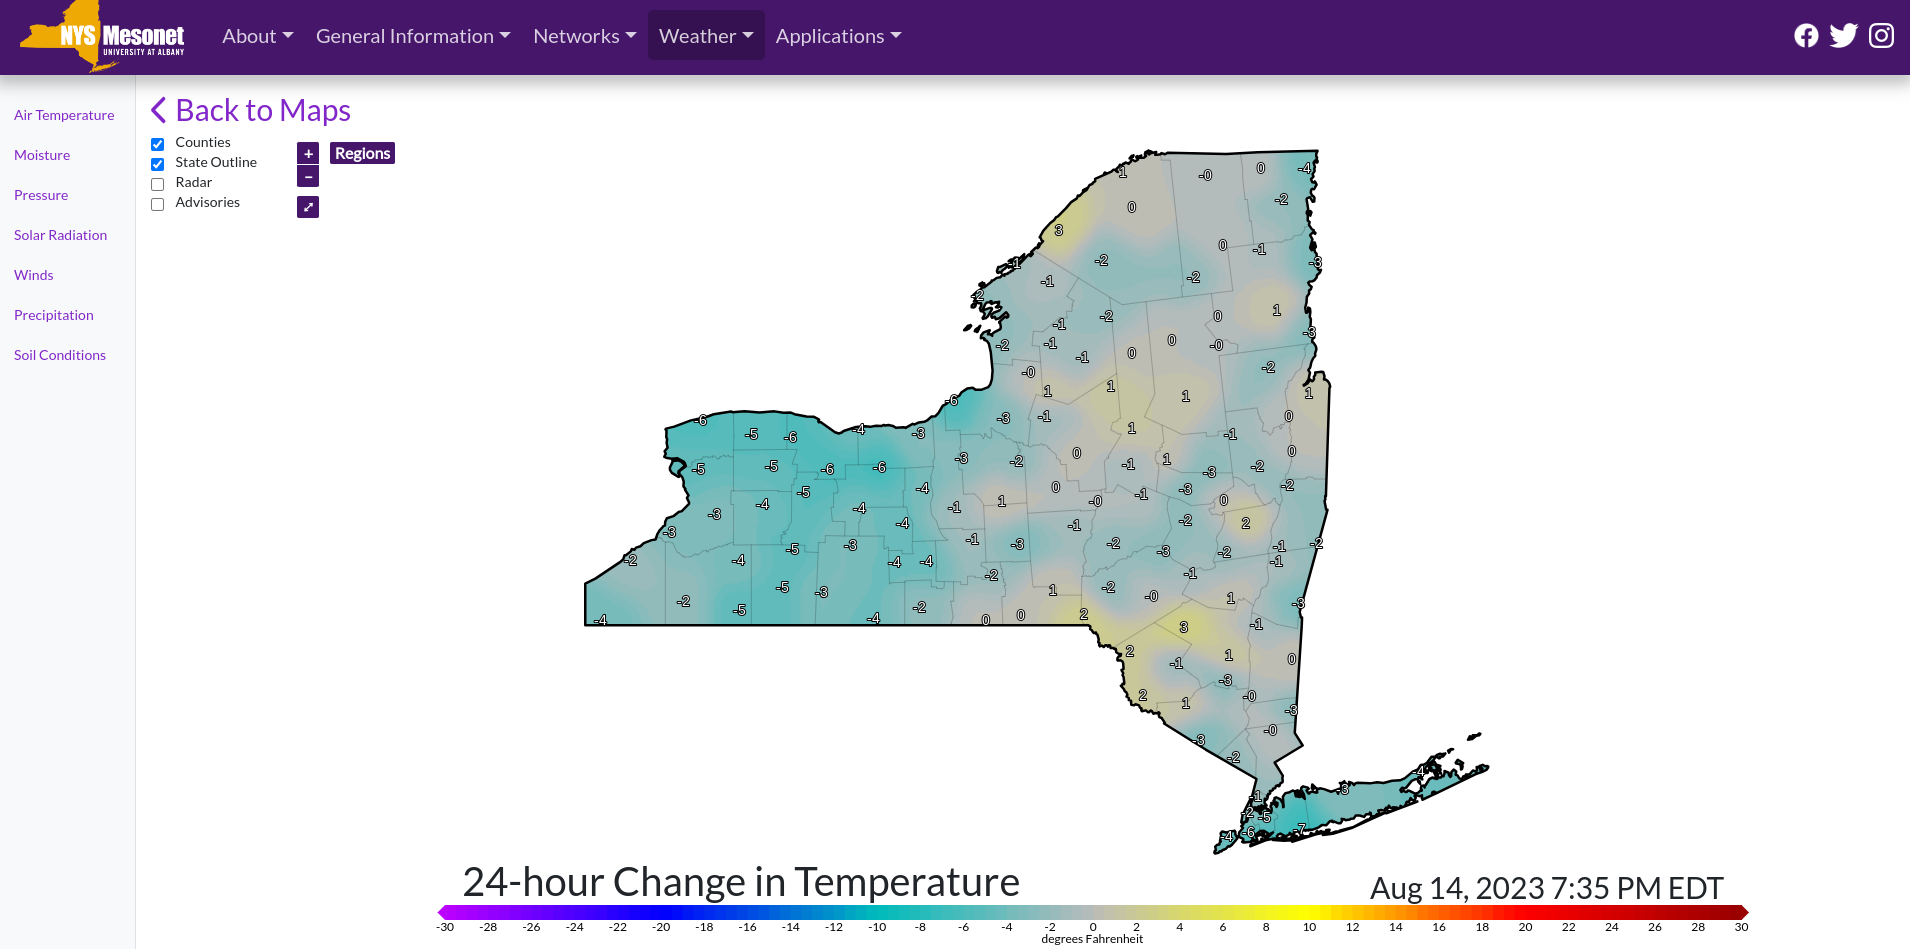
According to Bain, frequent users of the data are the National Weather Service, New York State Department of Health, New York State Department of Environment of Environmental Conservation, a variety of forensic meteorological companies, and private citizens.  Forty-four maps are updated every five minutes as presented on this page.

24-hour temp change is one of the many maps which is refreshed every five minutes on the Mesonet website

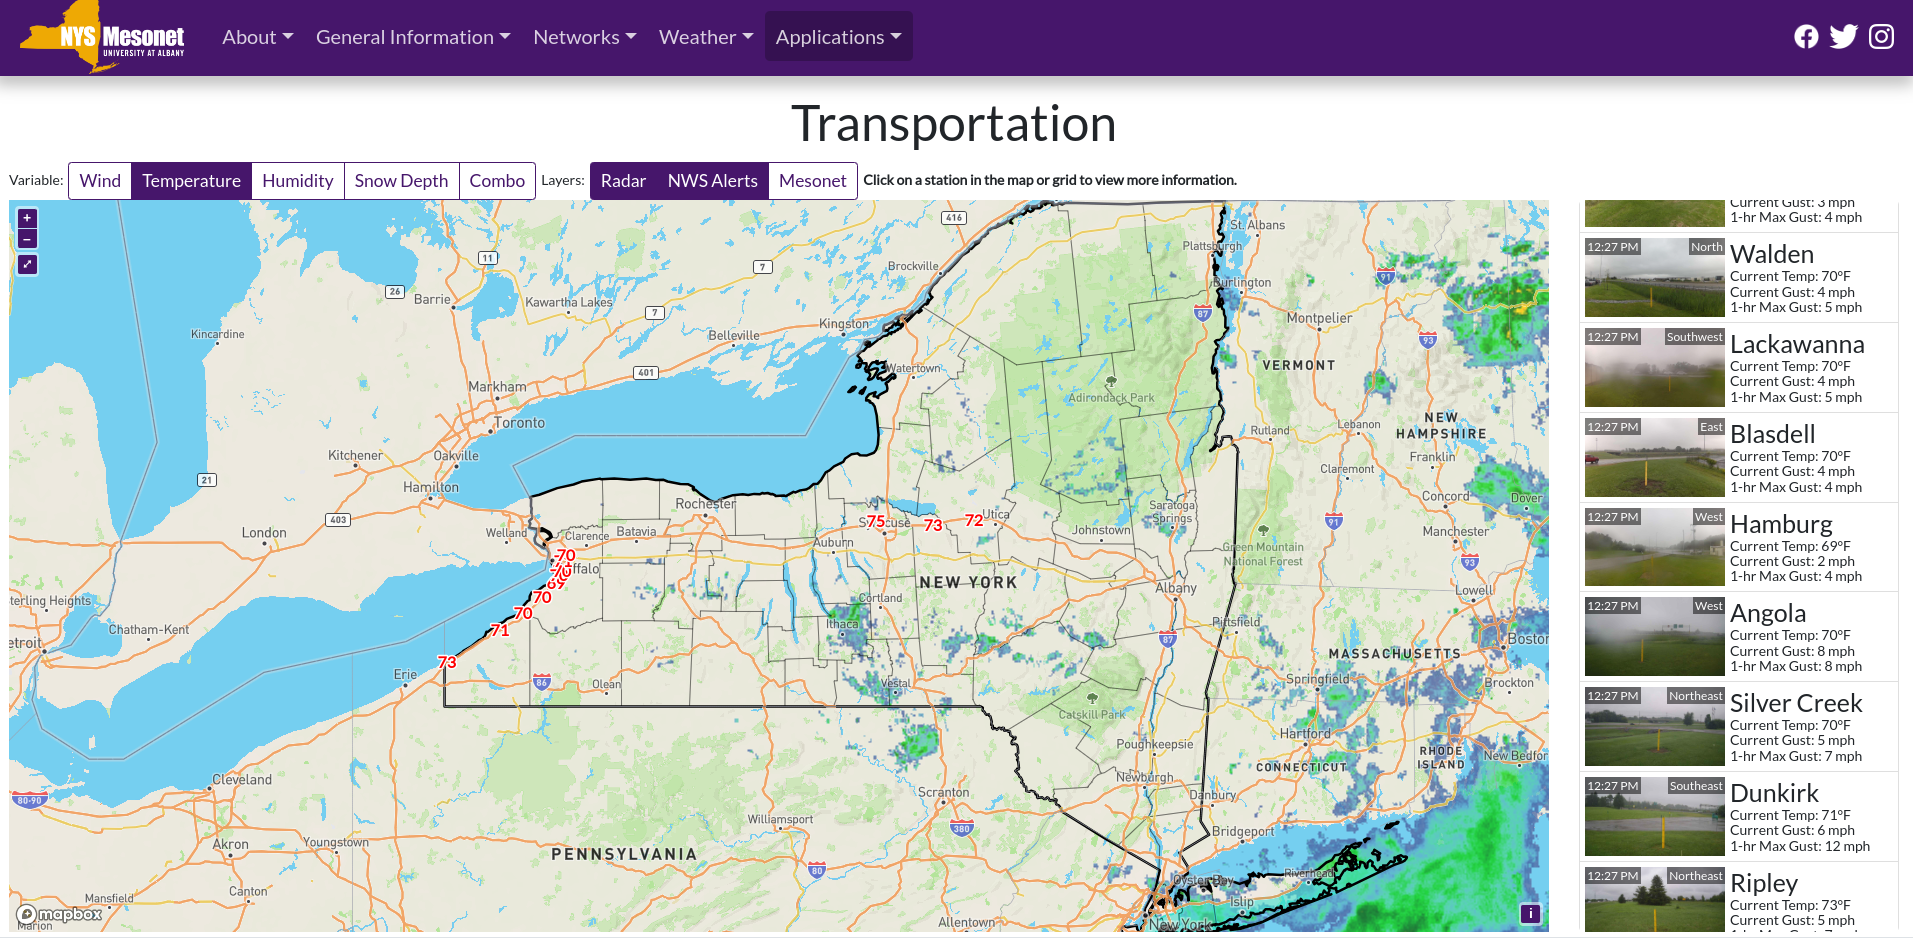
Mesonet field station data can be requested by completing and agreeing to the terms found in the Data Request Form. Data can be delivered in either NetCDF (network Common Data Form) which is a format for storing multidimensional scientific data (variables) such as temperature, humidity, pressure, wind speed, and direction. Each of the variables can be displayed through a dimension (such as time) in ArcGIS by making a layer or table view from the netCDF file. Data can also be delivered in normal CVS  format. Today’s weather statistics are available here. One interactive mapping application which Mesonet publishes “live” is its Transportation app showing the weather variables from sites along the NYS Thruway.

While many of the Mesonet Thruway weather stations are located in western New York near Buffalo, real-time data is collected as far east as Oneida.

September 2023 Conference

The Third Annual New York State (NYS) Mesonet Symposium will be held on 13-14 September 2023 at UAlbany’s ETEC building. Similar to previous symposiums, this will be a chance for people from academia, government, and the private sector to present on research and operational applications of the NYS Mesonet data. While in-person participation registration has been closed, those interested in participating via Zoom can use this link and a copy of the September agenda including presenters and participating organizations is available here.

Contact:

Nathan Bain
Software Engineer
NYS Mesonet
University at Albany
nbain@albany.edu

Engage New York Puts Nonprofits and Community-Based Service Providers on the Map

Application identifies similar focused programs across the state which can support funding and philanthropic efforts

While the cost and ease of entry into web mapping has come down significantly over the past several years, many organizations – particularly nonprofits and community based programs – still do not have the capacity to create or support their own web mapping program.  While it’s easy enough to create a basic web presence and business profile with Google,  smaller, more community service focused programs can often gain wider exposure as part of larger, more thematic based web mapping applications.  When carefully assembled and exposed to the right audiences, these same mapping services are now serving to reach philanthropic programs looking to support nonprofit efforts and expand their geographic funding footprint.

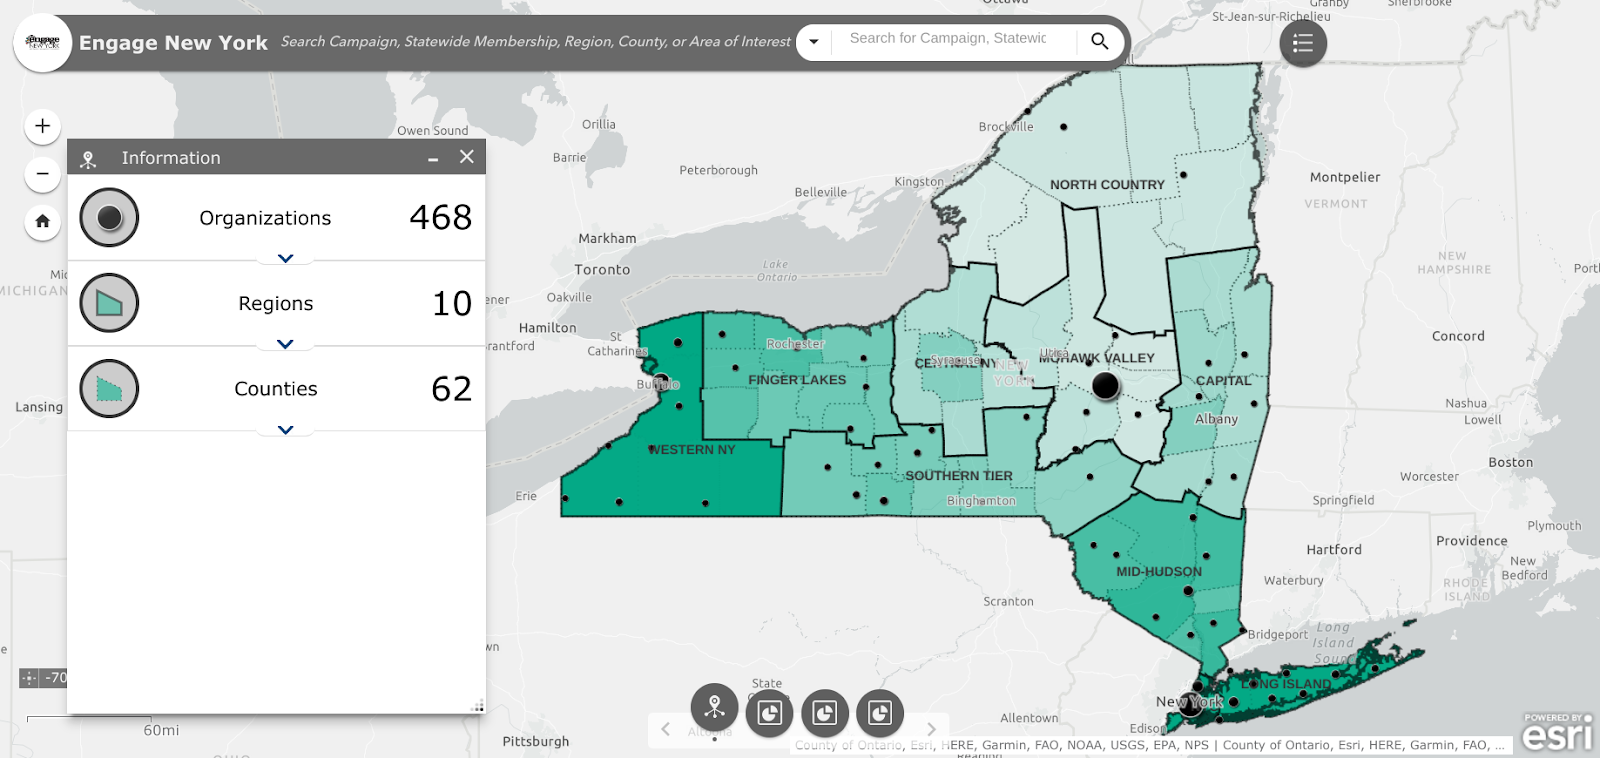
The 10 Engage New York regions are consistent with the New York State Economic Development Regions

One such web map is Engage New York.  Launched in 2021, this interactive map is intended to constitute and visually represent  the Empire State nonprofit landscape which is critical to foundations and nonprofit leaders in supporting community-based initiatives  The initial map included over 300 organizations which categorizes their services as well as identifying the geographic area where they’re located and working.   It is intended to be used by nonprofit leaders and funding organizations to build relationships, strengthen interregional networking, identify geographic gaps in the nonprofit ecosystem and aid place-based nonprofits to find peers and colleagues working on similar issues in other regions of the state. The map is the work of the organization of the same name – Engage New York (ENY).

After reinvigorating the network in 2018 and focusing on issues including immigration and safe and healthy housing, ENY in 2020 moved to support movements and movement leaders throughout New York State that were organizing communities impacted by injustice. Engage New York Program Manager Lisa Fasolo Frishman comments “We know that all of the issue areas are intersectional and it is more important for us as a network to support leaders and movements that are inclusive of voices that are often excluded from advocacy efforts particularly in underserved and rural areas. Census 2020 and redistricting work has been a pivotal area for us because representation matters, and we are committed to ensuring communities impacted by injustice are seen and heard.”

Continue reading

10 Questions: ChatGPT for New York State GIS

I thought I was going to get out in front of all the ChatGPT for GIS discussion for the New York State GIS community, but that turned out to be off by a magnitude of sorts.  YouTube is already replete with ChatGPT for GIS tutorials and if we wait until next week there will probably be another ChatGPT alternative.  (I found the Matt Forrest YouTube video a good ChatGPT for GIS intro – actually formed a question after one of his examples).  Even Amazon jumped into the frey recently with their Amazon Bedrock option.  Take your pick, Bing Chat, Chatsonic, YouChat, Google Bard (available via a waiting list) and a whole host of others on the market in 2023. 

No, the robots aren’t taking over and I suspect we won’t see any of the early Terminator Cyberdyne Systems androids applying for your local GIS Analyst position anytime soon – though it might be a solution for those long dreadful digitizing jobs in the cart lab.  One way or another, Chatbot AI technology is definitely here to stay, evolve, and become another piece of the geospatial toolbox.  

Nothing specific or implied in any the questions.  Just random chains of thought though it does take a little getting used to putting the questions together vs. a basic Google search.  And it does seem to help to refresh and ask the same question twice – or even three times – to get more detailed results.  Never was a programmer, so a little short on questions in that space.

A lot here.  Actually 17 questions in all.  Straight copy and paste. Skim through as you want – find a topic/question you might be interested in.  There are tons more which could have been included.

Without any further adieu, my first machine interview: 

eSpatiallyNewYork:  What freshwater fish datasets are best for mapping fish population based on water depth in the Great Lakes?

ChatGPT:  There are several freshwater fish datasets that can be useful for mapping fish populations based on water depth in the Great Lakes. Here are a few options:

  1. Great Lakes Acoustic Telemetry Observation System (GLATOS) – This dataset provide information on the movements and behaviors of tagged fish in the Great Lakes.  It includes data on depth, temperature, and location, which can be used to create maps of fish populations based on water depth.
  2. Great Lakes Fishery Commission (GLFC) – The GLFC maintains a database of fish populations in the Great Lakes.  This dataset includes information on fish specifies, size, and location, which can be used to map fish population based on water depth.
  3. Great Lakes Environmental Database (GLENDA) – GLENDA is a comprehensive database of environmental data for the Great Lake region.  It includes information on water depth,  temperature, and environmental factors that can be used to map fish populations.
  4. USGS Great Lakes Science Center – The USGS Great Lakes Science Center conducts research on fish populations in the Great Lake and maintains a database of fish surveys.  This dataset includes information on fish species, abundance, and location which can be used to map fish populations based on water depth.

Ultimately, the best freshwater fish dataset for mapping fish populations based on water depth in the Great Lakes will depend on the specific research question and the type of analysis being conducted.

eSpatiallyNewYork:  To what degree of accuracy can I map features from New York State orthophotography?

ChatGPT:  The degree of accuracy with which you can map features from New York State orthophotography depends on various factors such as the resolution of the imagery, the accuracy of the ground control points used for georeferencing, and the skill and expertise of the analyst.

New York State orthophotography typically has a resolution ranging from 0.5 to 1 meter, which means that individual features such as buildings, roads, and other infrastructure can be identified and mapped with a reasonable level of accuracy. However, mapping smaller features such as individual trees, shrubs, or small structures may be more challenging, as these features may not be visible at this resolution.

The accuracy of mapping also depends on the quality of the georeferencing. The accuracy of the ground control points used for georeferencing should be of a similar or higher resolution than the orthophotography itself. This ensures that the imagery is correctly aligned with the ground, allowing for accurate measurements and mapping.

The skill and expertise of the analyst are also critical factors in the accuracy of mapping features from orthophotography. A trained analyst with experience in image interpretation and feature extraction techniques can accurately identify and map features with a high degree of accuracy.

Overall, mapping features from New York State orthophotography can provide a reasonable degree of accuracy for larger features such as buildings, roads, and other infrastructure. However, mapping smaller features may require higher resolution imagery or other sources of data. It is always important to validate and verify the accuracy of the mapping results through ground truthing and other quality control measures.

Continue reading

March 2023: Tax Parcel Data Sharing in New York State

Half of New York’s Counties now make parcel data available for free through Open Data efforts though barriers in specific governments still need to be overcome before statewide data is available

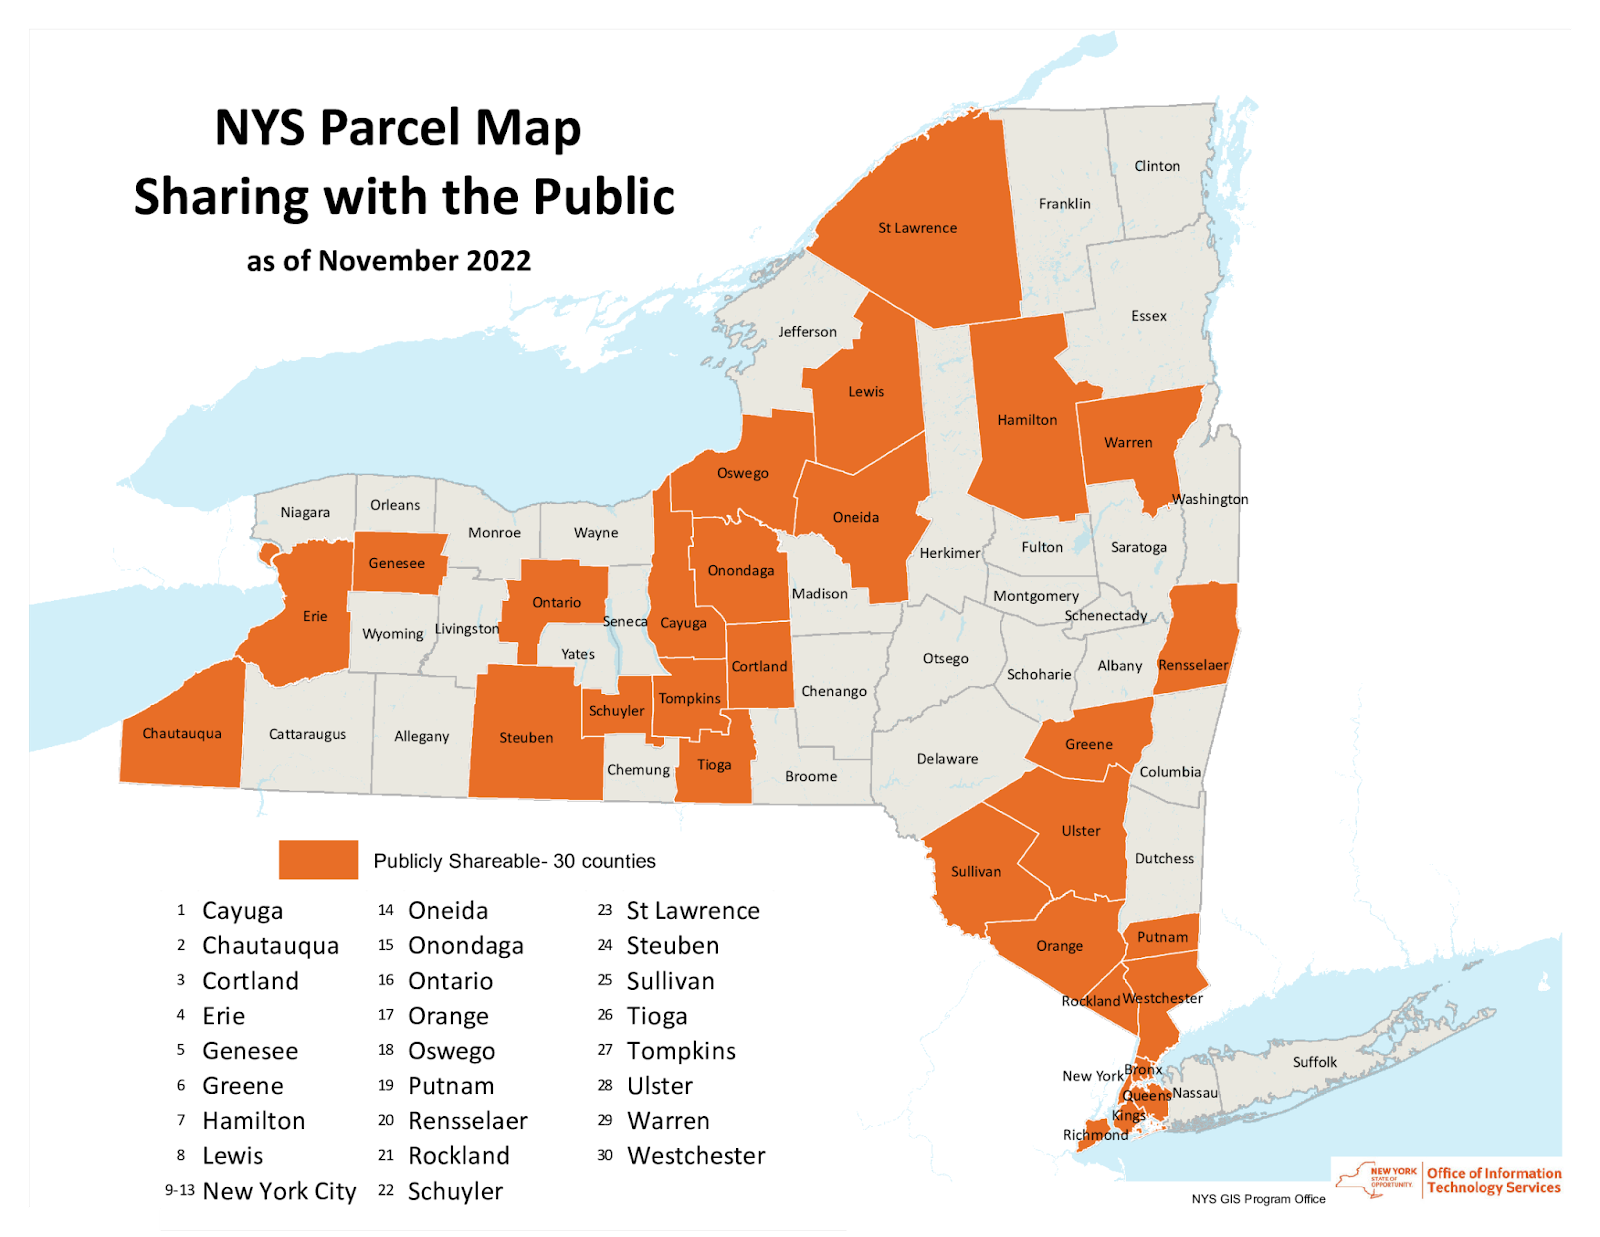
Not too long ago, I was communicating with a colleague about how some governments still, in 2023, continue to charge or license tax parcel data.  At first, somewhat amazing considering how far the Open Data movement has come over the past 10-15 years across the Empire State.  As recently as late 2022, information from the NYS GIS Program Office, which monitors the availability and sharing of tax parcel data statewide, shows that nearly 50 percent of NYS counties are making tax parcel data available for free through various means.  Great strides being made perhaps suggesting that one day the barriers prohibiting the sharing of parcel data across the entire will finally be nonexistent?   And that the gripes and complaints I was sharing in conversation with my colleague would go away.

Or maybe not.

Since November 2022, this map has been updated and NYS GPO now notes that half of the statewide counties currently share tax parcel data

Issue Was Discussed Early On – What Happened?

In the early days of statewide GIS development (circa 1990s) the GIS community was fortunate to have Bob Freeman, former Executive Director of the New York State Commitee on Open Government (COOG) participating in the growth of the GIS movement.    Bob seemingly recognizing and witnessing the formation of a technology which would have a tremendous impact on government records and data.  Almost knowing that as part of the new technology, digital versions of data would become just as important or even more valuable than hardcopy format.  He was involved in statewide GIS conferences and contributed in many ways.    All said and done, he was a staunch advocate of making GIS data available – largely long before the “Open Data” concept was framed.

I was only able to find a few of his opinions searching the COOG archives and ultimately reached out to the current COOG Executive Director Shoshana Bewlay to both bring to her attention of governments still charging for tax parcel data as well as to see if she, or her staff, might be interested in revisiting the issue.  I heard back promptly from  Kristin O’Neill, Assistant Director who was kind enough to send me a link to all of the COOG opinions (7) which included “GIS”.  The links to all of the GIS-related opinions are below which can either be read through in its entirety or skimmed-over.   There is a lot here some of which is better interpreted by an attorney.  7507, 11230, 13575, 14366, 15058, 15695, 19246.  Looking back, I’m not sure why I thought the issue had gone further along in the legal system and had been resolved to a more definitive degree. But these few opinions suggest otherwise.  

More than once, COOG responded to the question/issue of an individual or organization questioning the basis of a government organization either selling or licensing tax parcel data.  And in general, each time, the COOG response – or opinion – was the same noting that electronic records (digital) records are no different than hardcopy records and should be made available at the cost of duplication.  (Keeping in mind original Freedom of Information Law (FOIL) costs of duplication were originally based on hardcopy records (i.e., for example 25-cents per page) and did not/does not have specific rates for digital data duplication.  Today, staff time, tapes, etc., can be included in the charge. However, since COOG opinions are advisory in nature only in context of FOIL, the early inquiries did not result in any formal legal challenge being launched on any level against any entity with regard to the selling of tax parcel data.   Suffolk County early on became involved in litigation on licensing/copyright issues (referenced in one of the opinions) which is still in place today.  But by the late 1990s, the selling of tax parcel data was in place and had become business as usual.  It seems the geospatial community is no further along in “the challenge” to the selling or licensing of tax parcel data than we were some thirty years ago.

Continue reading

GeoSpatial Student Spotlight: Collin O’Connor

PhD Candidate/Geography                               June 2025 (Anticipated)
Department of Geography
University at Buffalo                                                                                Buffalo, NY

M.S. Epidemiology                                             May 2020
School of Public Health
Department of Epidemiology and Biostatistics
University of Albany                                                                                 Albany, NY

B.S. Biological Sciences                                    May 2018
Department of Biological Sciences
University at Albany                                                                                 Albany, NY

Research Focus

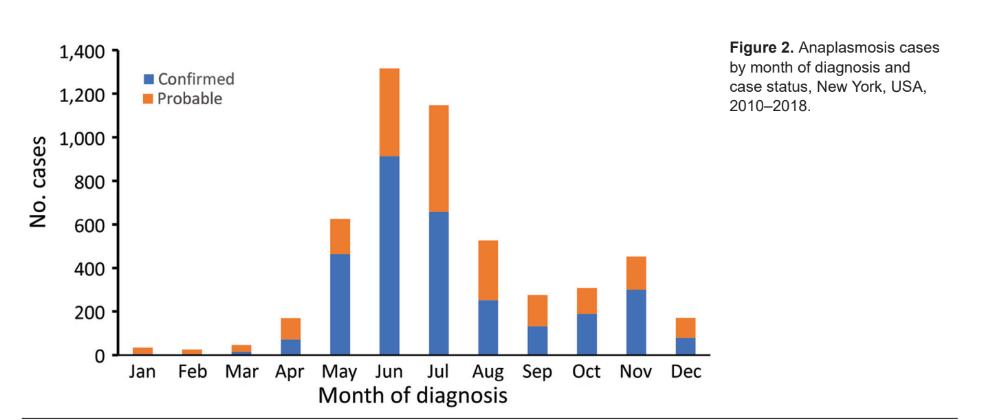
O’Connor’s doctoral research focuses on the spatial ecology and epidemiology of tick borne diseases in New York State. In particular, his dissertation work examines two genetic variants of Anaplasma phagocytophilum, the pathogen that causes anaplasmosis. Anaplasmosis is the second most frequent tick borne disease in New York State behind Lyme disease.  An August 2021 article in Medscape reported Anaplasma cases nearly quadrupled statewide from 2010 to 2018.  On a larger scale, Anaplasmosis became a nationally notifiable disease in the United States during 1999 after nationwide case counts increased significantly. Most of these infections occur in the upper midwestern and northeastern states, with eastern New York and the Hudson River Valley areas being of particular focus and concentration.

It comes as no surprise that confirmed Anaplasmosis are the highest during the summer months when people are active in the outdoors.

Background

O’Connor started his research on anaplasmosis while working on his masters degree at UAlbany with a team of other public health researchers and scientists in both academia and government. Their ongoing and collective research focuses on evaluating human risk of acquiring anaplasmosis (as well as Lyme Disease, babesiosis and other tickborne diseases) at publically accessible lands, based on measures of tick density and pathogen prevalence. Central to the investigation is looking at the relationships between human activity and environmental characteristics of specific land cover types supporting mammalian populations which serve as both transmitters and hosts of the A. phagocytophilum pathogen.

O’Connor’s research involves numerous datasets as part of his research, most notably human case data – which is analyzed at the ZIP Code Tabulation Area (ZCTA) level –  as reported to the New York State Department of Health (NYSDOH). Data is aggregated by NYS regions (Capital, Central, Metro, and Western) and ZCTA by using patient address and 2010 US Census population data and shapefiles.

Continue reading

Streamlining the New York City Environmental Quality (CEQR) Review Application with Geospatial Tools

Open source content and tools at the core of automating complex process

City Environmental Quality Review, or CEQR, is the process by which New York City agencies determine what effect, if any, a discretionary action they approve may have upon the environment. CEQR is a disclosure process and not an approval process in and of itself. Completion of an environmental review supports other decisions made by agencies such as approvals of rezoning or variance applications, funding, or issuance of discretionary permits. Ministerial actions, such as the issuance of a building permit, are not subject to environmental review.

Historically, CEQR, along with other government environmental review programs such as the New York State Environmental Quality Review Act (SEQRA) and the National Environmental Protection Act (NEPA) have been the subject of much debate – right or wrong – with regard to being overwhelming, complicated, and costly to those individuals and/or organizations involved in projects or “actions” which trigger the application process.

CEQR is precursor to ULURP (Uniform Land Use Review Procedure), which, in part, is the approval process that decides the fate of the action.  ULURP cannot start until the environmental review process is complete.

Introducing AutoCEQR

In the New York CEQR space, leave it to a couple seasoned GIS folks to step in and combine  professional experience with geospatial tools and programming skills to offer a cost effective and streamlined process to work through the CEQR application.

AutoCEQR cofounder Matt Sloane has worked in the planning field since 2007, working extensively with SEQRA and CEQR.  Over that time Matt developed specialties in both GIS and Data Science.  As Matt learned to program the tools that power ESRI ArcDesktop software, he realized that many of the processes required by CEQR, which are explicitly prescribed by the CEQR Technical Manual, could be automated based on existing data (e.g., MapPLUTO) and several project-specific inputs. He approached Danny Sheehan, a close friend and former classmate at SUNY Geneseo’s planning and geography courses, about the project. Both agreed it would be a great opportunity to put their combined skills to work and build a platform to augment the CEQR application process.  Danny was able to bring geospatial development expertise and software production knowledge he learned at UBS, Carto, and Columbia University to start and evolve the project into a production application.

AutoCEQR leverages a mixture of City, State, and Federal data resources, though primarily relies on NYC Open Data.  Other data sources include:

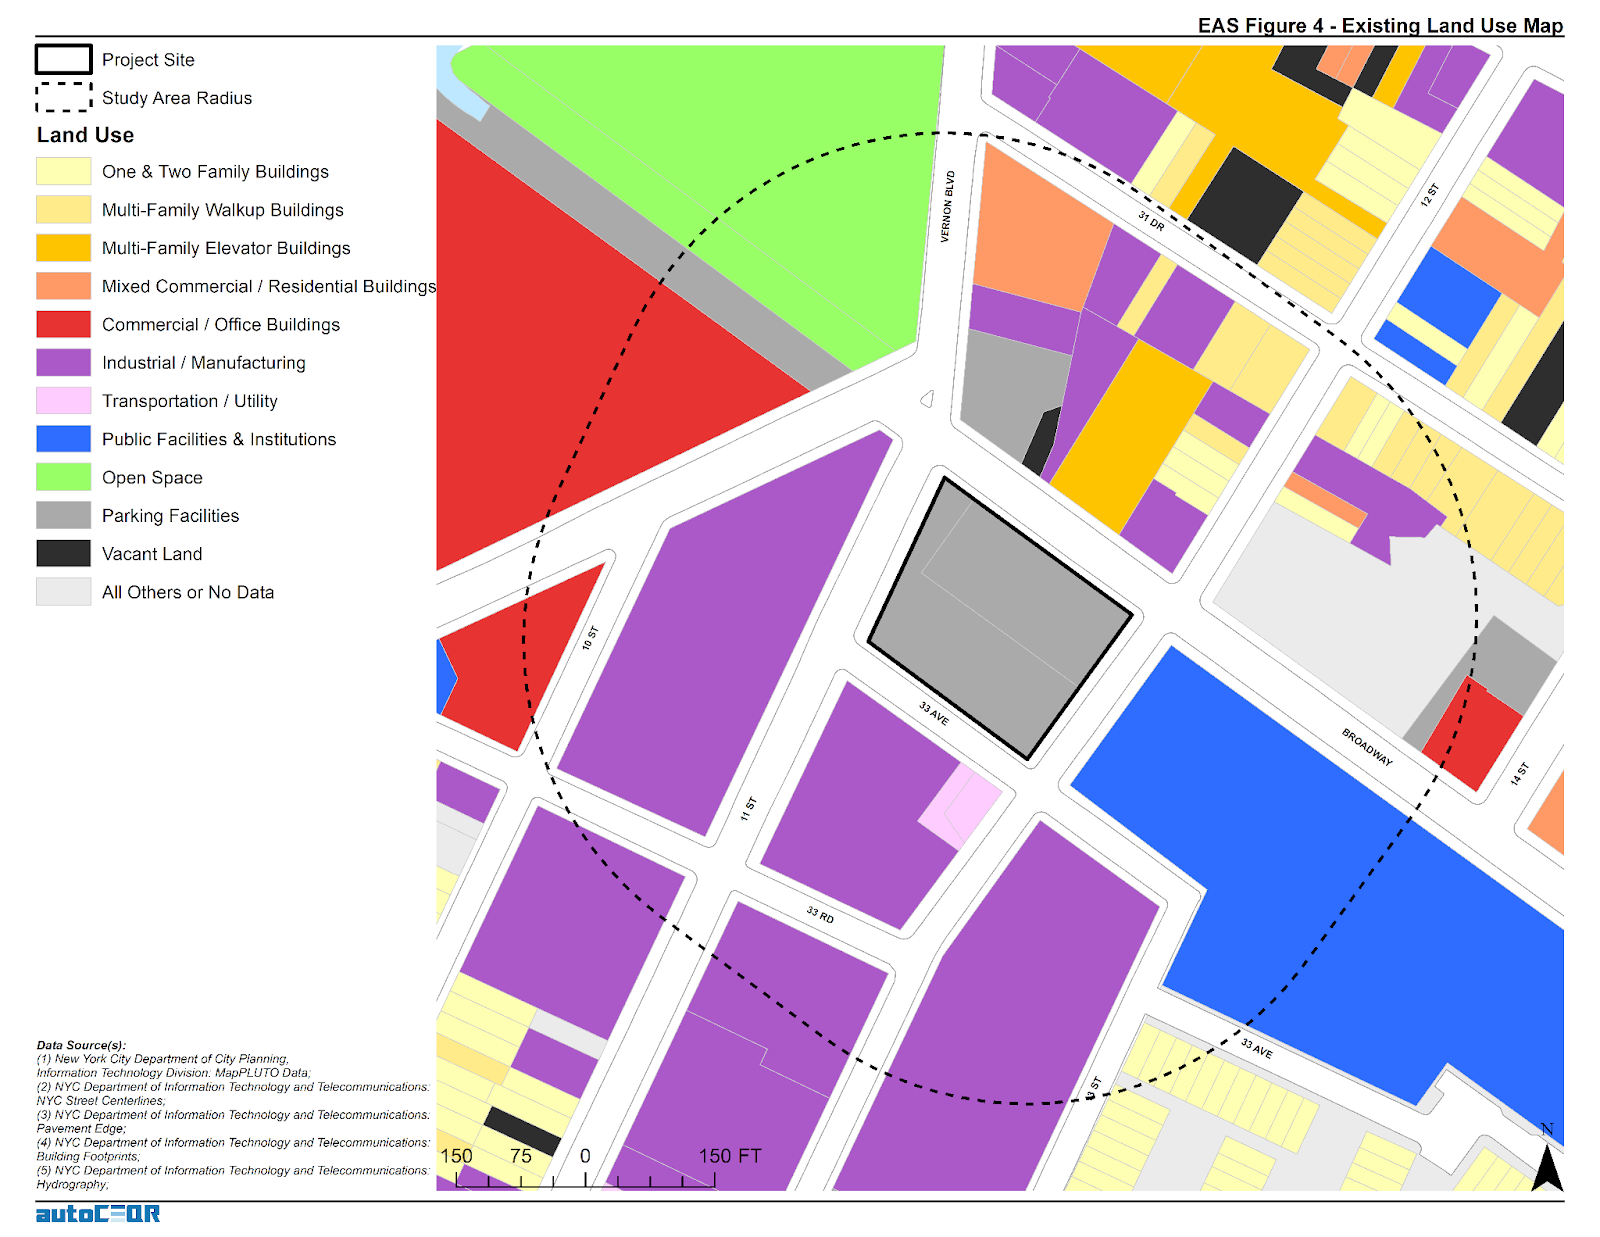
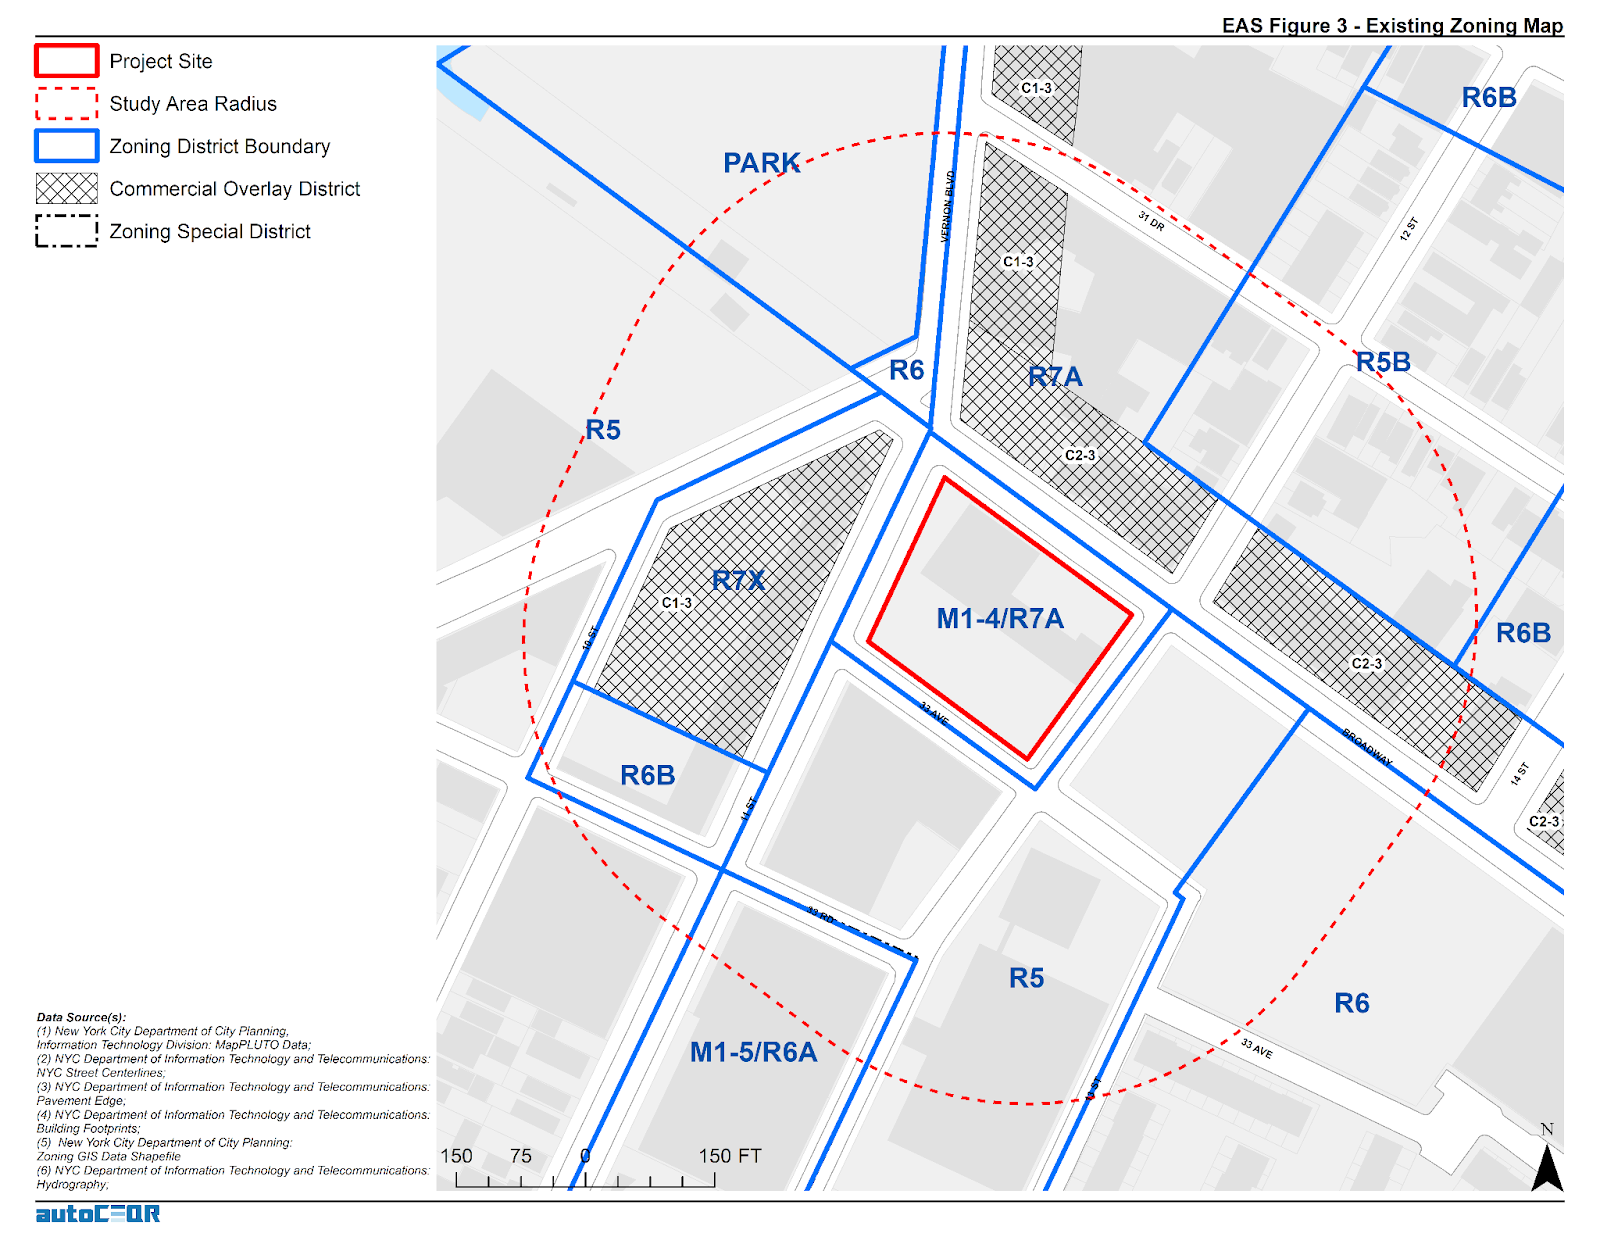
This 400’ radius buffer around a subject property which requires CEQR shows adjacent parcel land use classifications that are included in the NYC MapPluto file on a regular basis

A. Coding and Software Environments

Python is at the core of the AutoCEQR technology.  For working with data, the AutoCEQR team uses  Pandas, GeoPandas, Shapely, Fiona and ArcPy for generating Map Document files (.mxd’s), and creating custom Python classes for the workloads.  Sheehan notes “With GeoPandas and Shapely it’s phenomenal how close to parity they now are for matching ArcPy functionality.”  In the development environment, PyCharm Community Edition and GitHub are used for code development & versioning.   

AutoCEQR prototyping started with ArcPy for all tasks but it was decided to abstract the high-level functions so the geoprocessing engine could be changed to GeoPandas, the geoprocessing library of choice.  For interacting and communicating with Amazon Web Services (AWS) – the current AutoCEQR Cloud Computing Platform – developers leveraged Boto3 (AWS SDK for Python).  EC2 and S3 is leveraged in the AWS environment for computing, data storage, and distribution which has enabled to keep the application computing bill fairly low per month. In the future, it is anticipated to modify the architecture by leveraging more serverless technology and more scalable architecture for added compute cost savings.   AWS generously provided AutoCEQR with free computing credits for one year through AWS Activate – which was brought to their attention as part of their involvement and experience at the Columbia Startup Lab (CSL).  QGIS is also used to verify results and quick GIS work. 

Interacting with Census data and a whole host of services is made possible by leveraging the many great open-source libraries available on PyPl and GitHub. The storefront is the Squarespace AP which is used to process and deliver orders.

AutoCEQR still uses ArcPy mapping for generating maps, .mxd’s, and map packages but given the high cost of licensing and the technical slowdown it adds to both the production application and ongoing development speed, and it’s unclear if .mxd’s will exist in future iterations. (Both Sheehan and Sloane would like to have more feedback from users if the .mxd deliverable is necessary or if the application should generate static maps with Matplotlib and GeoPandas or if interactive web maps would be more helpful.)

The data engineering ETL process mostly consists of pulling down data with requests, unzipping files, some transformations and projecting data, and API libraries and a scheduler. We download the latest data every night – whether the source is updated daily or not. Data ETL would be a big focus to redesign to improve the platform and save on cloud storage and computing costs.

In addition to being consistent with existing property zoning classifications, projects are also reviewed in context of proximity to a myriad of other special districts and overlay zones.

B.  Application Process

Users input relevant project-specific information (e.g., dwelling units, building height, square footage, etc.) via the AutoCEQR website.  From there the application software ingests  the data and checks it against public data sources – usually with some intermediate geoprocessing steps required – and then references the analysis thresholds stated in the Environmental Assessment Form (EAS) to determine which analysis the proposed project is required to undertake as part of the CEQR environmental review. For certain quantitative calculations,  AutoCEQR has translated all of that logic into functions or classes in the codebase. Users also receive the data and maps for either a CEQR Pre-Screen or a select set of CEQR Full Analysis items. This VIMEO video provides an introduction to accessing the application and illustrates the products generated.

C.  Usage

To date, AutoCEQR has had several dozen environmental professionals targeted from a few key firms to evaluate application and then go on to use AutoCEQR in production. Currently Sheeran and Sloane are allowing users to leverage AutoCEQR freely in order to get helpful product feedback and gain traction.  With the aim of soliciting feedback for refinement, feature expansion, and product evolution,  AutoCEQR has been well received by former director of the NYCDCP Environmental Assessment Review Division, Ms. Olga Abinader.  She comments:

“AutoCEQR is an excellent application – as its title indicates, it automates tedious, time-consuming CEQR documentation that has historically taken consultants dozens of person-hours to complete.  As a longtime NYC environmental review expert and former public service leader, I appreciate that it gathers data points from the City’s publicly available databases and agency websites (MapPLUTO, NYC Parks, NYC LPC, GIS sources), and combines this information with user inputs (i.e., analysis framework details) to generate useful EAS Maps, visuals, and content/data for the EAS Forms in a short turnaround. Given the time savings it offers, I am very enthusiastic about AutoCEQR as a tool and recommend it highly to consultants, public service professionals, the general public, decision-makers and others interested in preparing or reviewing CEQR materials.” 

As the product is currently operating under a freemium model, users don’t need to currently apply the discount.  However, it is important for AutoCEQR to continue this offering to support affordable housing in NYC in the event AutoCEQR ever moves to any kind of fee-based model. 

All AutoCEQR maps included in the project delivery file as both ArcGIS Map Document files (.mxd) and Map Package files (.mpk).

D.  Affordable Housing Development Services Discount

Those working on the development of Affordable Housing or Inclusionary Housing are encouraged to contact the AutoCEQR team.  It is their aim is to provide the AutoCEQR platform and reporting deeply discounted for individuals or companies involved in these types of housing projects.  If the entire development provides 100% Affordable units, the AutoCEQR team intends to provide free reporting and analysis.*

As the product is currently operating under a freemium model, users don’t need to currently apply the discount.  However, it is important for AutoCEQR to continue this offering to support affordable housing in NYC in the event AutoCEQR ever moves to any kind of fee-based model. 

* Free reporting with minimal overhead for costs associated with report processing. 

Summary 

Development and marketing efforts on the AutoCEQR project has slowed down since both Sheehan and Sloane have started new full-time positions.  Nonetheless, both continue to explore interesting options for its future development and continued success.  Individuals and companies interested in the application and/or communicating with Sheehan and Sloane are encouraged to do so via the contact information below.

Contact:

Daniel M. Sheehan
danny@autoceqr.com

Matt Sloane
matt@autoceqr.com

Envisioning the Future of Buffalo’s East Side

AGOL viewer, data HUB, and other geospatial tools used in helping develop WITHIN East Side Plan

Community focused GIS projects are always a favorite of mine to write about.  Highlighting how geospatial tools can be used by community groups – including nonprofits which are often project sponsors – to better help visualize and understand the vast array of environmental, regulatory, business and public health, and cultural data which impacts their daily lives.  One such project located in Buffalo’s east side was brought to my attention in a recent communication with Lisa Matthies-Wiza, Director of Geographic Information Services at Erie County.  

WITHIN East Side

The WITHIN East Side project is one of many projects of LISC Western New York (WNY) and its larger parent organization LISC New York.  program.   WITHIN East Side  focuses on simplifying the neighborhood planning and community development process, and ensures development is driven by resident leaders and community groups.  As an open, inclusive, community-driven initiative, WITHIN East Side brings together neighborhood voices, trusted partners, and supportive funders in an effort to better the wellbeing of residents using their own visions. Together with LISC NY, the WITHIN East Side stakeholders collaboratively identify projects that sustain the positive momentum happening in local neighborhoods.

In early 2020, LISC NY began planning with community partners in three geographic focus areas in the East Side under the WITHIN East Side program.  The East Side of Buffalo, which is the heart of Buffalo’s Black community was chosen as it is purposeful to build upon and lift up the long-time visions of residents and community leaders in neighborhoods most impacted by historic disinvestment, environmental, structural, and systemic racism.  The additional impact of the racist mass shooting on May 14, 2022, that killed 10 people, at a local supermarket within the planning area, furthered the importance of amplifying the community’s voice and vision for the future.

The project was designed as a two-pronged approach–integrating economic development and quality-of-life planning.  Closely intertwined, both  economic development and quality-of-life planning require understanding community history and dynamics, collaboratively identifying projects, building relationships with diverse stakeholders, and turning community priorities into progress.

The WITHIN East Side project was broken into three distinct study areas – each of which was studied in more detail for a wide range of demographic, cultural and economic development issues

Background

LISC NY contracted with Prospect Hill Consulting (PHC), a local minority and women owned consulting firm which had responded to a formal Request for Proposals (RFP) which was issued in January 2021.  GIS mapping and analysis was a requirement and the LISC NY team knew GIS services were important to supporting the overall East Side project.  PHC was selected to perform elements A (GIS Mapping [including an online mapping tool request and a data HUB) and B (Scenario Planning).   While LISC NY had a vision of what the final plan might look like,  PHC was instrumental in assisting LISC NY in developing maps and visualizations used in the final plan and in community engagement sessions throughout the process.

Existing 2021 land use is just one of dozens of data layers in the WITHIN East Side AGOL viewer. The rich database consists of local, regional, state and federal datasets.

Leading geospatial development of the East Side project from PHC was Jenny Magovero, President and Co-founder. Ms. Mogavero has been working in the GIS field for 23 years covering geospatial applications in community planning and environmental sciences as well as work in data visualization and  project management.  Mogavero created all of the maps in the East Side plan using the ArcGIS client as well as for spatial analysis and modeling.  The project web map is ArcGIS Online based with the data stored in a Hub Site (to allow for data sharing) and was designed about halfway through the GIS mapping and analysis task to support the WITHIN planning process itself.

One of the many excellent graphics iWITHIN East Side report. The map on the right identities areas within the study area where supermarkets are located – a significant issue for residents with limited transportation options.

LISC NY wanted to be as transparent as possible and allow stakeholders (i.e. the community/public, organizations, etc.) to work with the data and download and use it if they needed.  To this end, the AGOL interactive map was used in community outreach and meetings early in the project and as new data came online (i.e., stakeholders requested to see additional themes) PHC continued to update the AGOL viewer. PHC designed the AGOL viewer to serve as a communication medium that allowed LISC NY to show project progress, survey the community on what themes needed to be covered and/or identify gaps, and to act as a platform to continue engagement with the community in the future. 

Economic Development issues are paramount in the study such as the role of small businesses, inflow of non-residents that work – but do not live – in the area, as well as the concentration(s) and accessibility of employment opportunities.

Data collection and development was specific to the mapping and analysis that the LISC NY team needed for the WITHIN plan itself.  As LISC NY has significant business relationships within the greater Buffalo community, they were able to collect a lot of data from local, state and NGOs. In addition, PHC collected publicly available data from the City of Buffalo, Erie County (parcels, land use, etc.), New York State  (NYSDEC, NYSDOT, etc.) and federal datasets (EPA, Census, etc.).  Additionally, PHC developed data from reports or datasets that were anecdotally described by stakeholders (like the air quality buffer, buried portions of the Scajaquada Creek, key intersections, etc.).  Project data was also obtained from utilities, Google, OpenStreetMaps, and ESRI.  

Most of the project data is made available through the LISC WNY Open Data Hub which was also designed and continues to be supported by PHC.  (Some providers did not want their data to be shared so it is only available for viewing in the application.)   

No AGOL account is necessary to access the HUB and tags help users to easily jump to specific themes of data presented in the final plan for download.

PHC used a bevy of GIS,  statistical packages, and desktop publishing software tools to generate the maps and graphics in the report including: 

  1. ArcGIS Online to collect stats for the neighborhood that were ACS 5yr census based (https://doc.arcgis.com/en/arcgis-online/analyze/enrich-layer.htm)
  2. Geospatial processing tools to buffer, clip, summarize, and run overlay analyses
  3. Spatial Analyst tools to develop walkshed layers (from points provided by Walkscore)
  4. Tableau Desktop and Excel to conduct data exploration to emphasize trends (or data insights) with graphs/visualization on  map layouts
  5. Adobe InDesign for page layouts and other graphics to be consistent with the LISC NY brand book (design guide) including colors, fonts, and logos.
  6. ESRI’s Hexagon sampling tool to visualize parcel data classes (i.e. land use, vacant parcel density, ownership) at the scale of the plan areas. 

Residential ownership type is an important variable in urban studies. Data presented in the figure above suggests there continue to be many opportunities in increasing owner occupied properties in the study area

Summary

While consulting architecture and engineering companies continue to expand their geospatial offerings to governments and regional programs in 2022, particularly in the infrastructure and public works space, planning firms such as PHC serve in a unique space focusing on efforts which include applying geospatial tools as part of important community-based projects which often include significant public input and involvement.  Tools such as AGOL provide a great  framework in which to engage the public with regard to adding and removing data content and visualizing potential scenario outcomes.  A particularly useful tool given the enormity of the data used in the WITHIN East Side plan.

Reflecting on PHC’s involvement in the study, Jenny Mogavero notes:

“LISC NY is an integral part of, and key economic engine within the Western New York region.  Prospect Hill was honored to partner with the LISC NY to use GIS data, visualization tools and spatial analysis methods to not only present the existing conditions of our city’s East Side neighborhoods, but also reveal the deeper insights that occur when we overlap data-driven stories across multiple thematic lanes.  We were thrilled that our work supported the teams’ consensus building goals to develop a vision of a prosperous future for an important part of our City.”

Tyra Johnson Hux, WNY Director of Operations, also reflects on PHC’s work and the use of geospatial tools in the project adding:

“WITHIN East Side amplifies the visions of residents and community leaders in neighborhoods impacted by historic disinvestment, environmental, structural, & systemic racism. Showing their stories through, not only their own words, but also data was critical to helping our stakeholders generate a bold, authentic and comprehensive vision with an emphasis on implementation.  PHC supported the WITHIN East Side Plan by working with the project team to identify, collect and normalize relevant GIS data from neighborhood, government, academic and other partners. Additionally, they worked with us to analyze and visualize the community experience through maps and infographics.  The online interactive map and data warehouse they developed made it possible to share data in a way that breaks down silos, facilitate  strategic planning and continue community conversations.”

Contact

Jenny Mogavero, GISP
Prospect Hill Consulting LLC | Principal
716.432.9053 | www.prospecthill.co
jmogavero@prospecthill.co

Lashay Young, Director
External Affairs for LISC NY
https://www.lisc.org/
LYoung@lisc.org