March 2023: Tax Parcel Data Sharing in New York State

Half of New York’s Counties now make parcel data available for free through Open Data efforts though barriers in specific governments still need to be overcome before statewide data is available

Not too long ago, I was communicating with a colleague about how some governments still, in 2023, continue to charge or license tax parcel data.  At first, somewhat amazing considering how far the Open Data movement has come over the past 10-15 years across the Empire State.  As recently as late 2022, information from the NYS GIS Program Office, which monitors the availability and sharing of tax parcel data statewide, shows that nearly 50 percent of NYS counties are making tax parcel data available for free through various means.  Great strides being made perhaps suggesting that one day the barriers prohibiting the sharing of parcel data across the entire will finally be nonexistent?   And that the gripes and complaints I was sharing in conversation with my colleague would go away.

Or maybe not.
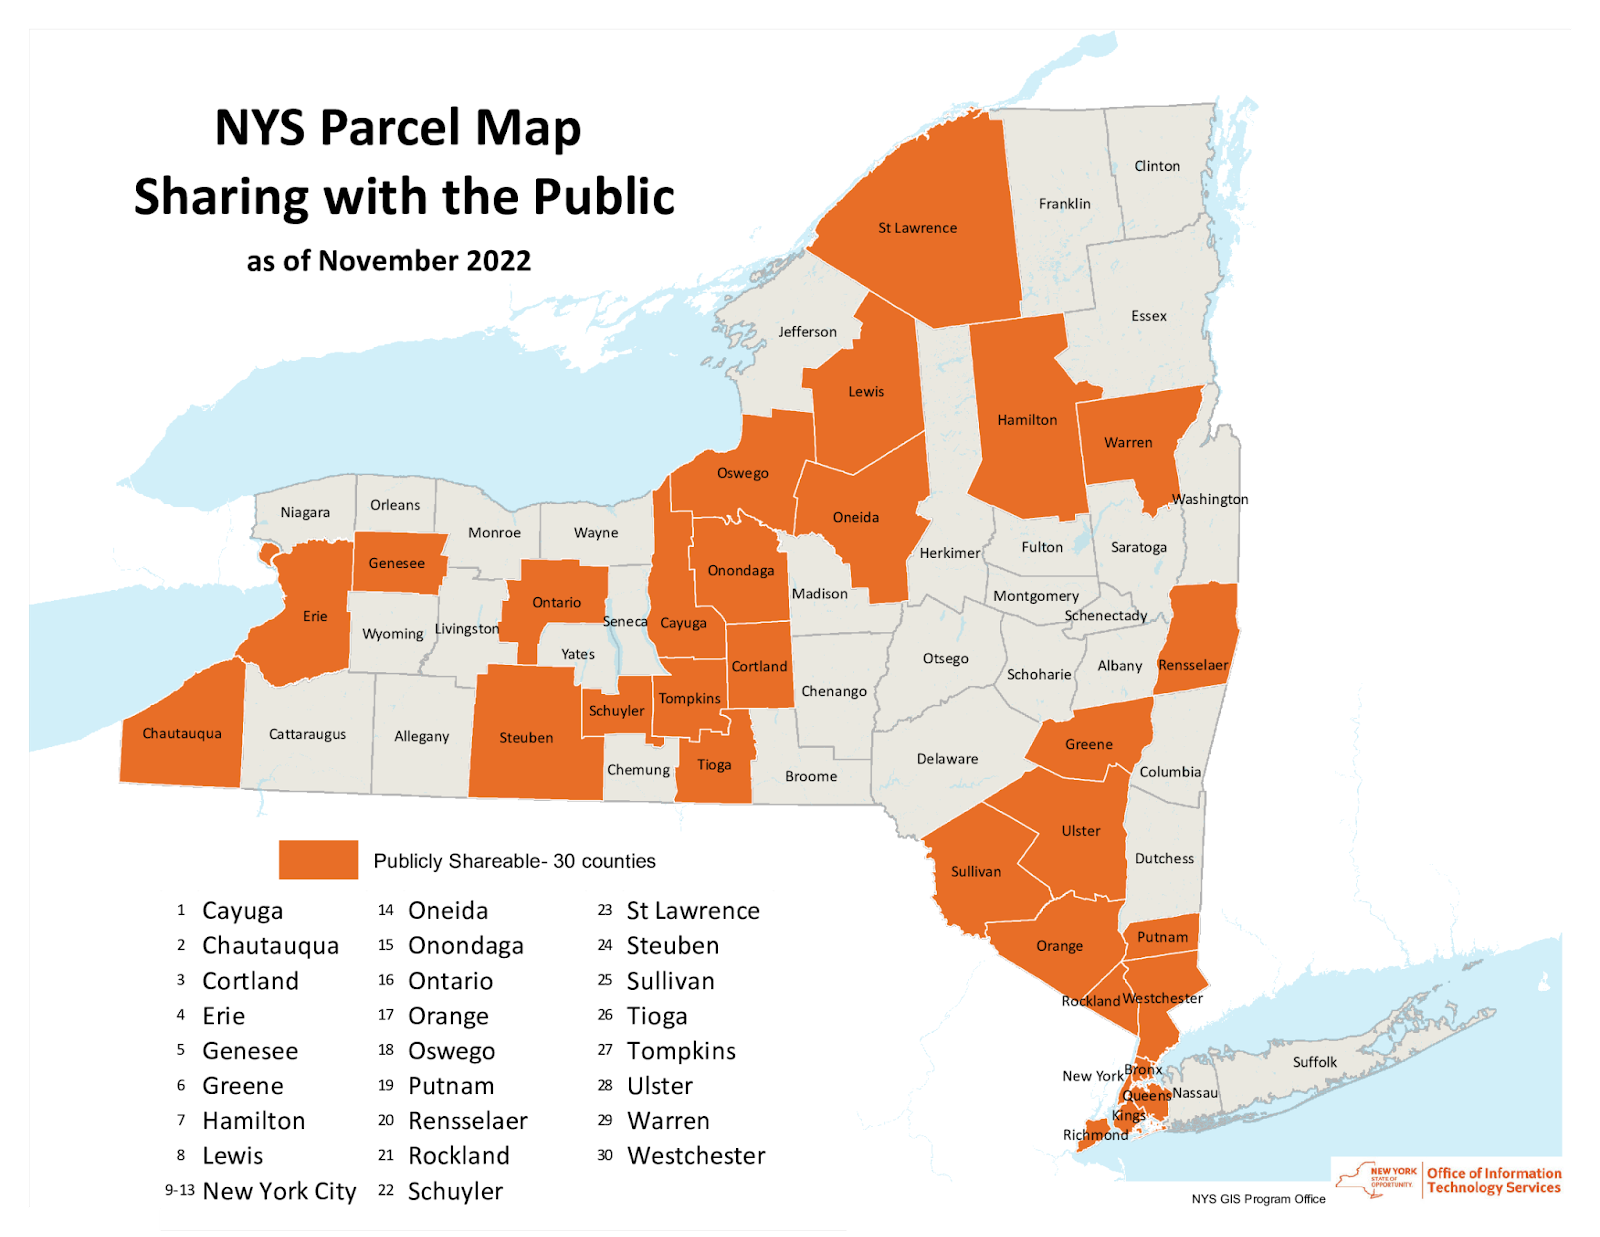
Since November 2022, this map has been updated and NYS GPO now notes that half of the statewide counties currently share tax parcel data

Issue Was Discussed Early On – What Happened?

In the early days of statewide GIS development (circa 1990s) the GIS community was fortunate to have Bob Freeman, former Executive Director of the New York State Commitee on Open Government (COOG) participating in the growth of the GIS movement.    Bob seemingly recognizing and witnessing the formation of a technology which would have a tremendous impact on government records and data.  Almost knowing that as part of the new technology, digital versions of data would become just as important or even more valuable than hardcopy format.  He was involved in statewide GIS conferences and contributed in many ways.    All said and done, he was a staunch advocate of making GIS data available – largely long before the “Open Data” concept was framed.

I was only able to find a few of his opinions searching the COOG archives and ultimately reached out to the current COOG Executive Director Shoshana Bewlay to both bring to her attention of governments still charging for tax parcel data as well as to see if she, or her staff, might be interested in revisiting the issue.  I heard back promptly from  Kristin O’Neill, Assistant Director who was kind enough to send me a link to all of the COOG opinions (7) which included “GIS”.  The links to all of the GIS-related opinions are below which can either be read through in its entirety or skimmed-over.   There is a lot here some of which is better interpreted by an attorney.  7507, 11230, 13575, 14366, 15058, 15695, 19246.  Looking back, I’m not sure why I thought the issue had gone further along in the legal system and had been resolved to a more definitive degree. But these few opinions suggest otherwise.  

More than once, COOG responded to the question/issue of an individual or organization questioning the basis of a government organization either selling or licensing tax parcel data.  And in general, each time, the COOG response – or opinion – was the same noting that electronic records (digital) records are no different than hardcopy records and should be made available at the cost of duplication.  (Keeping in mind original Freedom of Information Law (FOIL) costs of duplication were originally based on hardcopy records (i.e., for example 25-cents per page) and did not/does not have specific rates for digital data duplication.  Today, staff time, tapes, etc., can be included in the charge. However, since COOG opinions are advisory in nature only in context of FOIL, the early inquiries did not result in any formal legal challenge being launched on any level against any entity with regard to the selling of tax parcel data.   Suffolk County early on became involved in litigation on licensing/copyright issues (referenced in one of the opinions) which is still in place today.  But by the late 1990s, the selling of tax parcel data was in place and had become business as usual.  It seems the geospatial community is no further along in “the challenge” to the selling or licensing of tax parcel data than we were some thirty years ago.

Continue reading

Hub2Hub: Sharing and Promoting the Geospatial Message

Publishing spatial data content has proven to be great outreach in terms of providing transparency and exposure for many government GIS programs – including here at Westchester County.  Increasingly much easier for geospatial organizations to do courtesy of powerful server technology allowing these same agencies to easily spin together data services based on common thematic features such as environmental, planimetric, business, demographics, cultural, parcels, and aerial photography to name only a few.  Though the data service environment is better understood and leveraged by a specific user community knowing what type of spatial content to look for, there remains even a larger community of geospatial users which navigate data portals to download just individual data sets.  Looking for that individual shapefile, KML, or .dwg file for their own individual project.

And even with all of this good geospatial content available, many publishing organizations – particularly government – struggle with building educational outreach programs for the larger GIS user community.  Tailored programs for users in community and advocacy groups, nonprofits, and even the business sector instructing how to effectively use and leverage our data.  Government GIS programs often do not have the resources or the business model to deliver these types of services outside of their organization.

Enter the emerging roll of “service” Hubs which specialize in leveraging government open data  in ways government programs normally cannot offer. Some are nonprofit in nature or affiliated with academic institutions.  Others, like OpenHub based in the lower Hudson Valley, is a for-profit venture.  The common theme among them is a window offering a wide range of engaging programs increasingly based on government data sets featuring hackathons, workshops and training programs,  application tools, and offering  business tech “round table-type” discussions.  While open source software such as OpenStreetMap, QGIS, Python, and R are commonly used to support their missions (and thus, the easy and affordable entry point for new users), one can see the use of ArcGIS Online and CARTO being offered as well.  Effectively expanding the use and understanding of geospatial concepts and bringing technology to the people.

Third Party “Hubs”

I’ve referenced and written before on the great work of BetaNYC serving in this space.  Particularly with regard to extending content of NYC OpenData  through their numerous programs including the flagship NYC School of Data conference.  While New York City does an incredible job in promoting and maintaining city government’s open data catalog itself, BetaNYC extends the effort by building an entire framework of putting the data into the hands of residents on the streets.

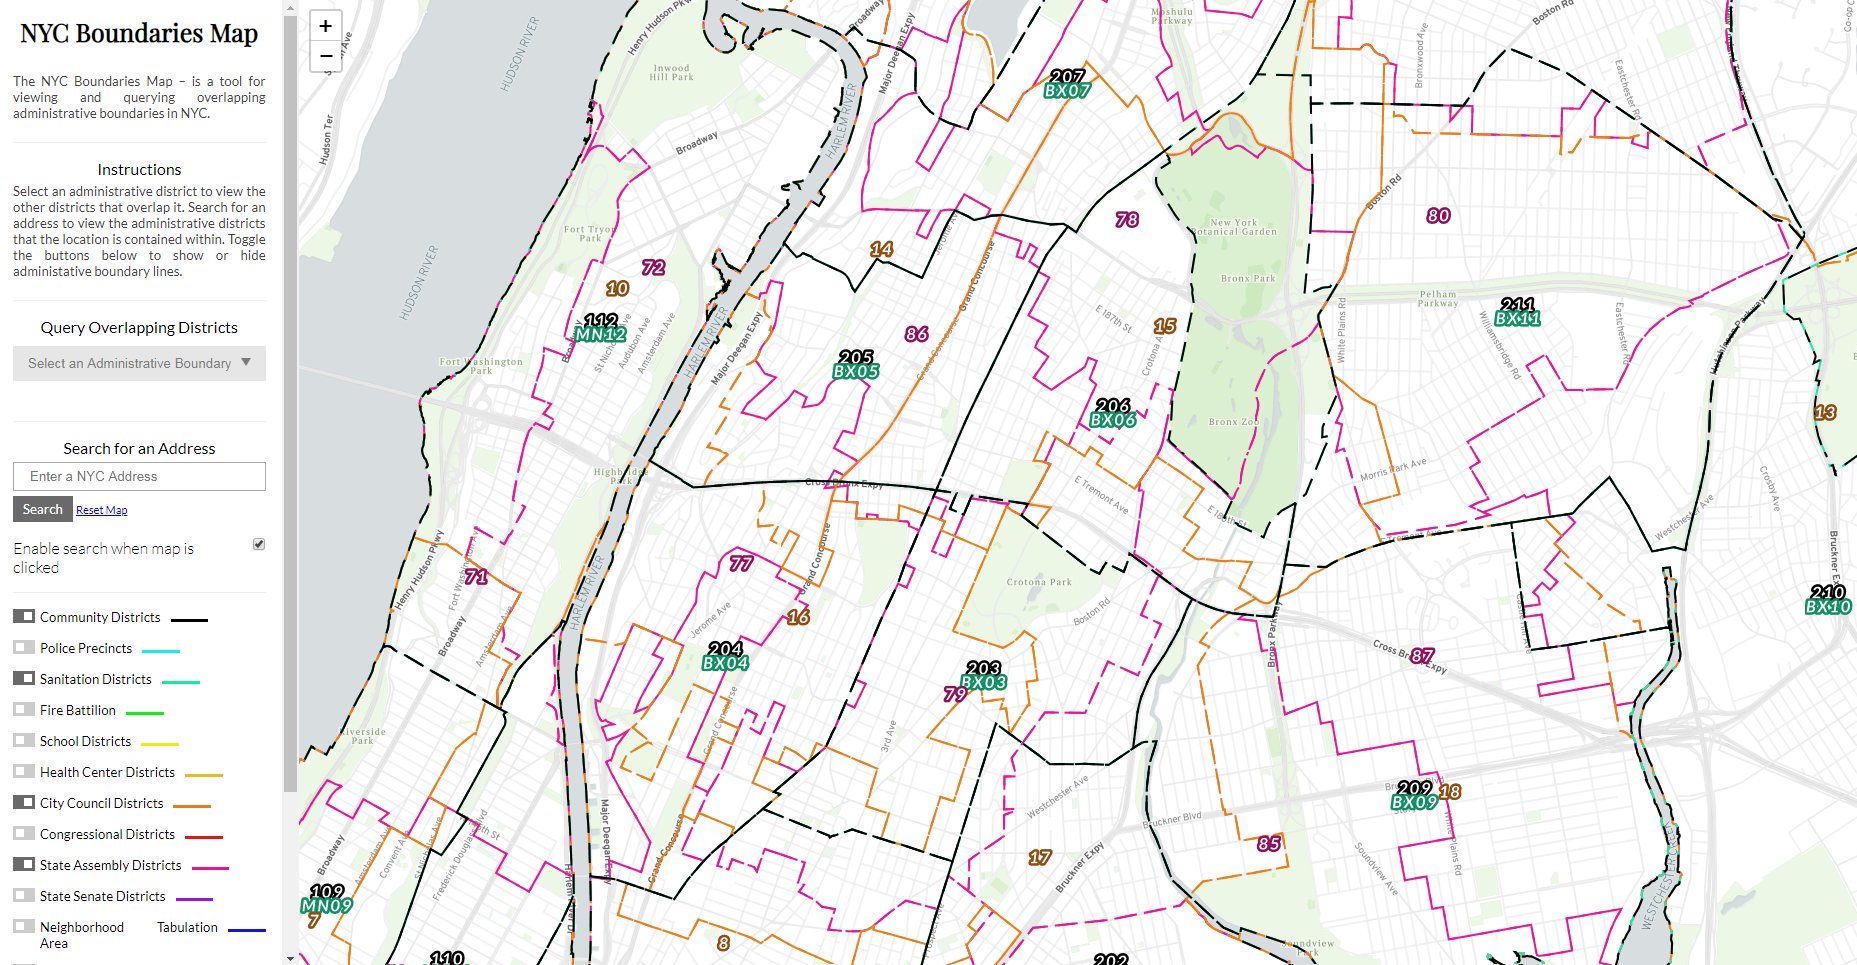
This BetaNYC viewing applications enables user to navigate the numerous political, administrative, and operational districts across New York City

Early in this space in the metro NYC area was the work of Steve Romalewski who started providing mapping services to the nonprofit sector as part of the Community Mapping Assistance Project (CMAP) which at the time was affiliated with New York Public Interest Research Group (NYPIRG).  Since 2006 he has been affiliated with the CUNY Mapping Service as part of the Center for Urban Research, Graduate Center at City University of New York (CUNY).

The Long Island Index was an early and very visible project that the CUNY Mapping helped create.  Another effort affiliated with the Center is the NYC Labor Market Information Service uses federal business and labor data sets.  Be sure to check out their Career Maps infographics and reports.  Similar academic efforts in the city exist at the Spatial Analysis and Visualization Initiative (SAVI) at Pratt Institute and the Center for Spatial Research at Columbia University.

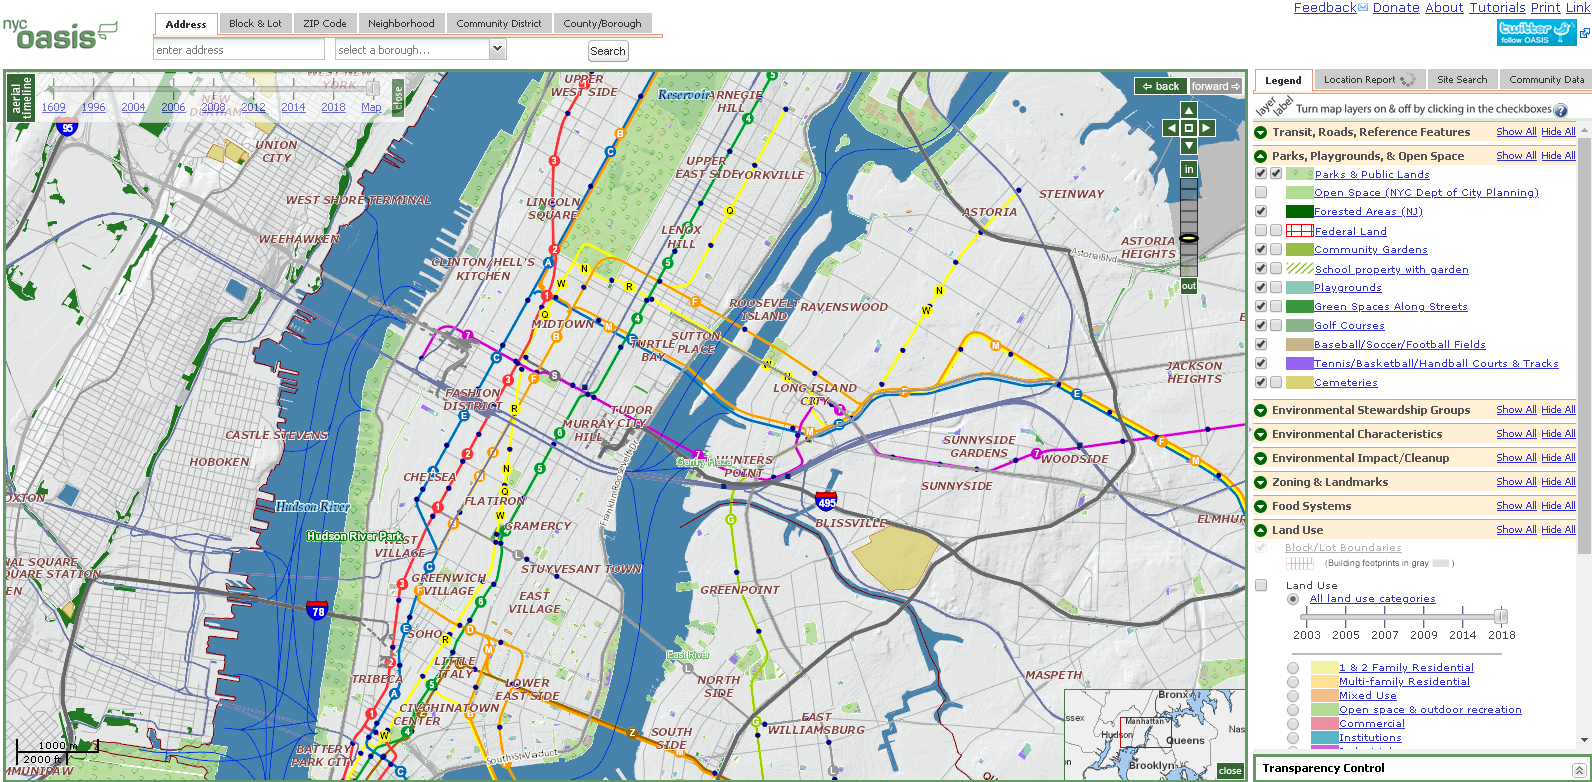
Though originally developed at CMAP, the CUNY Mapping Service now hosts OASIS which is one of the most comprehensive mapping and viewing application covering the New York City footprint. Dozens of government generated datasets are made available in the viewer.

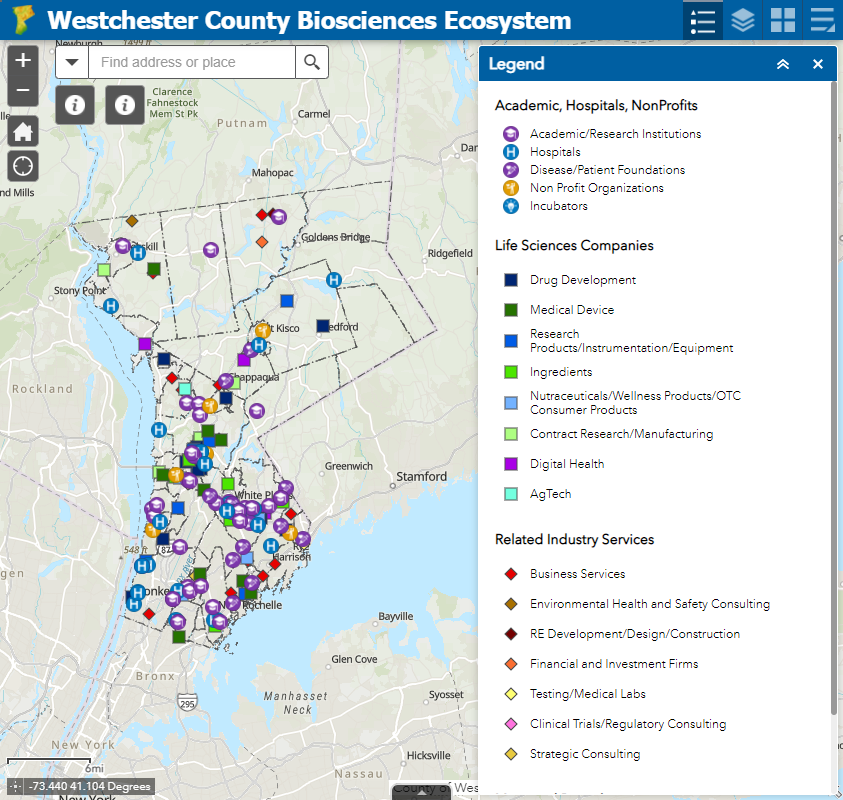
While the OpenHub is only beginning to jump into the geospatial space, its Founder Yulia Ovchinnikova will be highlighting the Westchester County GeoHub as part of the 2021 HV TechFest Conference as an example of open government and open-source data sharing to promote building communities. OpenHub will also be using content from the county’s GeoHub as part of a course project during a current online Data Analytics Bootcamp.  As regional technology and economic development is an important focus to OpenHub’s mission and purpose, our discussion started by focusing on a new web map being published which highlights the emerging BioSciences Ecosystem community in Westchester County.  The County is home to the largest biosciences cluster in New York State, boasting 8,000 jobs and 20 percent of the State’s total biosciences employment. The cluster comprises academic institutes doing basic research, R&D and clinical stage startups, large manufacturers and supply chain participants. OpenHub offers a mixture of both free and fee-based online programs including coding clubs, meetups, programming, and specific events for small businesses and startups. OpenHub is an open ecosystem resource center committed to building a tech-sector in the Hudson Valley and beyond

Government open data and economic development. BioScience business location X,Ys are available for download via ArcGIS Online.

MANY organizations leverage government generated geospatial data to support their own business needs and/or to champion a host of civic needs and issues.  In just one area, such as environmental justice (EJ), a Google search located a document published by the SeaGrant program at SUNY Stony Brook which identifies the numerous individual agencies (largely government and nonprofit) engaged in providing “Environmental Justice Mapping Tools for New York State Communities”.   Child care, social services, public safety, public transportation, sustainability, climate change, and civic issues only scratch the surface of the spaces where advocacy groups are involved in using government geospatial content for the larger public good.

Summary

What differentiates the groups itemized above are that they are more full service, a la carte organizations offering a wider range of products and services.  Staffing and resources to turn government data content into meaningful deliverables such as workshops (online and in-person), hackathon-type events, community events,  training courses, and even bringing the data to civic leaders and administrators in ways which is simply not possible by government publishing agencies.  Such outreach is often very targeted making the data more meaningful and ending up in the hands of those who understand its content the most.  Viewing and using the data at the “micro” as opposed to the “macro” or a larger geographic footprint.  Local is better.

While technically not all “hubs” in name, these groups continue to illustrate the growing benefit of how organizations are adding value and exposure to the government data assets.  In many scenarios, building partnerships with these types of service organizations can be of great value to government publishing agencies.


COVID Era Geospatial Applications to Support Empire State Communities

Here in southeastern New York State, it’s amazing how fast the COVID wave came and went. At first, mid-March to mid-May seemed like an eternity, but now, not so much.  I likened the preparation for COVID to preparing for Super Storm Sandy.  Albeit phenomenally different, the buildup and the anxiety of waiting for it to show up.  Peering out the windows to see the outcome of a completely different kind of damage and suffering  altogether.  Physical and psychological.  Now July, it seems and feels like we can see the first wave of the pandemic in the rear view mirror.  But then as we refocus on the road in front of us, we know there are speed bumps ahead of us.  Not if, but when.

There were a plethora of interesting and meaningful geospatial viewers created across the state during the mid-March to mid-May time frame.  Most included highlighting COVID case numbers by larger units of geography (municipal or zip code boundaries),  generalized heat or pattern maps, impacts to businesses and institutions, as well as  information on hotlines and sources of assistance.  However, its pretty well documented the geospatial community across the state has struggled with being part of providing detailed spatial analysis or mapping support functions at the address level.   Or for that matter, even being asked to participate in this regard.

Personal health related data is uber protected with its use regulated and governed by the Health Insurance Portability and Accountability Act (HIPPA).  HIPPA  regulations reign supreme and contributed to a lesser involvement of GIS analysts in  providing geospatial content, metrics and analytics during the pandemic.  There is also the unspoken reluctance on the part of the public health community to release data sets  which might be difficult to understand or easily misinterpreted by the general public.  Department of Health  professionals often cautious to release data – particularly in new instances such as the COVID pandemic – and leaving analysis/interpretation  to internal professional staff only.  Ultimately though,  releasing some flavor of the data but in a more generalized context.

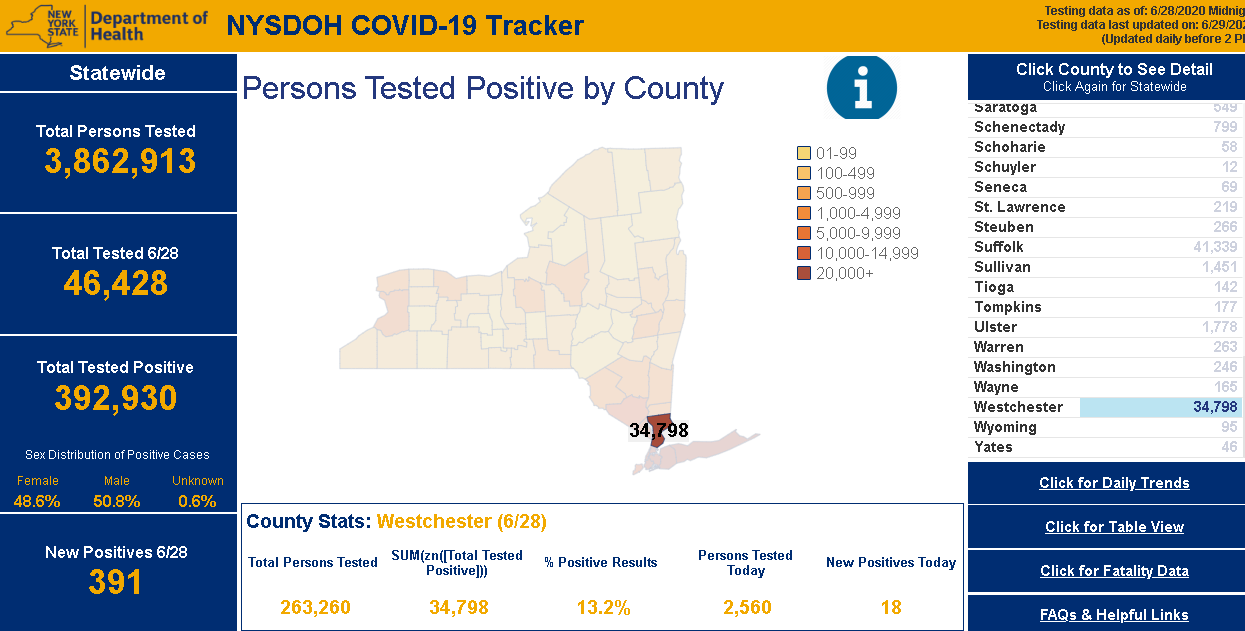
NYS Department of Health (DOH)  COVID-19 reporting has improved dramatically since the pandemic appeared in March.  Though while numbers  are made available only on a county basis, users can access and visualize the data in a variety of ways.  Reporting and posting of the data has become much more timely.  DOH is also now publishing a regional “Early Warning Monitoring Dashboard“.

Continue reading

The Art of Geospatial Collaboration: Allegany State Park Interactive Viewer

Cattaraugus County and Allegany State Park Share Resources and Vision

While GIS as a shared service as part of Governor Cuomo’s County-Wide Shared Services Initiative (CWSSI) has yet to take hold in a broad context across local governments in the  Empire State,  the statewide GIS community does have a great example to highlight how local governments can collaborate with a state agency in sharing geospatial technology.  Case in point:   The Allegany State Park Interactive Map viewer.

Located in Cattaraugus County in western New York abutting the Pennsylvania state line and  north of the Allegheny National Forest, Allegany State Park was created in 1921 and encompasses nearly 64,800 acres.   A major western New York State tourist attraction – the park averages  1.5 million annually – the park offers a wide range of four-reason recreation activities and lies within the Alleghany Highlands Forests ecoregion.   The idea of a joint effort between  Cattaraugus County and Allegany State Park online map viewer idea goes back as far as 2010 as part of a discussion between Daniel T.  Martonis, who at the time was GIS Manager for the County and Tom Livak who was then Director of Economic Development, Planning & Tourism.

The initial viewer was more emergency services focused with the collection of infrastructure data and intended for use by park staff only – nothing external.  Most of the data was collected by Dan and Tom, including Chris Holewinski – the current Cattaraugus GIS Manager – using various Trimble GPS units as well as utilizing old engineering maps.  The trio even brought out metal detectors to pick up the locations of pipes.   At the time, Dan was building web mapping applications with ArcIMS that Dan mentions was not “people friendly” and was ultimately discontinued by ESRI.  Along the way, though, both Dan and Tom knew they were beginning to frame a web mapping product which would be of great value to both the County and ASP.  ArcGIS Online began to emerge as a more functional and adaptable web mapping platform providing additional opportunities for the two government programs to build upon what had been started.

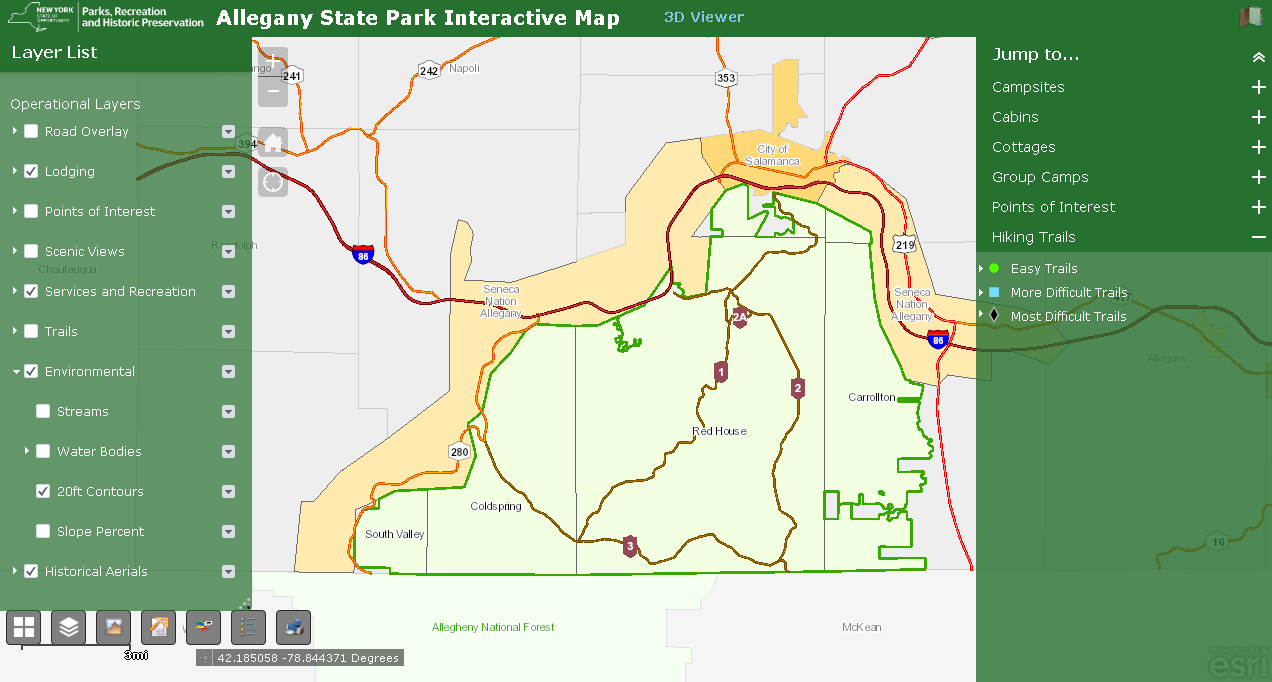
The ASP viewer represents the ongoing collaboration between Cattaraugus County and Allegany State Park. It provides easy to use access to a facility, environmental, and cultural data including historic aerial photography.

Continue reading

10 Questions: Rochelle Harris, President, New York State Assessors Association

Rochelle Harris, IAO, is the current President of the 900-member New York State Assessors Association which represents government assessors and industry representatives across the Empire State.  She currently serves as an assessor in both Madison and Chenango Counties.

eSpatiallyNewYork: You work in both Madison (Hamilton) and Chenango (Sherburne and North Norwich) Counties.  When did you begin to see computer mapping and technology changes in your offices?
 Harris:  I began to notice changes in 2009 – particularly in Chenango County – when a new County Real Property Tax Director was hired.  It was the first time that we were able to overlay aerial photography on top of the digital tax maps.

eSpatiallyNewYork: New York State Assessment Community Enterprise System (ACES) looks like a big deal – aka RPSV5.  How is this program moving along and the discussion within the Association?

Harris:  We are waiting for direction and an updated timetable from ORPTS.  There are also many pilot counties and municipalities which provide updates on progress and any issues. We will be holding training classes when the time comes.

eSpatiallyNewYork:  Do you feel there would be a benefit for more “GIS/computer mapping” training for the statewide assessor community?  Could better engagement with the GIS community improve this in anyway?

Harris: More education can never be a bad thing. Absolutely anything we can do to work together with another agency or organization makes all our lives more efficient. Our current training opportunities can be found on our website which is updated often.

eSpatiallyNewYork: Are you familiar with the New York State GIS Association?

 Harris: I actually am.  Keith Ducette, who is a GIS Technician with Onondaga County, introduced me to the organization and its programs.

eSpatiallyNewYork: Does the Assessors’ Association have anything like a GIS Work Group or GIS Committee?

Harris:  Currently, we do not, but if there is ever an overhaul or a reason to have one, we can create a special committee, or ask for volunteers for temporary projects such as ACES.

eSpatiallyNewYork: Has the Association ever approached the State to support/fund statewide capture of oblique (i.e., Pictometry/Eagleview) imagery?

Harris: No we have not, although it’s a great idea. There is a state senator trying to pass legislation for a cycle bill in which she suggests updating imagery and access to it.  We currently have access to oblique imagery in both Chenango and Madison Counties.

eSpatiallyNewYork:  With regard to data sharing – the conflict of “giving” digital assessment/tax parcel data away vs. “selling it” continues.  A mix across the state.   Does the Association have a position on this?

Harris:  My personal position, I have no problem giving the information for personal use but anyone who wants it for commercial and financial gain should pay for it.  We as an association do not have a position on this.  Chenango County offers a subscription service for the data while Madison County sells tax parcel data in file format.

eSpatiallyNewYork:  Do you anticipate any RPSV5 or any mapping items to be part of the Association’s 2019 Legislative Agenda? Revisions to 9NYCRR Part 189?

Harris:  We are working on our agenda and so far nothing on either issue though revising Part 189 would be a great idea.  The maps are cumbersome and in all three of my offices I am running out of places to store them.  I could mention this to our legislative chair and see if it is something we may be able to add to the agenda or suggest to one of the Senators we work with.

eSpatiallyNewYork: How are assessor’s “automating” in-field assessment work? What are some of the new technology tools?

Harris: I think when we get ACES  there will be much more opportunity to work with the program in the field as it will be mobile friendly and able to incorporate oblique imagery.  There are also digital tools to measure and draw new construction.  I know quite a few Assessor who solely use pictometry and the measuring tool on there.

eSpatiallyNewYork:  I see that you reference Josette Polzella on the President’s Page.  She was an early and vocal advocate of GIS in Westchester County going back to the late 1990s.     Tell me about your relationship with her.

Harris: Josette, was one of my very first mentors.  She was a wonderful person always willing to help and go the extra mile to help. We moved away from the Hudson Valley in 1988 and we lost touch.  We found each other on Facebook in around 2009 or so and picked right up where we left off. She sponsored me to take the IAO exam in 2010 and was there when I was installed – it meant the world to me. The world is a lot less bright without her in it.


Views on the 2018 New York State Geospatial Landscape

There’s probably enough below for a couple blog posts but I ended up throwing everything in together and stirring it up – so to speak.  The language on Part 189 (tax mapping) could be a post by itself.  Kind of all over the place, even revisiting some topics I’ve touched on before as part of eSpatiallyNewYork.  Part wish list and part commentary.  Ten items. More or less.

  1. Promoting NYS Local and Regional Government GIS Development:  This is a frequent mantra of mine and with the  constant advancements in computing and geospatial technologies it’s worth considering on a regular basis.   And most certainly as part of this year’s wish list. Opportunities abound across the Empire State to help local and regional governments  jumpstart and/or solidify their GIS program.   For example, funding is available through the NYS Environmental Facilities Corporation focusing on infrastructure systems much of which is managed at the local level.  Or the large amounts of funding being made available as part of Zombie Remediation and Prevention Initiative through the NYS Office of the Attorney Genera  And the detailed inter-government discussions on the new Shared Services Initiative  which includes funding as part of the adopted FY2018 state budget.  GIS is the shared services technology. And regional GIS programs as part of the New York State Regional Economic Development Councils or by extension the New York State Economic Development Council?   GIS tools are at the foundation of economic development.   Not perfect fits,  but funding opportunities do exist in these program areas.

At the core of local and regional GIS programs is powerful server technology (local and hosted) that not only has the capabilities to support multi-government day-to-day business functions  but also provides the framework to publish geospatial content via map services.  Call it what you want Open Data, government transparency, or data sharing  but it is within this context that state agencies, nonprofits, academia, as well as  business and industry all have access to local data.  Let’s have 2018 statewide focused discussions on extending local and regional GIS capacity based on cost effective and server-based multi-government initiatives.

  1. Building GIS Association Legislative Capacity: While the Association has grown in so many positive ways over the past decade, the challenge continues for the organization to have its presence and mission heard in Albany’s governing hallways.  It is no small effort – organizationally and financially  to build this capacity.  Many similar professional organizations have full-time staff and Executive Directors whose job is to create awareness among elected officials, secure funding, and promote/influence legislation on behalf of the membership.    But currently the Association’s legislative efforts are in the hands of member volunteers.  And while Legislative Committee volunteers were able to coordinate a “Map Day” last May in Albany to introduce the Association to elected officials, the Association has yet to establish itself on the same playing field of recognition with other statewide geospatial heavyweights such as the New York State Society of Professional Engineering, New York State E911 Coordinators, and the lobbying efforts of large New York State based geospatial businesses.  Complicating the equation are Association members who hold licenses or certifications in other professions (i.e, engineering, surveying, photogrammetry, landscape architecture, AICP,  etc) and find themselves in a quandary as to support the Association’s agenda or the profession/discipline which holds their license.  To some degree, this issue manifest itself as part of the discussion with the Geospatial Data Act of 2017 which initially had lines of support drawn heavily along professional affiliation.  The Association must keep up the good effort and find a way to compete on the Albany stage.  Let’s hope the Legislative Committee can build upon its 2017 accomplishments and make further inroads in 2018.
  1. New York State Geospatial Data Act of 2018:   Not really,  but it DOES sounds great – right?   Close our eyes and make believe there is a state-equivalent of the much hyped (Albany) federal National Geospatial Data Act (NGDA) of 2017.   Just think of it:   A process across the Empire State in place to magically aggregate our local government tax-payer funded geospatial data assets into National Spatial Data Infrastructure (NSDI).  Newly appointed and designated state agencies responsible for providing support (similar to the designated federal agencies)  to make our geospatial contributions consistent with the federal data themes and standards as outlined in Section 6 and 7 of the proposed NGDA legislation.  Ultimately being made available via the GeoPlatformContinue reading

10 Questions: Steve Romalewski

Steven Romalewski is currently director of the Mapping Service at the Center for Urban Research at The Graduate Center / CUNY.  During his 32-year career he has helped hundreds of nonprofit groups across the country leverage the power of GIS; helped develop more than two-dozen online mapping services analyzing environmental issues, social services, transit routing, demographic trends, voting behavior, and legislative representation.  He has also coordinated the work of community groups and others across New York to advocate for sensible environmental policies at the local, state, and federal levels.  For the past 10 years, he has taught students at Pratt Institute how to use GIS in their urban planning careers, and helped educate many others through presentations about the value of GIS.  He lives in Manhattan.

eSpatiallynewyork:  How did you end up in your current position at Center for Urban Research?  

Romalewski:  Before joining CUNY I ran the Community Mapping Assistance Project (CMAP) at NYPIRG for about eight years, providing mapping services to nonprofit organizations across the country.  (Before that I was an environmental researcher and advocate at NYPIRG.)  By 2004 or so, CMAP’s work had started to outgrow our advocacy-oriented parent organization. Internally we discussed options of spinning off CMAP as a social business venture, merging it with another organization, or launching it as its own nonprofit.

At the same time we were going through a strategic planning effort for the OASIS project, and one of the key findings was that OASIS would benefit from an institutional setting such as academia where the OASIS website would be able to leverage more stable technology resources and organizational support.

One of the academic programs we talked with was the Center for Urban Research (CUR) at the CUNY Graduate Center.  I had worked on projects over the years with CUR’s director John Mollenkopf, and he was a big fan of our work. It seemed like a great fit, and in January 2006  I moved to CUNY.

eSpatiallynewyork:  How do CUR projects come to be or developed?

Romalewski:  We’re fortunate to have a good amount of leeway in deciding on projects.  Generally CUR engages in applied research projects in the areas of neighborhood change, immigration, and urban development broadly speaking. Within those areas, we look for mapping projects where we can have an impact, where we can leverage CUR’s mapping skills and expertise in analyzing urban trends, and that come with funding support so we can cover staff time and related expenses.

We’re especially interested in working with our colleagues throughout CUNY, as well as within city government (since CUNY has a close relationship with New York City agencies), but we also take on projects with a wide array of partners.

If the project involves an online mapping component we try to structure it so we can incorporate the latest and greatest interactive web and mapping techniques and technologies. Continue reading

10 Questions: Dale Morris

Dale Morris is one of New York State’s most recognized and senior GIS statesmen.  With a distinguished civil service career spanning 38 years, he has contributed significantly to the NYS GIS community in many capacities to say the least of directing one of the most established GIS programs in the state at Erie County – and its far reaching influence in western New York.  Ten questions seemed like a slight to an individual with such a body of professional work, so the eSpatiallyNewYork editorial team gave him permission to push it to 15 questions. Or something like that.  Enjoy.

eSpatiallynewyork:  How long have you been with Erie County?

Morris:  I’ve been in the Department of Environment and Planning since 1981. Prior to this I worked as a Planner for the Town of Amherst, NY and before that the Erie and Niagara Counties Regional Planning Board. I graduated from Cornell University with a Master’s Degree in Regional Planning in 1977.

eSpatiallynewyork:  When did you start doing GIS work?

Morris:   Working initially as a Planner for Erie County presented  many opportunities for making and using maps. In the 1980s we were still using Mylar, zipatone, and Leroy Lettering Sets for making maps, which is tedious, time consuming, and not easy to change. I began to investigate the world of digital mapping, which was still in its beginnings as a desktop product. I started with the DOS version of MapInfo. I recall how amazed we all were that we could do something as simple as draw the County and municipal boundaries on-screen. Looking back on it now it all seems so rudimentary!  Regardless of how basic it was, my Division became known for our ability to make computer drawn maps. At that time there wasn’t much concern about the database behind the maps- it was enough to be able to draw and edit maps digitally rather than by hand.

As desktop mapping grew in popularity through the 1990s a number of County departments began independently looking into it. This usually resulted in them calling me to ask for advice or data. Of course, this also meant that everyone was using different systems, and at that time it made exchanging data between systems very difficult or impossible. It was a classic case of disjointed silos of data and applications.

A change in County administration in the late 1990s brought new management in our department, and I was challenged to prepare a white paper for moving the County further forward into the digital mapping world. I proposed creating a new County Division that would be empowered to centralize decisions relating to geospatial technology (by then we could use terms like “geospatial” without getting blank stares!). The Office of Geographic Information Services (OGIS) was born in 2001, and I have been the Director since then. So for me personally, my career started with both feet in the urban planning field, then a gradual shift to one foot in planning and one in digital mapping, and then finally both feet in GIS. I do very little “typical” planning anymore, even though OGIS is part of the Planning Division.

While OGIS is an Office within the Department of Environment and Planning, only a portion of our work is related to this department. We work very closely with our IT shop to maintain and operate the County’s GIS technology infrastructure, and with other departments and outside agencies who either use our enterprise GIS technology or who need direct assistance with their mapping needs.

eSpatiallynewyork:  What’s the relationship between your office and Niagara County?

Morris:  We have a formal Intermunicipal Agreement (IMA) with Niagara County for GIS Services. The agreement is for a five year period and we are well into the second of these five-year agreements. Erie County hosts Niagara County’s geospatial data and provides on-line mapping services to Niagara County. The two counties are connected by a high-speed microwave link, which operates very well. In essence, Niagara County is simply like any other Erie County department that taps into the Erie County enterprise GIS network. In addition to providing Niagara County this service for a fee, the IMA provides a framework for backup of GIS data between the two counties, and as well defines a GIS “mutual aid” protocol for sharing of GIS resources and staff in the event of an emergency.
Continue reading

Queensbury Geospatial: A Model for NYS Town Government GIS

Northbound New York State Northway Exit 20 leads to the Town of Queensbury which is the seat of Warren County.  With a 2010 population of 27,901 the town covers nearly 65-square miles including shoreline along Lake George and lands within the Adirondack Park.  Further into town, several of the usual NYS town government program offices are located at 742 Bay Road including staff and resources which support the town’s geographic information system (GIS).

GIS Background

Prior to 2002, Queensbury officials had worked with consultants to establish initial GIS capacity including the creation of ArcIMS applications and investing in multiple ESRI desktop licenses.  In 2002, the town’s GIS initiative changed significantly with the hiring of George Hilton.  Hired as a GIS Specialist and planner, George was brought onboard to build and advance the town’s  GIS program.

Prior to arriving in Queensbury, George had honed his GIS skills while a student at Central Connecticut State University and later in government positions  in the Denver and Kansas City areas as well as three years with Westchester County.  Now, 15-years after his arrival, George oversees a program which can be considered an exemplary NYS municipal government GIS program.

Current Queensbury Geospatial Products and Infrastructure        

George designs, codes and maintains the Town’s Interactive Mapper (Firefox and IE only) and a host of other ArcGIS.com map viewers including Fire and EMS, Planning and Zoning, and Phase II Stormwater Infrastructure.    He also supports emerging mobile mapping and data collection efforts which includes Trimble GPS units with Trimble Positions to collect data and update feature services and Geodatabases in the field.  The town also collects data (hydrant inspections, site inspections) with ArcGIS Collector using feature services and make maps available through ArcGIS Online.

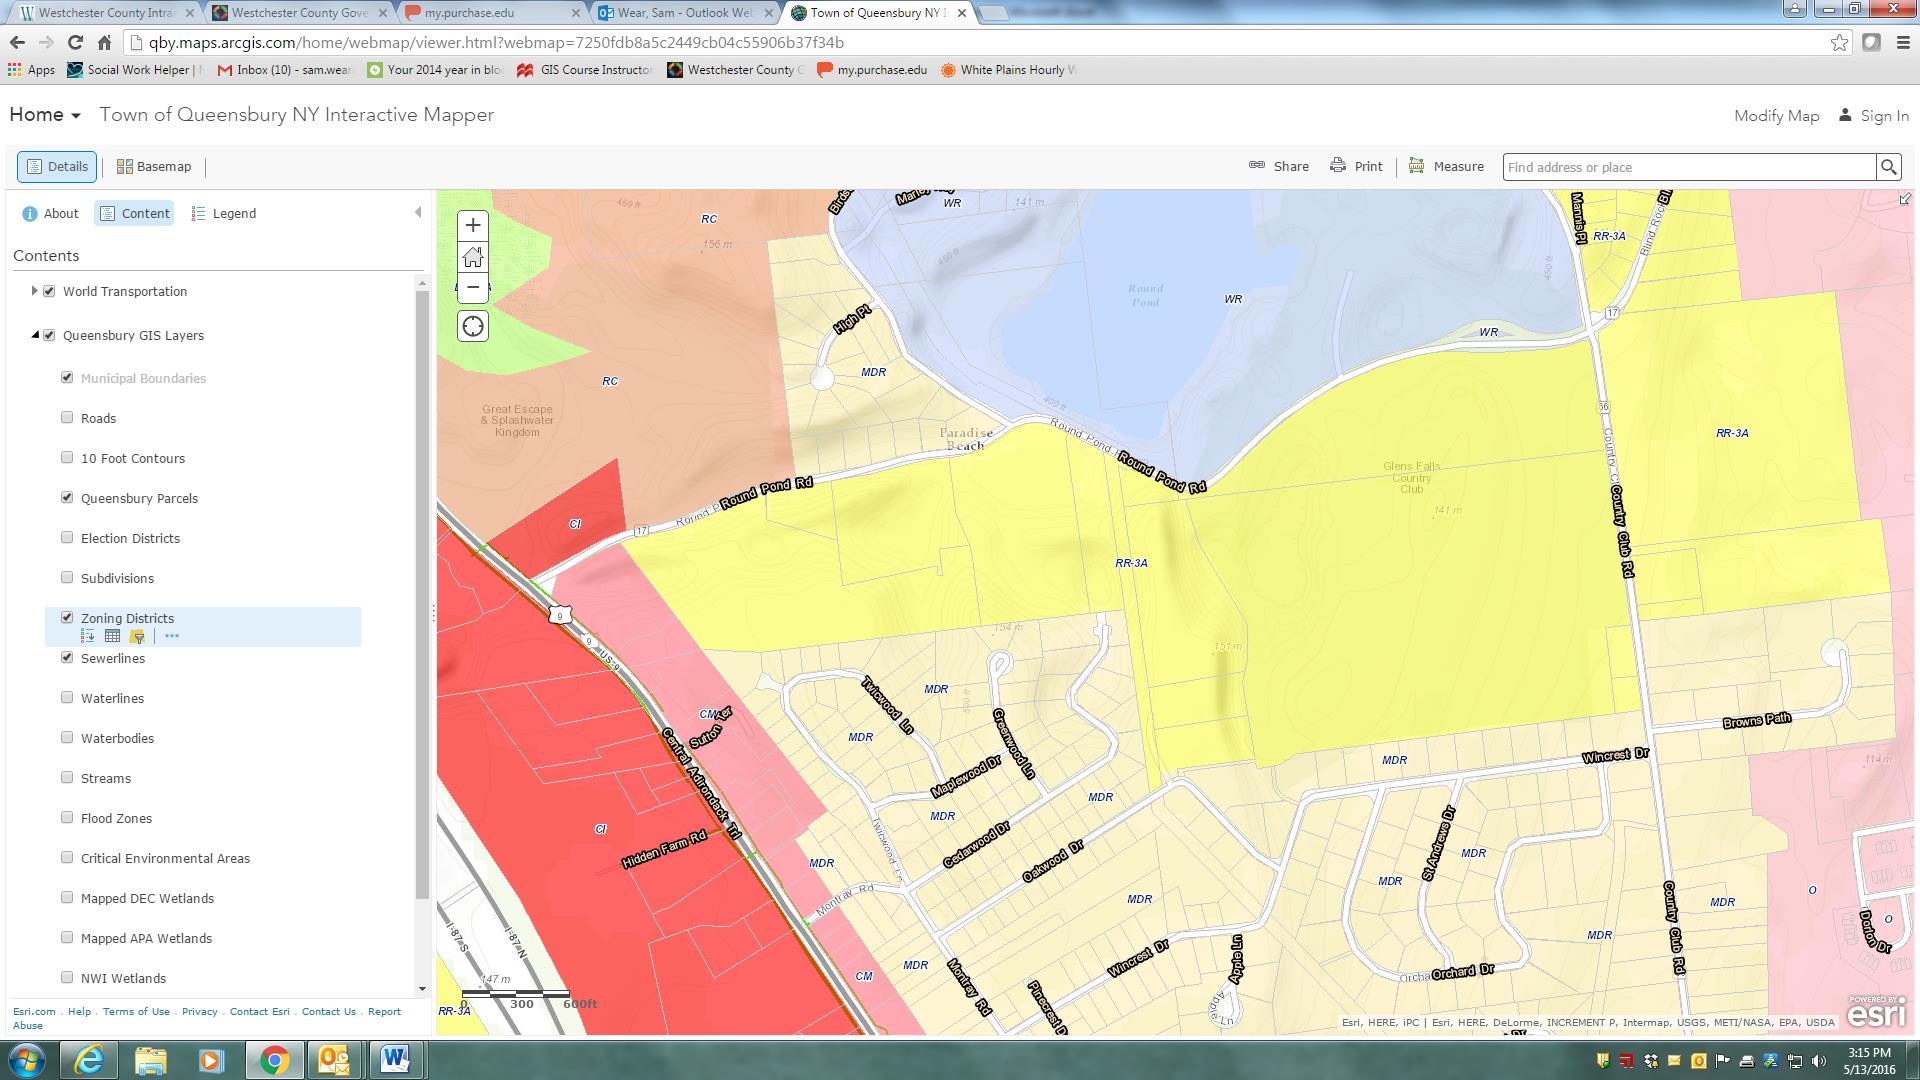
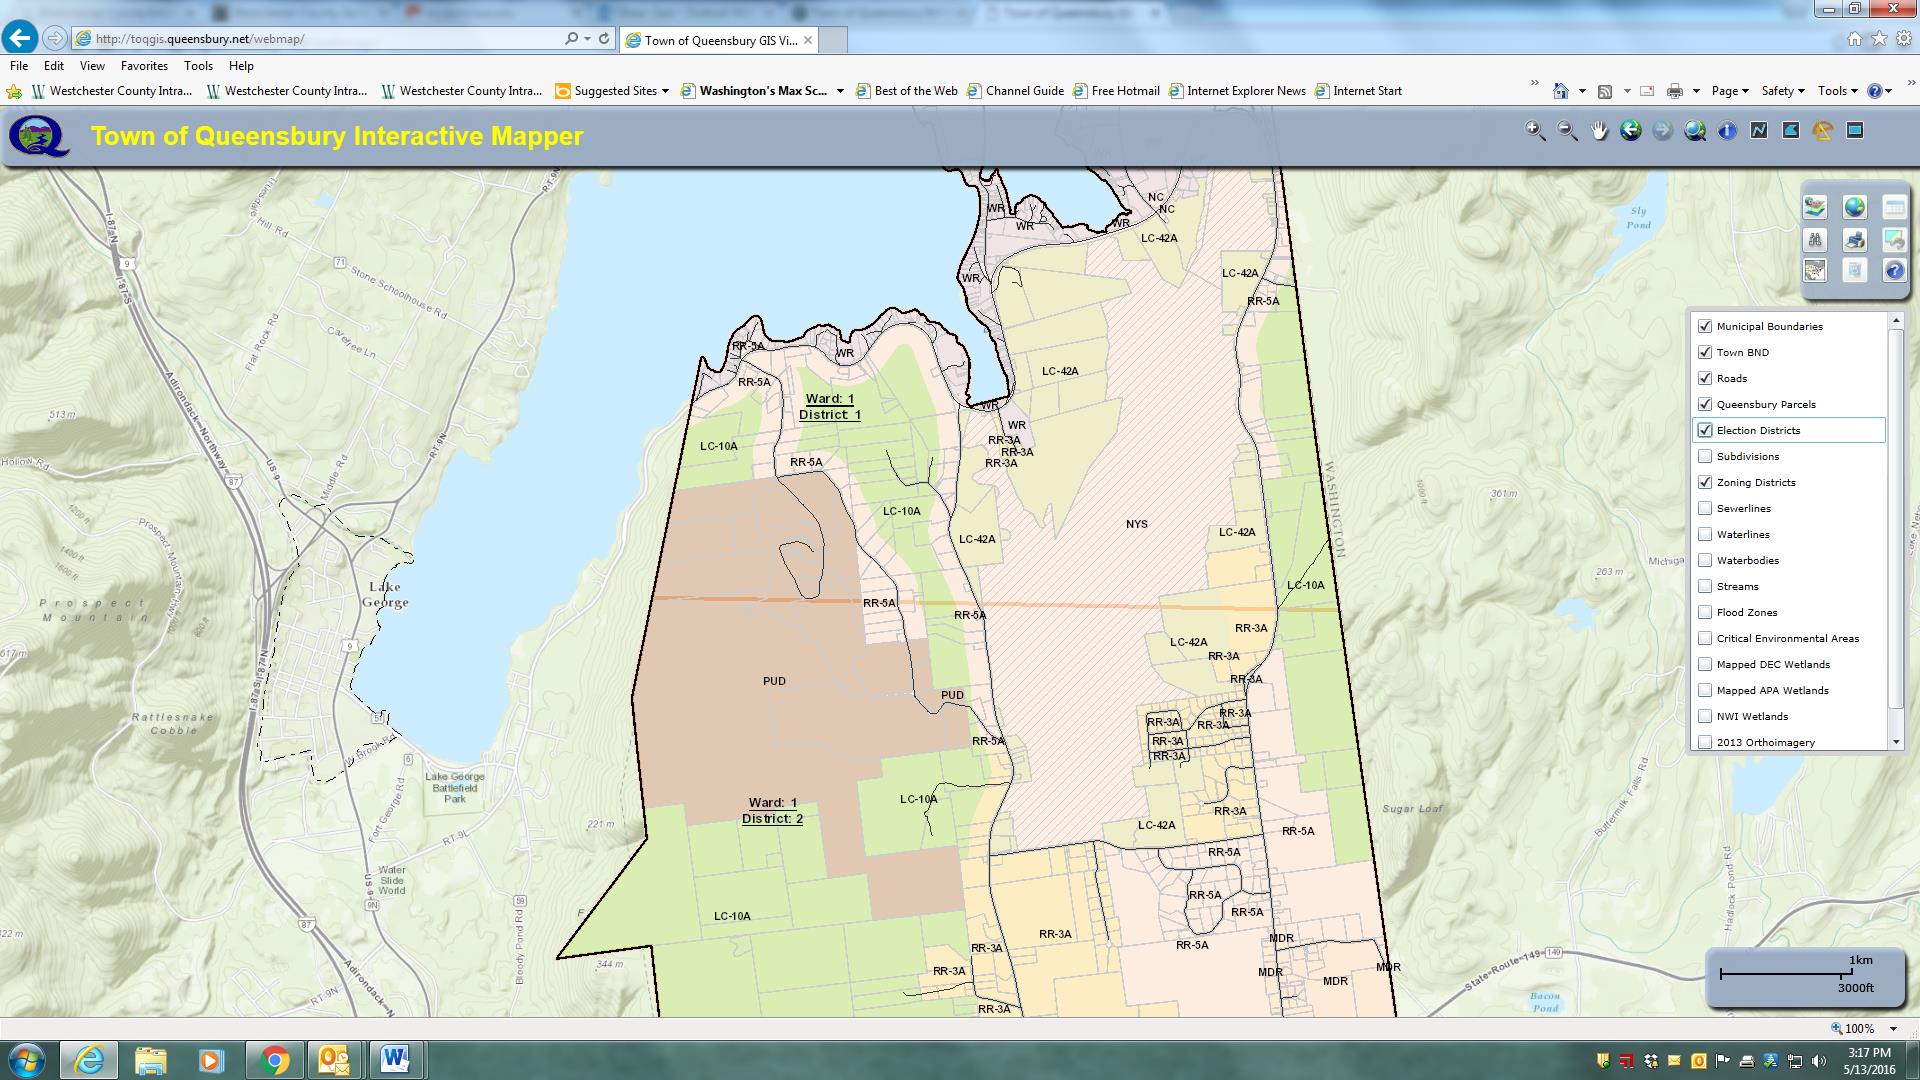
The Town of Queensbury Interactive Mapper includes many locally developed datasets as well as data from other authoritative sources including Warren County, NewYork State and the Adirondack Park Agency.

The Town of Queensbury Interactive Mapper includes many locally developed datasets as well as data from other authoritative sources including Warren County, NewYork State and the Adirondack Park Agency.

Other software components – much of which has been self-taught – George uses inlcludes Sybase (RPS) and SQL Server with ArcSDE as well as ArcGIS Server, ArcSDE, ArcGIS (Advanced), and Spatial Analyst.  The town is currently at ArcGIS Server 10.22 and are testing 10.4 with plans to upgrade very soon.  He also works with QGIS and Global Mapper from time to time.  Global Mapper has been particularly helpful in importing updated USGS topo quads (DRGs) in GeoPDF format into our GIS.

The Queensbury GIS program has grown from primarily providing support to the Planning Department to becoming a very important resource for many departments across town government.  Both the Town Board and Town Supervisor are very supportive of GIS and recognize how much of an important tool GIS has become to the Town.

Parts of the Town of Queensbury is actually within the Adirondack Park and therefore subject to stringent land use regulations. This image highlights zoning districts on the southeastern shore of Lake George – within the park boundaries.

Parts of the Town of Queensbury is actually within the Adirondack Park and therefore subject to stringent land use regulations. This image highlights zoning districts on the southeastern shore of Lake George – within the park boundaries.

George maintains an excellent working relationship with Warren County GIS which is under the direction of Sara Frankenfeld where he obtains  parcel data.  The town creates town-wide datasets (zoning, subdivisions, hydrants, infrastructure, environmental, street centerlines, address points, etc) which are then shared back with the County. Referencing her ongoing GIS work with Queensbury, Sara explains:

“George is great to work with and especially in a rural environment where we don’t have any other full-time GIS staff within our respective local governments, it’s so helpful to have a colleague to bounce things off.  He’s a very good sounding board and when I’m considering starting a new project, I often call to get his thoughts.

 We’ve worked closely together on a number of projects.  We recently worked together to streamline the way e-911 addresses are assigned, and this has been a huge improvement to workflows in both of our offices, as well as in the Real Property office, the zoning/building inspectors departments, and the assessors’ offices

 Our current cooperative project is a NYS Archives LGRMIF grant funded project to make the SAM data, along with information about truss roofed structures (as required by a NYS law that went into effect 1/1/2015), and other relevant data such as hydrant locations, available to first responders via an Android/iOS app”.

George also works closely with several state agencies including the Adirondack Park Agency, NYS Parks and Historic Preservation, NYS Department of Environmental Conservation, and NYS Information Technology Services (ITS).  Queensbury Town Supervisor John Strough adds:

“Like today’s computers, I do not know how we lived without him. His GIS services have helped us map the town’s infrastructure structures, trail systems, historic places and many other location details that we absolutely need to comply with the needs of today’s municipal world. I am in his office requesting his services almost as often as am in my budget officer’s office, that’s how important GIS services have become to the town.

Broad User Base

The town enjoys a wide user base including ESRI desktop clients in Planning, Water and Sewer, Assessor, and Parks departments though George is commonly called upon to assist in more detailed data creation, analysis, and cartographic products throughout town government.  He also provides training for users in many local, regional and statewide agencies including the Warren County Soil and Water Conservation District, the Champlain Watershed Improvement Coalition of New York, and the NY State Conservation District Association at their statewide conference in Auburn and Syracuse.

Additionally, George provides maps and data analysis for many community groups, nonprofits, schools, as well as for other municipalities and quasi-governmental agencies in the area.   Queensbury if one of the few municipalities in the area with a GIS program and is often asked to provide support throughout the area.

Creating More Queensbury GIS Programs

While George brought years of GIS experience to the town when accepting  the job, his ability to advance the town’s GIS program has certainly been augmented by ongoing political and administrative support.  Such combination of experience, competitive salary, technical skills and political support is often hard to replicate –   or even find for that matter –  in small town governments across the Empire State.

The Town of Queensbury GIS program speaks to the importance of educating elected officials in the benefits and  importance of investing – both financially and institutionally –  in the role of geospatial technologies in small town governance.  While the Queensbury GIS solution might be considered a typical for similar-sized communities across the state, it nonetheless can be a model for the GIS community to aspire to and replicate.

Visit the Town of Queensbury website at http://www.queensbury.net or George Hilton directly at GeorgeH@queensbury.net.


The Federal Geospatial Data Act of 2015: A NYS Local Perspective

There has been a limited amount of fanfare and support – or even discussion for that matter – here in the Empire State on the proposed Geospatial Data Act of 2015.    Beyond one or two acknowledgements on  the state listservs, the announcement really didn’t generate any buzz or visible discussion throughout the GIS community.   Though it comes as no real surprise as few in New York statewide GIS community have had any meaningful exposure or introduction to past legislation/bills regarding federal agencies referenced in the proposed 2015 act introduced by Senator Orrin Hatch of Utah.  In absence of any real meaningful dialog here in the New York  between the GIS professional community and elected officials on federal legislation (or any geospatial legislation for that matter except perhaps the never-ending “Surveyor” Legislation), one wonders if New York’s federal delegation is even aware of the proposed act.  Or its stated benefits.

At the core of the proposed 2015 Act is a combination federal legislation and policies including (in no particular order of importance) OMB Circular A-16, the National Spatial Data Infrastructure (NSDI), and the Federal Geographic Data Committee (FGDC).   Very government-like and uber confusing, a little background includes: In 1994, Executive Order 12906 was issued by President Clinton to direct the development of the NSDI.  Unfortunately, twenty-one years later,  many of the requirements of EO 12906 have never been acted on.  Circular A-16 was originally issued in 1953, revised in 1967, revised in 1990 (establishing the FGDC), and revised again in 2002 outlining specific federal agency obligations.  A-16 Supplemental Guidance was also issued in 2010. Similar to EO 12906, federal agencies have struggled to implement many of the provisions of OMB A-16 over the same period of time.

The August 2002 revision to Circular No. A-16 was particularly significant in context of naming the stewardship of over 30 data themes to federal agencies in support of both the NSDI and FGDC programs.  Specific datasets included:

 Biological Resources, Cadastral, Cadastral Offshore, Climate, Cultural and Demographic Statistics, Cultural Resources, Orthophotography, Earth Cover, Elevation Bathymetric, Elevation Terrestrial, Buildings and Facilities, Federal Lands, Flood Hazards, Geodetic Control, Geographic Names, Governmental Units, Geologic, Housing, Hydrology, International Boundaries, Law Enforcements Statistics, Marine Boundaries, Offshore Materials, Outer Continental Shelf Submerged Lands, Public Health, Public Land Conveyance, Shoreline, Soils, Transportation, Vegetation, Watershed boundaries and Wetlands.

While all data themes are clearly important in supporting the broad national NSDI efforts, most New York State local governments  have a limited number of day-to-day business work functions directly related to NSDI spatial data themes itemized in the 2002.  (In fact many of the 2002 NSDI spatial data themes are only developed and maintained by federal resources.)  Adding to the disconnect is that many 2015 local government GIS programs, especially in urban areas, have business needs which are not supported by either the content or spatial accuracy of core 2002 NSDI spatial data themes.  For example, local government geospatial programs in the areas of  infrastructure management (drinking water, sanitary sewer, and storm water systems), utilities, vehicle routing and tracking, permitting and inspection systems, service delivery programs in the health and human services, local planning, zoning, and economic development activities are not closely aligned with many of the 2002 NSDI spatial data themes.    While many federal mapping programs and geospatial datasets continue to be consistent at 1:24,000 (2000 scale), most local urban government GIS programs are built on top of large scale (i.e., 1”=100’ or even 1”=50’) photogrammetric base maps.

Not all is lost, however, as some local data products such as parcel boundaries and planimetrics (building footprints, hydrology, transportation) actually are consistent selected 2002 NSDI spatial data themes (Cadastral, Governmental Units, Hydrology, Geodetic Control, Transportation) albeit at a higher degree of accuracy.  Unfortunately, limited capacity or systems have been established to leverage or normalize such datasets into the NSDI.

Unfortunately, even though the federal government continues to identify and list local governments as key stakeholders in most legislative proposals, it’s common belief among federal agencies that resources are not available to monitor or engage local GIS programs (i.e., 3000 counties vs. 50 states).  And there continues to be the (wild) belief state level GIS programs can serve as the ‘middle man’ or conduit between local and federal geospatial programs.  Somehow magically rolling up local government data for use by federal agencies and integrated into the NSDI.  Not really.  At least here in New York State.   And no, old school NSDI Clearinghouses nor the current rage of soon-to-be-yesterday-news “Open Data” portals being equivalent mechanisms in supporting and maintaining 2002 A-16 data themes.

Perhaps sponsors of the Geospatial Act of 2015 could model collection of local government geospatial data assets after the ongoing efforts associated with the HIFLD (Homeland Infrastructure Foundation Data) program.   Though obviously a very different end product from the NSDI, federal agencies producing the HSIP (Homeland Security Infrastructure Protection) Gold and HSIP Freedom datasets have enjoyed relatively decent success in collecting large volumes of local government data – much of which has been paid for at the local level.  And many of the same federal agencies associated with the HIFLD program including National Geospatial-Intelligence Agency (NGA), Department of Homeland Security (DHS), Department of Defense (DOD), and the U.S. Geological Survey (USGS) have stewardship responsibilities of NSDI spatial data themes.  Different.  But similar.   And adding more bewilderment to the discussion is that it is easier to contribute crowed sourced data (structures) to the USGS than it is for local governments to push large scale photogrammetric data of the same features (structures) to federal agencies and incorporated into the NSDI.

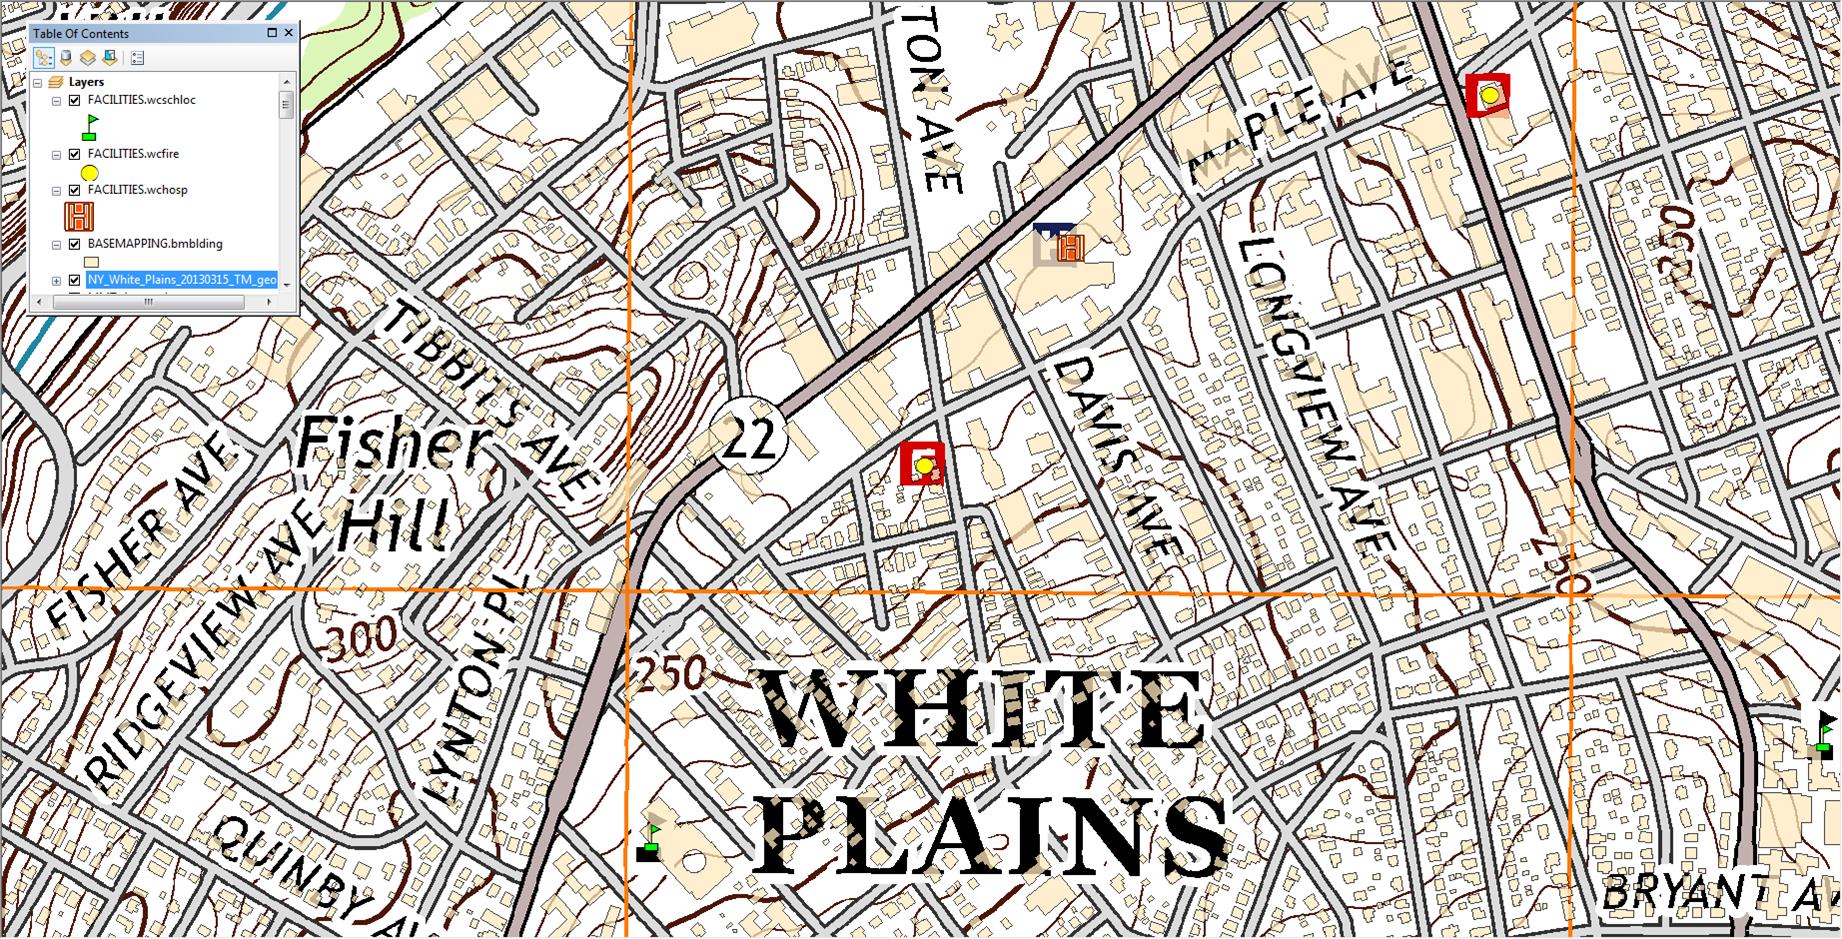
Georeferenced 2013 US Topo White Plains quadrangle.  While selected structures such as schools, fire houses and hospitals are identified on  default US Topo product, this image shows all Westchester County building footprints

Georeferenced 2013 US Topo White Plains quadrangle. While selected structures such as schools, fire houses and hospitals are identified on the default US Topo product, this image shows also shows how local content such as Westchester County building footprints can be made available to the NSDI structures data theme.

Unless a methodical and accepted process – adopted by pertinent local/state/federal stakeholders – is institutionalized  by the FGDC, the Geospatial Data Act of 2015 will continue to be more about federal and state geospatial programs and less about truly integrating and taking advantage of the vast amount of local government data.   The Act needs to specify and fund building work flows which communicate directly with the source of the data as well as working towards reducing the reliance on state “middle men” GIS programs as means to acquire local geospatial data. (Local governments were not even mentioned in a February 2015 General Accounting Office report entitled “GEOSPATIAL DATA: Progress Needed on Identifying Expenditures, Building and Utilizing a Data Infrastructure, and Reducing Duplicative Effort”.  A report which appears to be eerily similar and a rebaked version of the  (ill-fated) 2013 “Map It Once, Use It Many Times”   federal geospatial legislation attempting to reposition the federal effort to coordinate National geospatial data development.

Ironically, just one month prior to the Geospatial Data Act of 2015 being introduced, a scathing report was released by the Consortium of Geospatial Organizations (COGO) entitled “Report Card on the U.S. National Spatial Data Infrastructure”.  In short an overall “C-“ to NSDI effort over the past two decades.  The report falls short in not holding state GIS programs more accountable and responsible as well as most have  jockeyed over the past two decades to be seen as enablers and partners of the NSDI  effort in context of framework layer stewards, recipients of FGDC grants, and establishing/maintaining NSDI Clearinghouse nodes.  States supposedly as “middle men” and conduits to valuable local government geospatial data assets.   Perhaps COGO report cards on individual State government GIS programs are forthcoming.

At the end of the day, NSDI supporters actually do have access to a wide range of local government geospatial assets as files, consumable web services, or perhaps through some other middleware provided by a software vendor.   Or a combination of all the above.  The data and the technology are here.  To the end of furthering the intent of the NSDI, legislation like the Geospatial Act of 2015 will fall on deaf ears and not advance as it should unless the federal government establishes the means to directly engage and connect to local governments.