Warren County GIS: A Showcase of Geospatial Content for County and Local Government

Program’s modest beginning started in the late 1990s with AutoCAD files and a copy of ArcInfo

Now spending a significant amount of time upstate New York in Essex County, we now find ourselves looking for different routes to take back and forth from southeast New York State instead of the “go-to” I87/Northway option every time.  Just to mix things up – the four-plus hour drive going the normal route can get to be a bit monotonous.

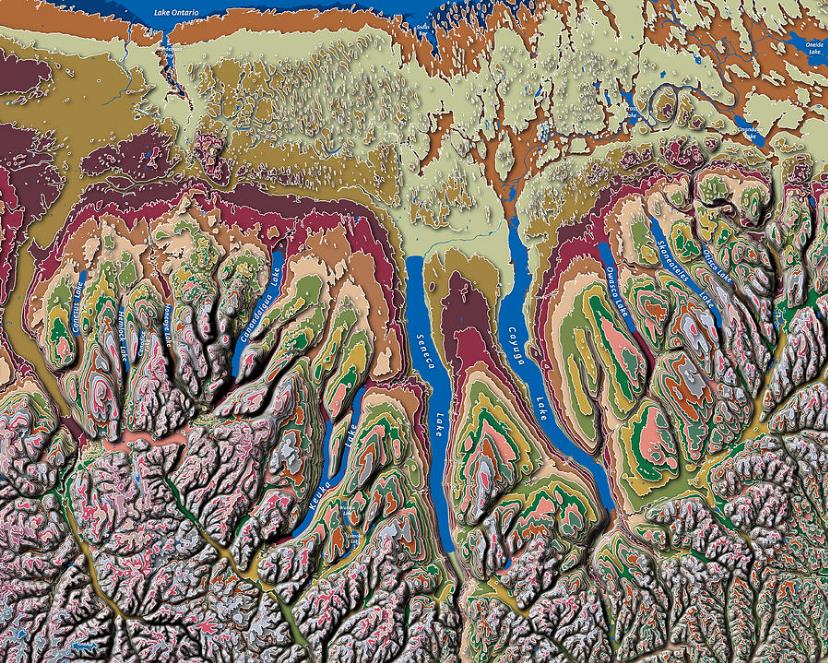
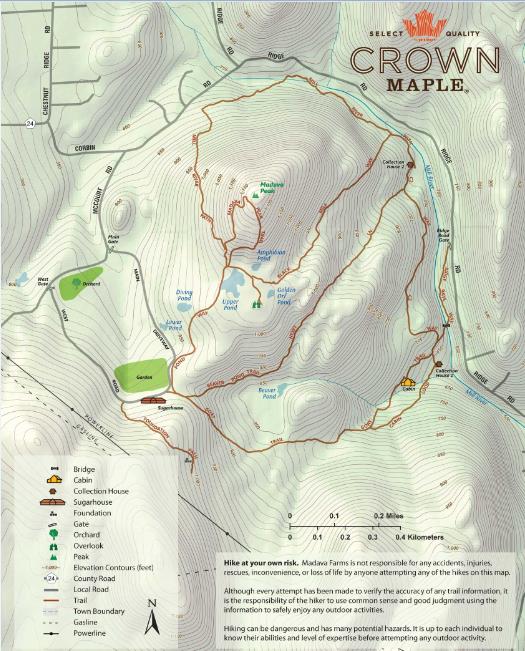
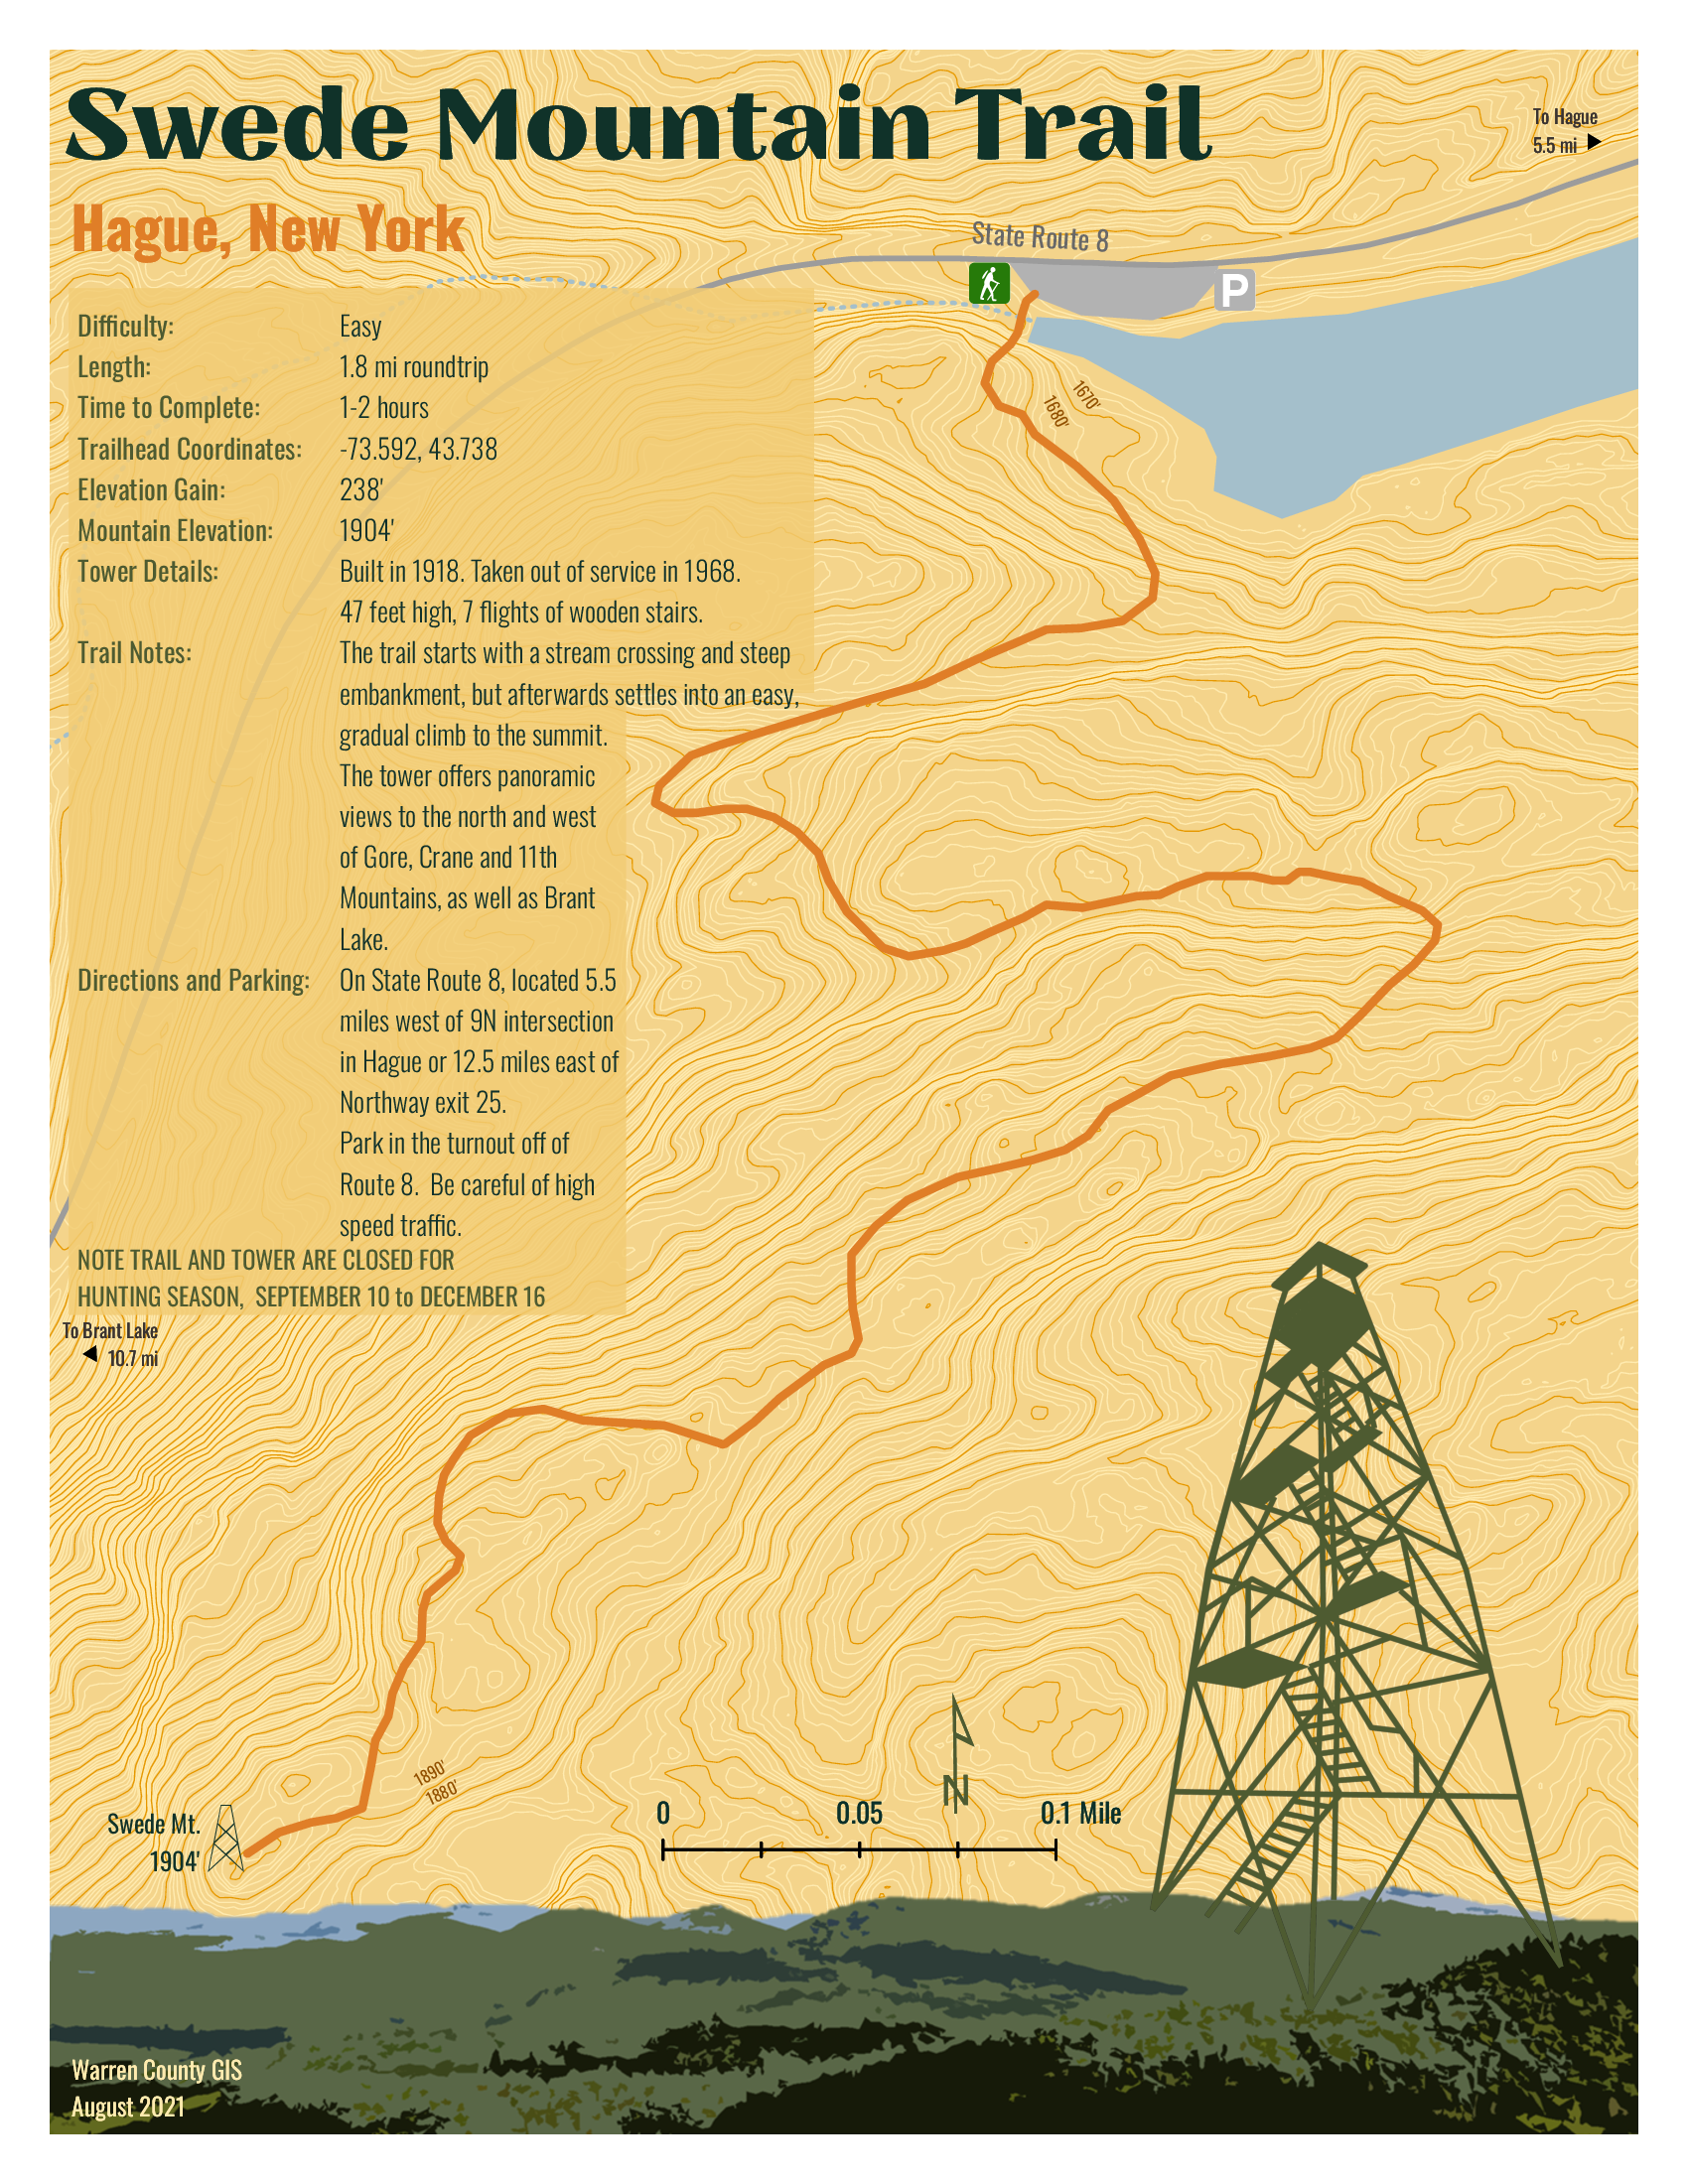
So it was in September I came south out of Ticonderoga headed to Hague (yes, named after The Hague in the Netherlands) on the northern end of Lake George – an area I had never been to.  And it did not disappoint.  Though ultimately to State Route 8 (aka Graphite Mountain Road) to a new Adirondacks trailhead:  Swede Mountain Firetower.  Even though the round-trip hike isn’t that long and relatively easy, it was getting late and I didn’t even get out of the car while in the trailhead parking lot.  Instead, making a note to print out a trail map when I got home.  A couple days later and not having a clue what trail maps were actually available, I Googled “Swede Mountain Firetower trail map” and a candidate list of URLs and image options were immediately returned.  Randomly selecting the one below,  the cartography caught my eye and I quickly looked for the map’s author.  There on the bottom left:  Warren County GIS.  

It was quickly then off to the Warren County GIS website.  Which became the genesis of this article.

Warren County GIS

Just by coincidence, this article coincides with the release of the new Warren County GIS Hub as announced by long-time county GIS Administrator, Sara Frankenfeld.  Overseeing a countywide GIS program judiciously developed over the course of more than two decades – from the days of ARC/INFO coverages to 2022 mobile field apps and interactive online viewing applications.  Also available through the program and Hub is a rich repository of dozens of hardcopy maps available for download covering areas such as countywide outdoor recreation, history, demographics, municipalities, planning and the environment and much more.   An amazing amount of content bundled into three main categories:  Web Maps and Apps | Maps for Print | Download Data.

Background

Originally from the northside of San Francisco Bay in Marin County and earning a degree in Geography from Northern Arizona University, Frankenfeld came to the east coast to initially start work with Dutchess County.  After a short stint with NYSDEC she ultimately made her way to Warren County in 1999 where she got started with a copy of ARC/INFO on a standalone computer in the county building basement.   The county had created a new GIS position in the Planning Department to help convert the tax maps to AutoCAD and then over a period of time converting from AutoCAD to ARC/INFO and then later to geodatabase. 

Over the next four years, she was successful in winning over several other departments on the value and usefulness of GIS technology which she accomplished by focusing on easy, visible “wins” such getting people to use the newly available digital tax parcel data (linked to the RPS data) as quickly as possible and making hardcopy maps.  Lots of maps.  The visibility of the Warren County program also expanded by her working with municipal government zoning administrators and assessors and providing access to the new digital parcel data and including zoning maps,  wetlands data, and FEMA floodplain maps.  A New York State Archives and Administration (SARA) grant enabled the development of a parcel viewer app sby AppliedGIS – where she would later go to work for several years – called the Spatial Data Viewer.  The groundwork was also laid for the implementation of ArcIMS and Imagemate Online.  Somehow she also found time to include outreach programs to local schools and GIS Day.  

After a period in the private sector with (then) AppliedGIS/Fountains Spatial, she returned to Warren County in 2013 where she remains today.  

Today’s Environment

In 2022, the Warren County GIS program is built totally around the ArcGIS Online (AGOL) environment.   Frankenfeld states AGOL has “totally transformed the workplace” and furthers her two main goals of (1) improving public access to data and (2) streamlining/improving processes for county departments and organizations the GIS program supports.  She, along with GIS Specialist Amanda Beck, have embraced StoryMaps, Dashboards, Hubs and Survey123 in ways to make it easy for non-tech users to create and maintain data and access it.  While many of the combo Survey123/dashboard applications are internal facing, others, like the Lake George Milfoil Harvesting real-time app is available to the public.  And so is the Capital Improvement Project Planning viewerBoth respond to GIS requests from local municipalities, local organizations including  the Adirondack/Glens Falls Transportation Council (AGFTC), Lake George Park Commission and the Lake Champlain Lake George Regional Planning Board – all of which have tech support contracts the County.  Projects range from data compilation to hardcopy map preparation to creating and supporting online apps.  Usually these three organizations know exactly what they want, but GIS staff we do often try to suggest ways to streamline or improve their requests.  For example, County GIS staff helped AGFTC come up with a method to inventory sidewalk/crosswalk/curb ramps for ADA transition plans that proved really popular and resulted in a training session for all the Metropolitan Planning Organizations (MPO) in the state.

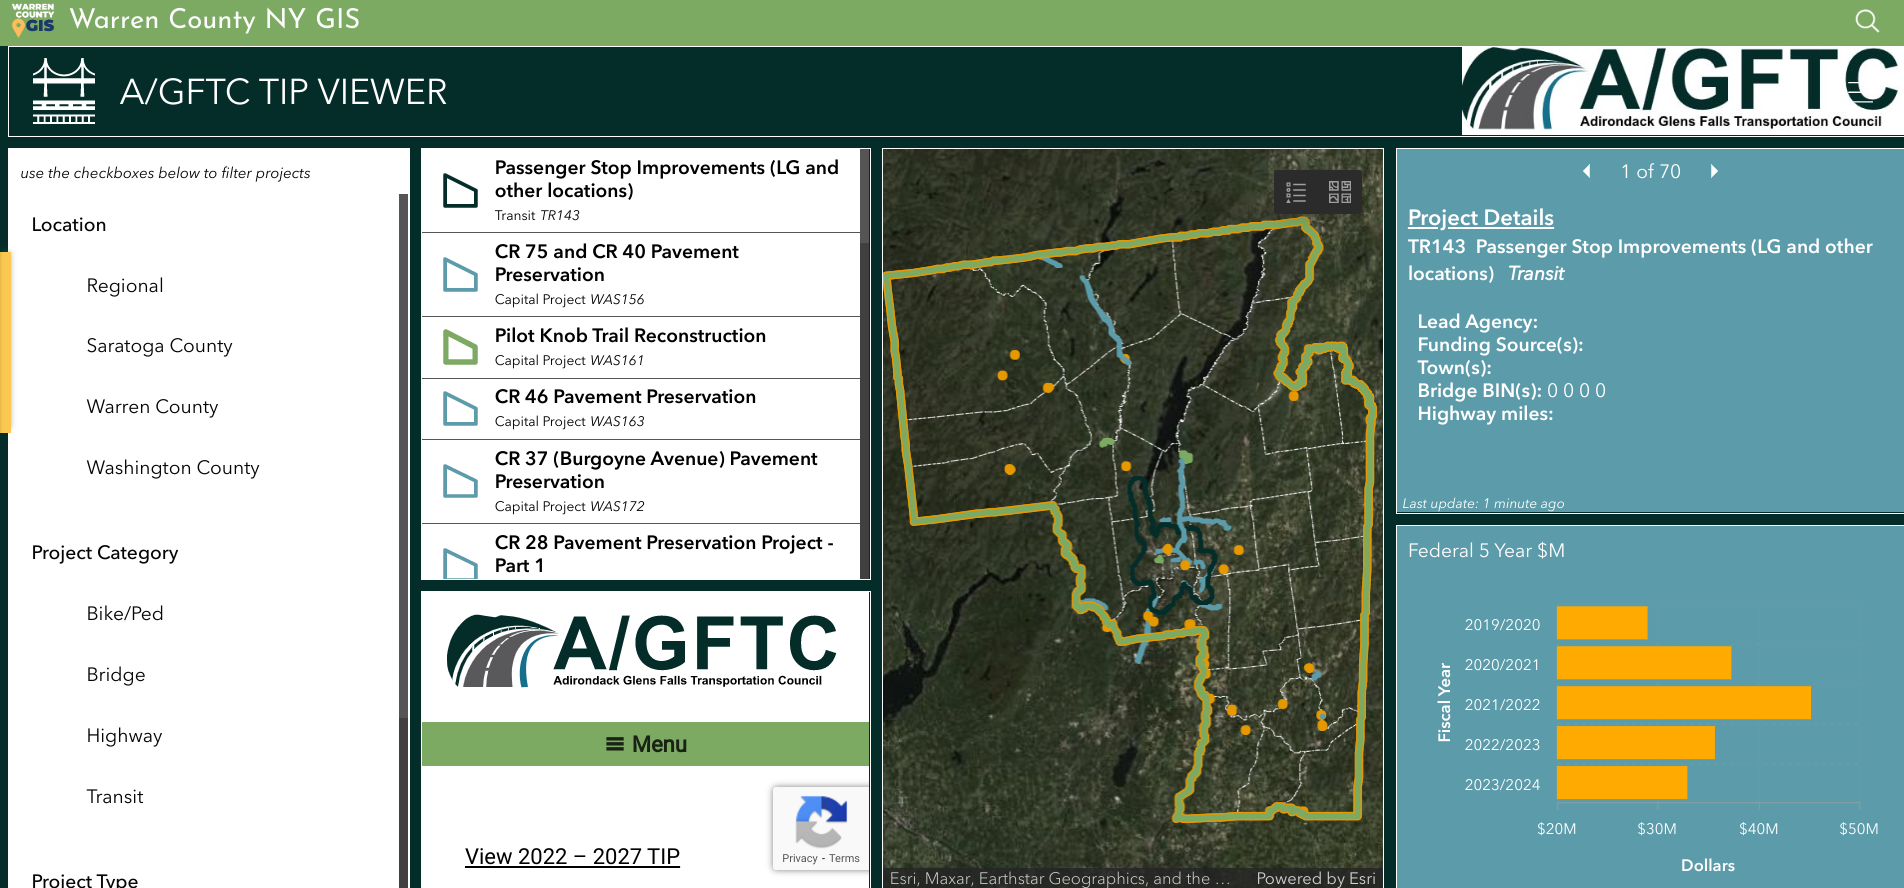
Dashboard for Adirondack/Glens Falls Transportation Council’s Transportation Improvement Program projects.

Having transitioned to ArcGIS Pro to support data editing, cartography and more complex analysis, Warren County GIS staff do a majority of their work in AGOL which includes the mobile pieces Field Maps and Survey123.  They still collect GPS data as needed (usually related to recreation or e911) and support field operations, such as collecting milfoil harvest or infrastructure data, for other users.  They also have Trimble boosters and cell phones which can be checked out to both county staff and municipalities for field data collection along with field worker licenses.   While there are still a few remaining ArcGIS desktop users, most users are using AGOL with named users in Planning, Soil and Water, Public Affairs, the Sheriff’s Department, Office of Emergency Services, Public Works, and Parks and Recreation.  Address and road centerlines are uploaded to the state twice a year and parcel data once a year.  A large current project Sara and Amanda are currently working on is building additional GIS capacity and functionality in County Department of Public Works.

Except for Queensbury which has its own full-time GIS staff person, Warren County GIS supports all municipalities in the County.  At the beginning of the program, Sara had  set up each municipality with desktop GIS as well as providing training and support.  In hindsight and it comes as no surprise this desktop support  was the most time consuming element of her job in the early years.  With the advent of online GIS, County staff has transitioned most of the towns off of desktop GIS, although there are a small number of towns which still use the desktop client.  Most local communities across the County now utilize new AGOL applications.   “We often will take the initiative with projects for the towns that relate to work the County Planning Department is doing such as the Warrensburg buildout analysis“, notes Frankenfeld, “as well advocating the adoption of Field Maps for maintaining water and sewer data.”

New GIS Hub

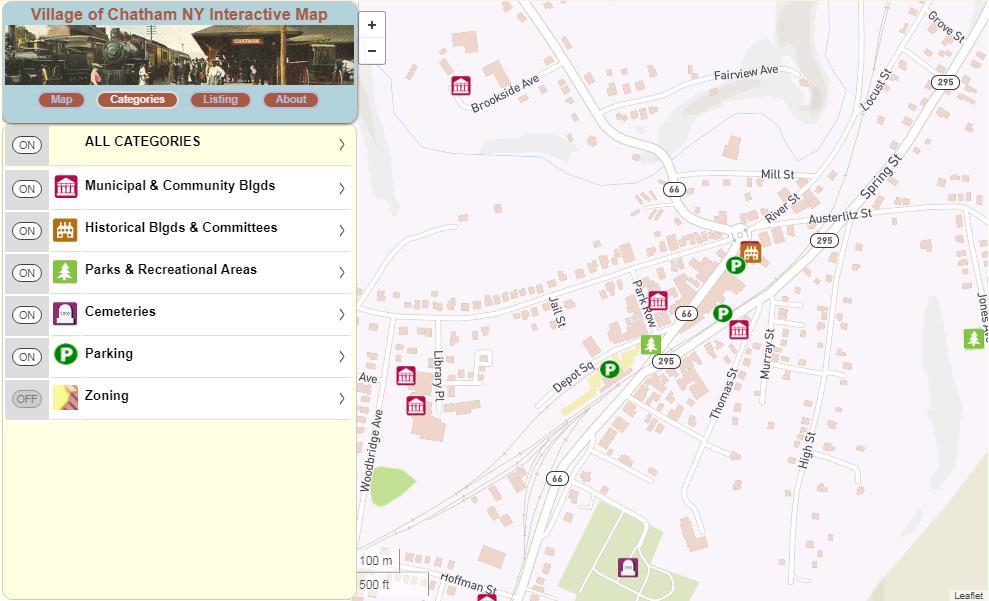
As noted previously, the new Warren County GIS Hub contains three main areas of content:  Web Maps and Apps | Maps for Print | Download Data.  Each area is then broken down further thematically into categories such as recreation, environment, transportation and infrastructure, planning and zoning, history, citizen reports and more.  With an established user community in County government, most of the time departments and organizations now approach GIS staff directly with applications to develop to support their business needs such as the Safe Pace, Opioid Dashboard, Storm Reporter, TIP viewer, etc).  Other projects have been initiated by GIS staff themselves such as the covid hub and election polling locator.   GIS staff work frequently  with other Planning Department and and apply grant funding to create projects such as History Mapper and the letterboxing challenges (Letterboxing Trail and Historians’ Challenge).

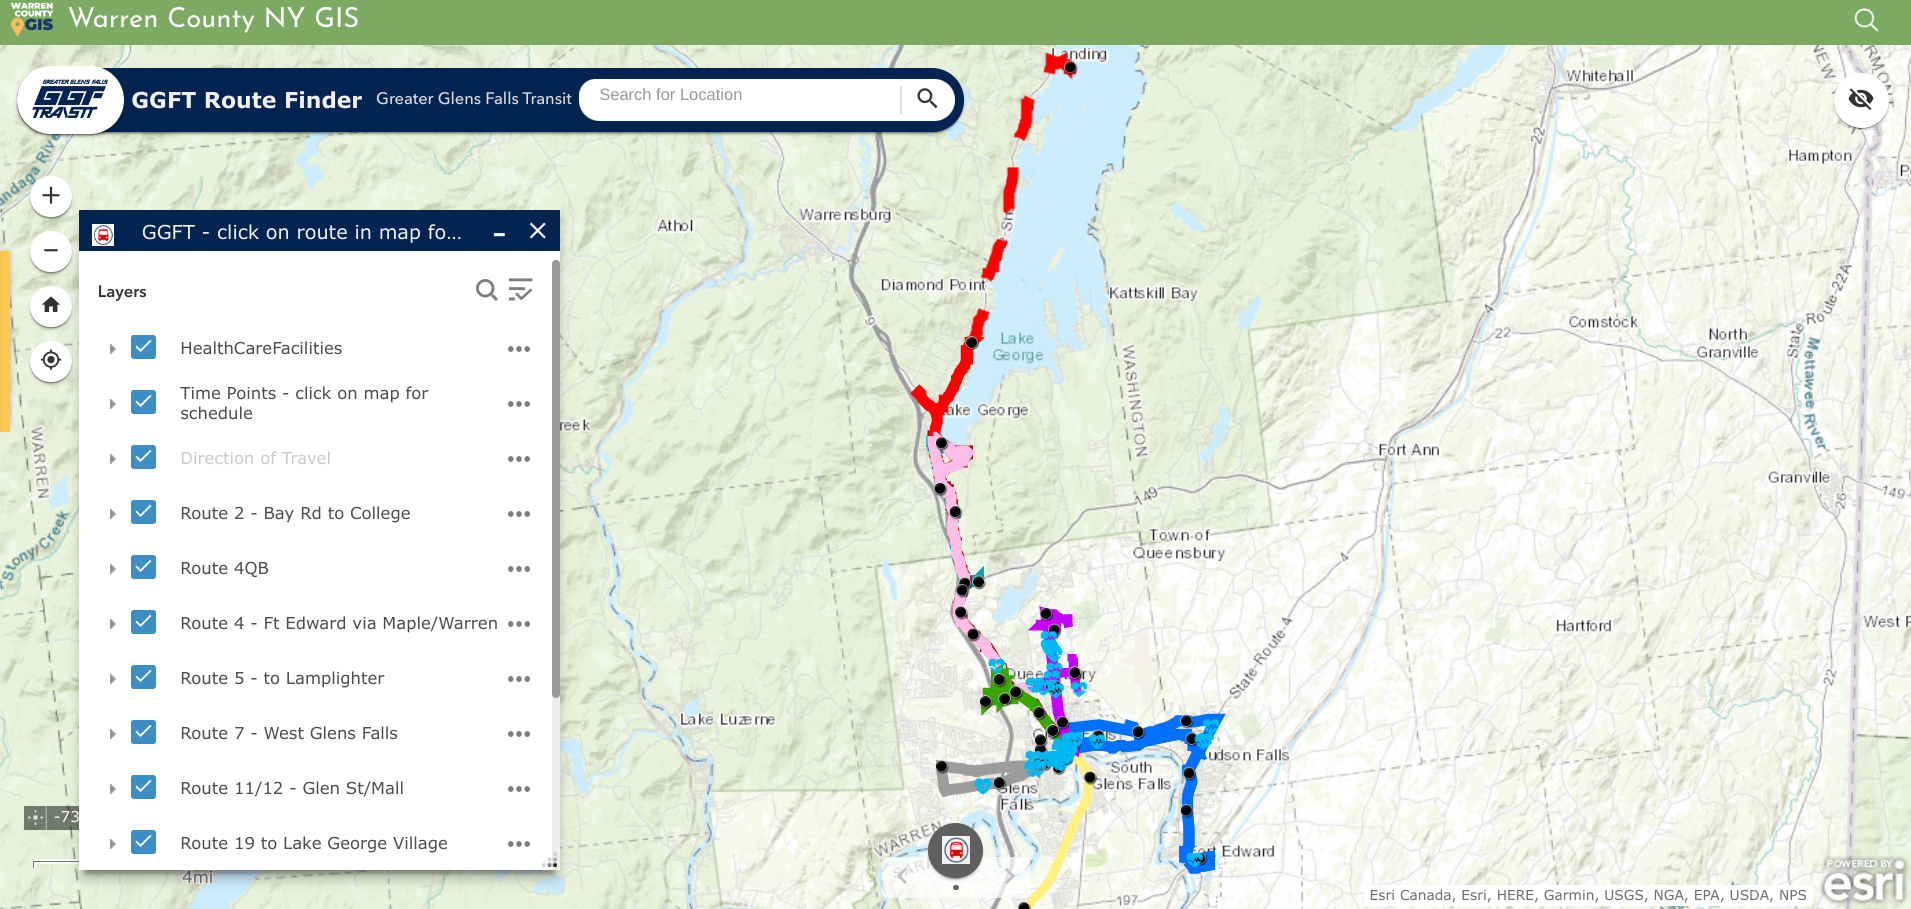
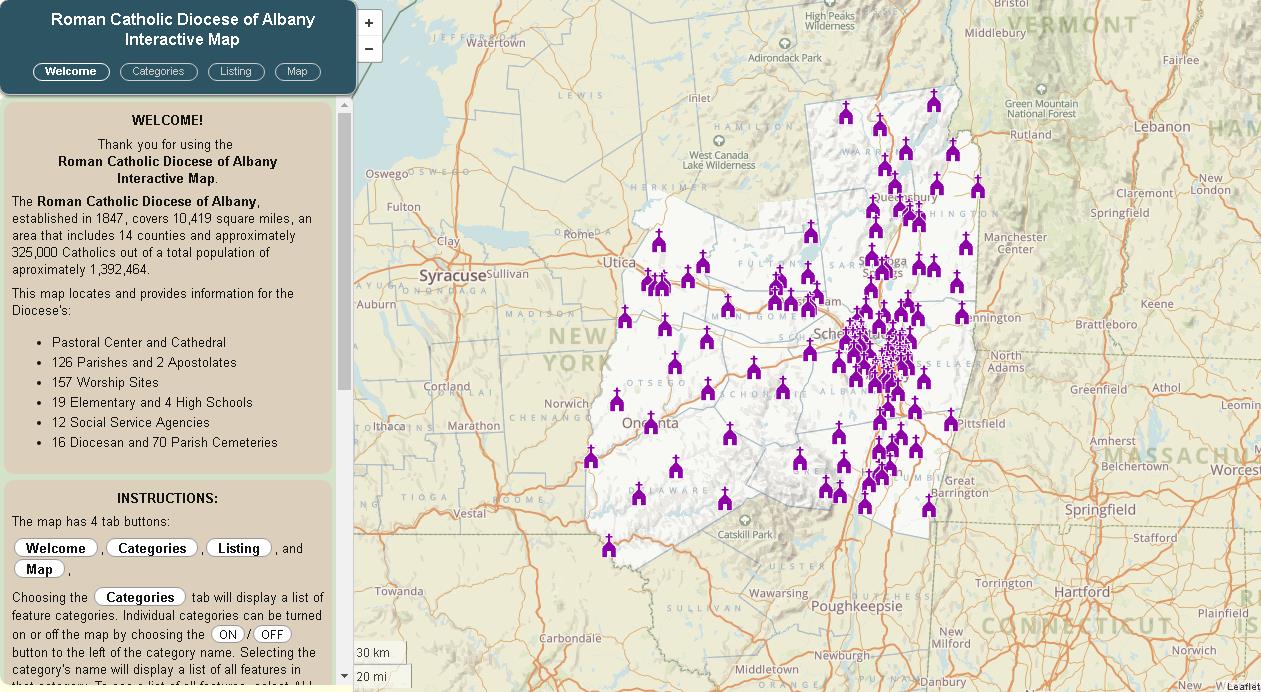
Geospatial viewers are excellent for publishing public transportation systems content. In addition to making time tables and schedules available, ones such as the GGFT also include important public sites such as health care facilities.

Today the COVID Hub is the most popular app though much simplified from early COVID and no longer maintained by the GIS team.   It’s had around 1.5 million views  since its inception in April 2020 – not bad for a county with a population of 64,000   The next most popular is the parcel viewer app (Community Map), which gets about 12k views a month.  After that, the First Wilderness website (about 7k views a month) and the Recreation Mapper which gets a couple hundred views a day, higher in the summer.  Warren County’s primary industry is tourism and is an outdoor recreation destination, so trail maps and recreational resources are popular content and Sara and Amanda spend a substantial amount of time creating and maintaining recreation data and providing access to it.

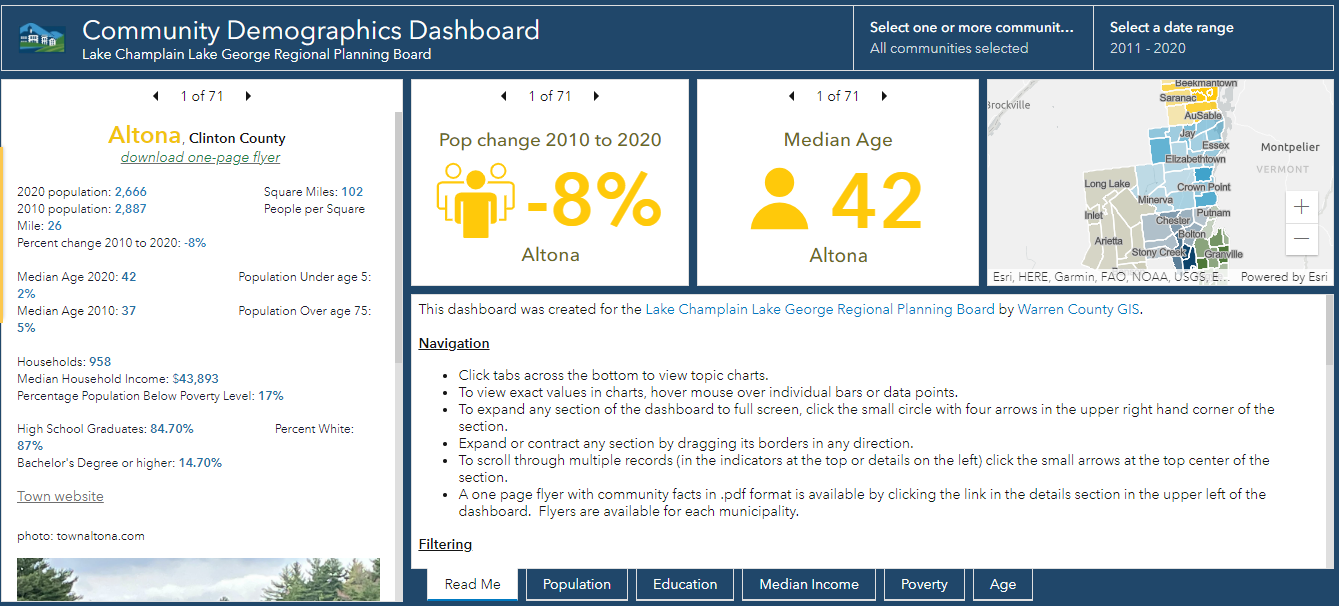
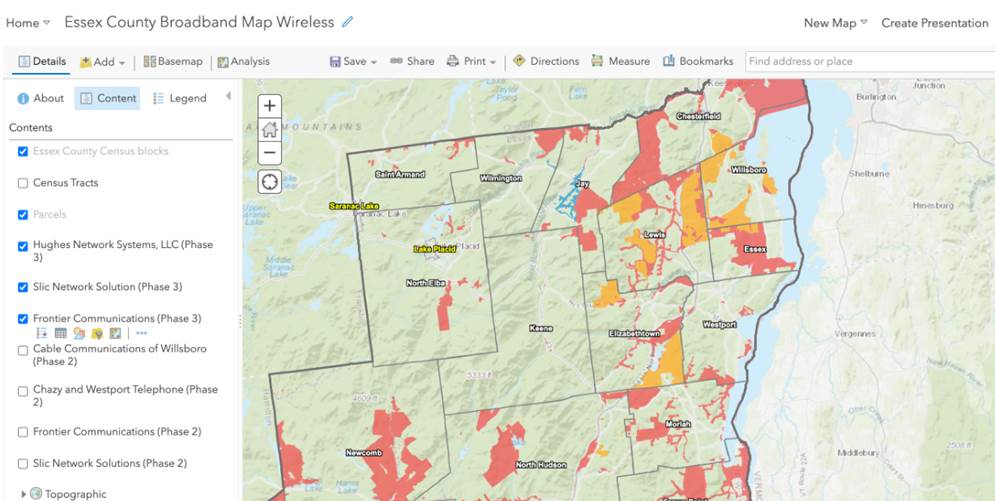
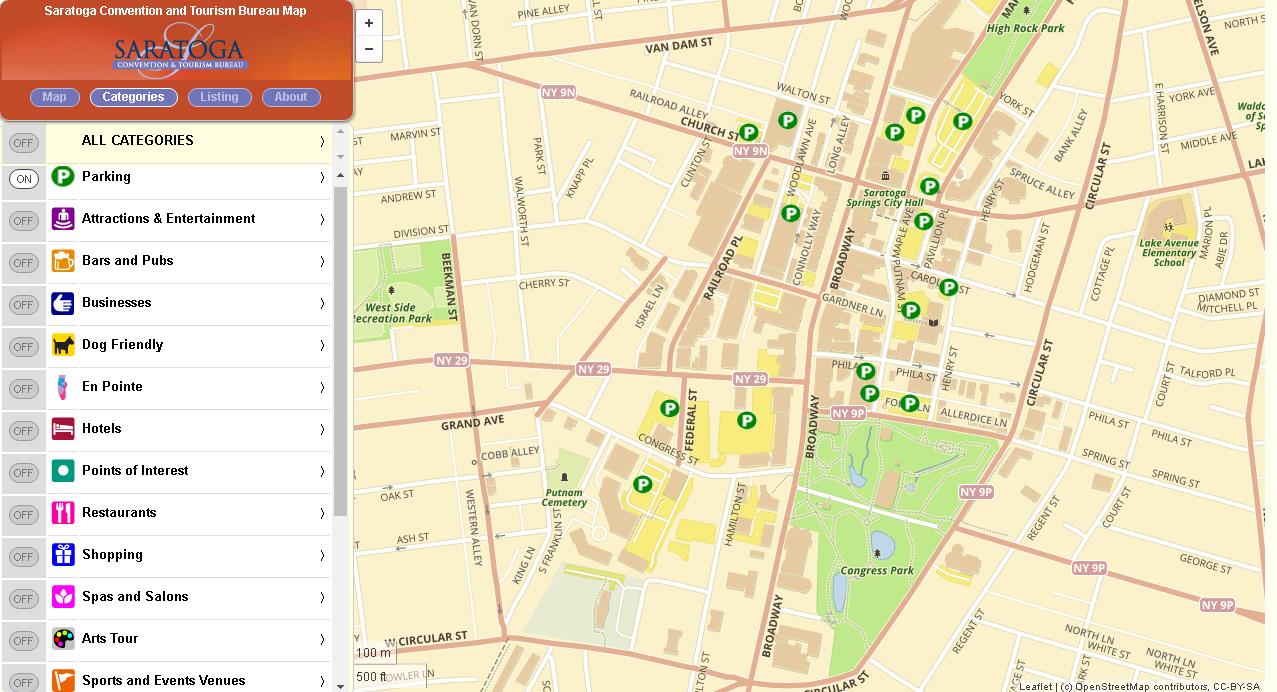
Warren County GIS provides technical support to the Lake Champlain Lake George Regional Planning Board which extends beyond the Warren County footprint. This viewer contains both American Community Survey and 2020 Census data for areas in the five north country counties covered by the Regional Planning Board

Though the application was closed in August, another public facing app focused on the American Recovery Plan Act (ARPA).  Survey123 was customized to create an application for those organizations interested in applying for ARPA funding.  The applications were made available to committee members for review through a Dashboard, and scoring was completed using another Survey123 form.

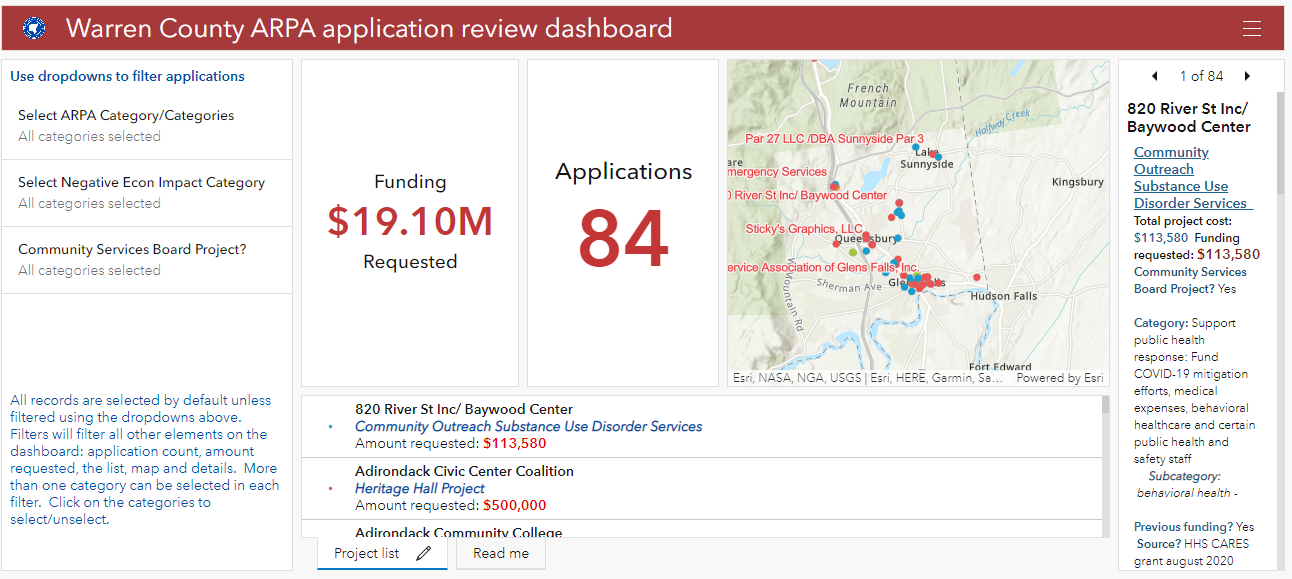
American Recovery Plan Act (ARPA) grant monies provides funding for investment in a wide ranges of community programs and services including geospatial efforts in the rehabilitation and mapping of infrastructure systems.

Sara’s Law

There probably aren’t many geospatial professionals working today across the Empire State that are familiar with Sara’s own little piece of New York State GIS history.  The year was 2002 and it was during her first stint with Warren County.  While using a GPS unit to map the locations of fire hydrants in the North Creek area, she was “challenged” by the professional surveying community of mapping features in a manner/way she was not qualified to do so.   Her post to New York State GIS listserve at the time describing the events read:

“In January, I(Sara) was contacted by an investigator from the New York State Education Department’s Office of Professional Discipline.  They had received a complaint from a surveyor stating that I was surveying without a license.  I was using a Trimble Pathfinder Pro XR GPS unit to collect fire hydrant locations and then plot them on a reference map.  Two investigators met with myself, our planning director, and our county attorney.  The investigators were unfamiliar with GPS and GIS and were basically on a fact-finding mission.  The investigation has progressed, and today we met with the two investigators, an attorney from the Office for Professional Discipline and a surveyor from the New York State Board of Licensed Engineers and Land Surveyors.  The state’s attorney told us at the beginning of the meeting that after reviewing the facts in the case, they do feel that we are guilty of practicing surveying without a license.  She then gave our county attorney a chance to state our case, which I thought he did very well. We were informed that the board will make a decision within the next week.”

At the time, it WAS a really big deal in the statewide geospatial and surveying communities – particularly New York State Association of Professional Land Surveyors (NYSAPLS) and the subject of much discussion and debate.  Significant in that it marked, for the first time, the visible intersection of emerging GIS/geospatial technologies and the professional discipline of surveying – and by extension, engineering in New York State.    While legislation (A01927 & S04396) was proposed in the 2007/2008 timeframe looking to “enhance the definition of land surveying with current standards and tools, i.e., GPS”, nothing was ultimately passed.  And along the way over the course of several years, the discussion and the proposed legislation became known as “Sara’s Law”.  

Little did she know the backpack GPS unit she was using in 2001 in North Creek would one day be the beginning of bringing these different, but similar geospatial technologies together as they are today.   Sara’s place in NYS GIS lore is secure.  

Summary

In addition to the broad presence the Warren County GIS program has throughout county government, it also represents the great relationship and guidance county geospatial programs can provide and offer to local governments.   Local governments that often have both limited financial and technical resources can benefit greatly from county GIS which have technical expertise and infrastructure in place.  A model that can be replicated in other areas across New York State.   

Contact

Sara Frankenfeld
GIS Administrator
Warren County GIS
Warren County Municipal Building
Lake George, NY 12845
frankenfelds@warrencountyny.gov
518-761-6410

Hard Copy Maps Still Rule: NYS Agricultural Districts

The art form is still alive as counties design and create maps as part of the Agricultural District Certification process

I’ve written about agriculture in New York State before in context of the farming community continuing to evolve with the adoption of geospatial technologies. With farmland covering nearly 20% of the state’s geographic footprint, its easy to see why geospatial tools are so increasingly important in managing the state’s prime agricultural lands.  And one does not need to look far to see the advancements of new geospatial technologies in New York State agriculture, particularly with the recent Systems and Technologies for Remote Sensing Sensing Applications Through Unmanned Aerial Systems (STRATUS) conference May 23-25, 2022 at SUNY ESF in Syracuse. Several papers and even dedicated tracks of papers and presentations focusing on UAV/drone technology in agriculture.

And it’s big business, too. A November 2021 article published by NY Business Agribusiness Column: Economic Impact of Agriculture in New York State stated that “agriculture in New York State contributed $43.6 billion in total industry output, 160,100 jobs and $12.3 billion in gross domestic product across the state economy.” It’s a rather amazing article with many more figures on how agriculture impacts the statewide economy, The article is based on the work and research of Todd Schmidt, an associate professor with the Charles H. Dyson School of Applied Economics Management at Cornell University.

Which makes it all the more interesting in 2022, even with the fledgling agritech applications and the almost complete conversion and automation of our mapping, cartography, and business/financial systems, the certification of agricultural districts in the state still involves the use of an iconic piece of mapping and cartography: The hardcopy map. Yes, while the digital data/products in producing the hardcopy maps are used and repurposed in many useful and productive ways across the state, it is still the hardcopy map which is used as part of the agriculture district certification process by NYS Department of Agriculture and Markets (AgMkts).

Background

Since 1971 , the Agricultural Districts Law, Article 25AA of the Agriculture and Markets Law (AML), as administered through (AgMkts), has reflected state and county level efforts to preserve, protect and encourage the development and improvement of agricultural land for the production of food, fiber and other agricultural products. As districts are created, or modified during renewal, maps are generated, based on tax parcels included in the districts. Each county is responsible for creating maps to meet the requirements of the Agricultural Districts Mapping Program. Supporting AgMkts in this regard is Cornell University’s Institute for Resource Information Sciences (IRIS) has helped facilitate the mapping program since 1977. Its primary responsibility is to support agricultural district mapping efforts by reviewing, distributing, and archiving agricultural district maps, and to provide consultation services. Automation of the statewide district maps began in earnest In 1996 when the entire set of NYS Agricultural District maps in the collection of Cornell IRIS (formally CLEARS) was converted to digital format. This was done by shipping blueprint copies of the maps to the NYS DEC for scanning.

Article 25AA references maps several times in Section 303 as a required deliverable for certification of a district. Specifically the text includes “The district review plan shall include a description of the district, including a map delineating the exterior boundaries of the district which shall conform to tax parcel boundaries”Agricultural districts across New York State are reviewed and certified on an eight-year cycle.

The Map

It’s a real treat anymore to show up at a meeting or discussion and be given the chance to review a traditional, well designed hard copy map. Increasingly becoming rarer and rarer. And just think how much less demand there would be for hardcopy maps if it wasn’t for the ubiquitous use and sharing of the PDF file format? For so many years, the 1:24,000 map was one of the most commonly used map design and layouts following in step with the classic U.S. Geological Survey 2000-scale quadrangle grid series. And yes, it just so happens the required base map standard for the agricultural district maps, as outlined in the Agiriculture Districts Program Mapping Checklist prepared by IRIS, is 1:24,000. According to Diane Ayers, who provides staff support to the mapping program, “IRIS recommends either the NYS DOT 7 ½ minute planimetric map series (available in either raster or vector format) as the base map for individual County mapping products.

The 32-page document consists of written requirements covering topics such as, but not limited to, map content including roads, civil boundaries, and water features, as well as traditional map items such as north arrows, keys and legends, scale bars, and the bounding geographic coordinate grid.  Documentation on the source of base map data, other data layers, year of parcel data, and geographic reference information (datum, projection, etc) is also recommended.   It also includes several pages of examples covering a wide range of other hardcopy cartographic principles including annotation, color selection, and symbology.  Many items which cartographers and map makers have greater flexibility in controlling when using desktop client software vs. web mapping cartographic tools. 

Appendix 1 in the Mapping Checklist document shows examples of how to render the district boundary as the most prominent feature on the map

While counties send all review materials associated with the eight-year review, including tax parcel information, directly to AgMkts, the county produced hardcopy map and shapefiles are sent directly to Ayers.   She reviews the maps for consistency with the mapping checklist and then forwards to AgMkts and uses the shapefiles to maintain a consistent a set of statewide district maps which are available via CUGIR.  The statewide coverage she maintains based on this relationship and data exchange with the counties can be found here.

The 2022 Ontario Agriculture District Map as produced by IRIS. Shapefiles and documentation received from counties enables IRIS to maintain a statewide agricultural district coverage.

Sheri Norton is the GIS Coordinator for Ontario County, located in the Finger Lakes region renown for viticulture and other agricultural products. She has been through three district reviews including a large countywide consolidation in 2021. “Agriculture District mapping is a big effort with partnership between our Planning, Real Property and GIS Program staff”, she says, “but with my previous experience in producing the mapping products for IRIS and becoming more comfortable with ArcGIS Pro, the map series and formal reports are now easily updated for the next review cycles.  The ArcGIS client is all I use.”   Which is quite an accomplishment, as keep in mind many final cartographic products are often “touched up” before final publication with other desktop publishing software such as Adobe Illustrator. The certification also includes generating a list of all tax parcels in the district(s) based on the county assessment roll.

Sheri Norton’s 2021 Ontario County Agriculture District One map designed and produced entirely with desktop GIS software.  This same map was provided to AgMkts as part of the review and certification process

Summary

Hard copy maps are as close to GIS comfort food as we can get.   And here in New York is refreshing to see how this important piece of our cartography past is still being used in a government regulatory program.  Holding its own against all of the advancements – and acceptance of digital web mapping.  Kudos to GIS professionals across the state who are still producing hardcopy maps and helping the product remain relevant as part of the profession.

Agricultural Districts protect and promote the availability of land for farming purposes.  For informative overview of this important Empire State Program review this presentation.

Contact

Diane Ayers
Data Manager and Educator
NYS Agricultural Districts Mapping Program
Cornell IRIS
1015 Bradfield Hall
Ithaca, NY 14853
dag10@cornell.edu

Sheri Norton 
GIS Coordinator, GISP
Geographic Information Systems Program
Ontario County Information Technology Department
70 Ontario Street
Canandaigua, NY 14424
Sheri.Norton@ontariocountyny.gov

Jeff Kehoe 
Farmland Protection Specialist
Department of Agriculture and Markets | Division of Land and Water Resources
10B Airline Drive
Albany, New York 12235
jeffrey.kehoe@agriculture.ny.gov

Cash Savings: Affordable Geospatial Bachelor Degrees in New York State

While putting together my last article (GeoSpatial Student Spotlight), I came across a related article that’s worth a quick mention.  In the same academic space, it is an article by the online site Affordable Schools which is essentially a clearinghouse of sorts, inventorying and ranking schools  on a wide range of academic programs and professional fields on three core metrics:   Cost (affordability), class size (student-to-faculty ratio) and student success (graduation rate).  The report is entitled: “30 Best Affordable Geographic Information Science and Cartography Degree Programs (Bachelor’s) 2020”.

Albeit not in the same conversation as the more esteemed college ranking reports by Forbes, U.S. News and Word Report, or Niche, the Affordable Schools evaluation approach is relatively simple in how data is collected/evaluated and from what sources.  And yes, the bottom line focusing on affordability.  Best yet, it paints an outstanding picture of affordable traditional geographic information science/system (GIS) bachelor degrees in New York State when compared against the field across the United States.  Interesting results with four New York State schools in the top thirty with three in the top ten.  All are SUNY schools which speaks volumes to the affordability of higher education opportunities in this space across the Empire State.

Points for ranking the schools and their affiliated geographic information science/system programs were allocated in the following manner:

Those schools in New York State identified in the “30 Best Affordable Geographic Information Science and Cartography Degree Programs” (2020) include:

#30      Farmingdale State College
Farmingdale, NY 11735
Points:  6
#6        SUNY Cortland
Cortland, NY  13045
Points:  7
#3        University of Buffalo
Buffalo, NY  14260
Points:  8
#2        SUNY College at Potsdam
Potsdam, NY  13676
Points:  8

Potsdam and Buffalo ending up with the same point total but Potsdam most likely getting the slight higher ranking due to a slightly lower in-state tuition fee and Buffalo having a much higher out-of-state tuition price tag.  While University of Buffalo has been a mainstay on the Empire State higher education geographic information science/system stage for over three decades – the Farmingdale, Cortland and Potsdam programs are of more recent development. The University of Buffalo is one of the three original universities associated with the The National Center for Geographic Information and Analysis (NCGIA) formed in 1988.

Again, the caveat here is that this is 2020 data and for traditional, on-campus bachelor degree programs – which almost seems like an oxymoron in July 2021.  So while there may be some resemblance to a “return to campus” in the years ahead, the COVID pandemic has most probably changed the delivery of higher education classes and programs to some extent for good.  And with it, creating more educational opportunities, all levels,  in the online environment.  For 2020 affordable online bachelor geospatial programs, there is the OnlineU website though only with ten schools identified and none within New York State.  Though the good news with online opportunities is that there is a growing acceptance and presence across the Empire State in certificate programs and perhaps even the availability of an online Associate Degree in the future.  Such discussion will be the subject of a future eSpatiallyNewYork blog post.

Of course the programs itemized above are not the only schools in the state which offer bachelor programs in geography information science/systems, geography, and  related technologies. Four-year, masters and PhD programs are available at universities in the New York City as well as other SUNY campuses which can be identified by using the SUNY “Find Your Major” search widget here.

Spread the news.


Celebrating – and Visualizing – New York State Scenic Byways

Recent national designation highlights impressive Scenic Byways inventory across the Empire State

With little fanfare in January, the Federal Highway Administration, through the National Scenic Byways Program (NSBP), added the Palisades Parkway Scenic Byway to its list of New York State “national” designated Scenic Byways.  The Palisades designation – northern and southern most boundaries highlighted in the image below –  brings the Empire State’s National Scenic Byways total to four joining the Great Lakes Seaway Trail, Lakes to Locks Passage, and the Mohawk Towpath Byway.  These four combine for nearly 700 miles of nationally – designated scenic byways across the state.

The new nationally designated Palisades Parkway Scenic Byway, part of the State’s Scenic Byways program, originates in the south at the New York/New Jersey boundary heading north approximately 26.5 miles to just west of the Bear Mountain Bridge.

The designation augments the established New York State Scenic Byways program which includes both the federal and state designated scenic byways.  Administered through NYS Department of Transportation, the State’s Scenic Byway program was created in Highway Law (HAY 349-aa-dd) in 1995 authorizing the Commissioner of the NYSDOT to establish the scenic byways program and to coordinate the activities of state agencies, local governments and not-for-profit organizations.  Prior to the establishment of the state Scenic Byway program, the NYS Department of Environmental Conservation had a scenic roads program under Article 49 of the Environmental Conservation Law.  Those roads, along with all state parkways (listed in the regulations of the Commissioner of the Office of Parks, Recreation and Historic Preservation pursuant to Section 13.03 of Parks, Recreation and Historic Preservation Law) were incorporated into the Scenic Byway program under HAY 349-dd (k) and (l).

HAY 349-bb defines a “Scenic Byway” as a transportation route and adjacent area of particular scenic, historic, recreational, cultural or archeological characteristics which is managed to protect such characteristics and to encourage economic development through tourism and recreation.  Today, the State’s program includes the four national and 26 state designations.  A list of all designations the program is available here which includes a link to a thumbnail graphic of each byway.

State Scenic Byways Map

The January designation gave me reason to revisit a favorite piece of cartography I’ve been eyeing and wanting to write about for quite some time.  It’s a map on the Scenic Byways web page which speaks to the art of a well and purposely designed hardcopy map.  Increasingly lost as part of our insatiable appetite for interactive online mapping as the primary “cartographic” end product. Substituting the web viewer for what once was the primary GIS desktop objective:  The map.

Descriptive information and an individual map of each byway is found on the Scenic Byways homepage.

The map was created by staff in the Landscape Architecture Bureau (LAB) in the Department of Transportation. According to Christine Colley, Senior Landscape Architect and Scenic Byway Coordinator, its original creator was Marcy Sammons – who now works for another state agency.  Map revisions – to update routes and add new routes not previously included in the original map – is now the responsibility of Alexandra von Bieberstein.  Both staff are landscape architects whose background clearly contributed to the “feel” and overall simplistic cartographic design of the map. Symbology – colors, fonts, labels and shields – are all appropriately selected.   The state boundary clearly defined with green/gray green underlying base map colors which accentuates the colors representing the statewide byways. Even the limited use of selected hydrologic features – providing more context to the map than anything – as well as the limited amount of place names adds to the visual appeal of the map.  All map components combined to perfectly convey the statewide scenic byways story.

Colley notes “The map is created using ArcMap (LAB currently using version 10.7.1  although the original map may have been created using an earlier different version) and then then exported into Adobe Illustrator for editing and providing more detailed graphic enhancements.”

In absence of online mapping applications, Colley also adds that Scenic Byways staff respond to “map a specific Scenic Byway or to key locations on the Scenic Byway.  Staff also assists the public – using Google Maps to create a route – in navigating through the state to enable travelers to” requests by sending the public Google Maps “routes” from their location to:

  • Avoid parkways (which are limited access – no trucks, trailers or RVs on the parkways)
  • Encounter the most scenic route
  • Encounter the most scenic byways

For a myriad of reasons, hardcopy maps will continue to be an important product of the geospatial profession and a very special skillset to maintain.  The utility and importance of the traditional map has even been noted in online geospatial blogs and media publications in recent months.  Just last month there was an article in USA Today entitled ““Move aside, Google Maps, Apple Maps and GPS:  Why people still love their paper maps

If you haven’t had a chance, download the map and take a look.  Pan around, zoom in to larger scales and take a spin around the state.

Enjoy the views.

Contact:

Christine Colley, RLA
Scenic Byway Coordinator
Senior Landscape Architect
New York State Department of Transportation
Office of the Environment
50 Wolf Rd, POD 4-1, Albany, NY  12232
518-485-9313 | christine.colley@dot.ny.gov
www.DOT.NY.gov

Geospatial Business Spotlight: Adirondack Research

Location:                      Saranac Lake, New York

Website:                       https://www.adkres.org

Employees:                  3 Full-Time / 6 Seasonal

Established:                 2012

The Company

Adirondack Research is a small business located in Saranac Lake which focuses on building expert-backed and science based geospatial solutions.  Currently the firm’s primary focus is on applications and work involving invasive species, climate change, and socio-economics.  Adirondack Research staff includes GIS specialists, web developers, and field technicians and the company produces a retail line of recreation and way-finding maps under the brand Green Goat Maps.

Geospatial software used inside the company  includes ArcGIS Pro on the desktop and ArcGIS Online for a variety of web maps and viewers.  Field data collection is also supported by ESRI tools including Collector and Survey123.  For hardcopy map production both, Adobe Illustrator and Adobe InDesign are used.

Adirondack Research’s Director is Ezra Schwartzberg who received his undergraduate degree from SUNY College of Environmental Science and Forestry (ESF),  graduate degree from University of Kentucky, a doctorate in Entomology  from Penn State and additional post-doctorate work at the University of Wisconsin.

To date,  Adirondack Research clients include the U.S. Forest Service, Adirondack Council, Lake Placid Land Conservancy, Food and Agriculture Organization of the United Nations, U.S. Department of Agriculture, ADK Action, the New York State Department of Environmental Conservation which it has contracted for several invasive species projects, and others.   While most of Adirondack Research’s work is focused in New York State and across New England, their work has taken the firm to Lebanon as well as assisting to the development of a science curriculum for elementary schools in China.

Geospatial Products and Services

  • Environmental mapping using geographic information systems (GIS)
  • Biological inventories
  • Field experiment logistics
  • Ecosystem services assessment
  • Long-term ecosystem monitoring
  • Invasive pest management planning and analysis
  • Comprehensive management plans
  • Public outreach and stakeholder engagement
  • Citizen science
  • Grant writing
  • Expert witness testimony

Schwartzberg uses research expertise to guide processes, including program design, data analysis and project evaluation.  By combining ecological research with print and digital media, Adirondack Research is able to communicate science to help our clients reach their policy goals.

Illustrative projects include:

Surveying Adirondack Lakes for Invasive Species

Over the past several summer field seasons of 2018 – 2020, Adirondack Research was contracted by the Nature Conservancy’s Adirondack Park Invasive Plant Program (APIPP) to survey lakes throughout the Adirondacks.  Data collected during these surveys was used to produce individualized lake maps of aquatic invasive species (AIS) distribution. Objectives for these efforts were twofold:

  1. Detect and delineate any new or existing invasive plant or animal infestations within prioritized lakes.
  2. Utilize a Lowrance ELITE-7Ti fishfinder to map the vegetation beds, contour lines and bottom substrate hardness of a select set of those lakes as a way to gather important data on plant distribution and other physical parameters that influence aquatic plant invasion.

In 2018, Courtney Pond in Essex County was the first year this pond was surveyed and no AIS  detected.

Mapping invasive plant beds is accomplished using a suite of software and hardware tools including GPS, sonar detecting units, C-Map by BioBase, and ArcGIS Pro.  Data from sonar units such as Lawrance Fishfinders can be translated using third party software platforms, including C-Map BioBase and ReefMaster into a format which can be interpolated with ArcGIS Pro to create visualizations of the lake bottom.  This enables staff to assess exactly where an AIS infestation is located within a larger bed of native plants and useful overtime to monitor AIS beds and their spread.  Raster layers generated as part of the work flow are then used to generate maps in ArcGIS Pro and Adobe Illustrator for final reports.  The 2019 report is complete with maps of all lakes or ponds surveyed and can be downloaded here.

Additional information on this and similar Adirondack Research invasive species projects, visit this page.

Lake Placid & Saranac Lake Winter Trails Map

While Adirondack Research makes maps for a variety of purposes to support  geospatial analysis,  ecological species distributions and for land acquisition and conservation easements, the firm also produces a line of recreation and way-finding maps under the brand Green Goat Maps.

As part of this effort, Green Goat Maps emphasizes responsible recreation and environmental stewardship by partnering with organizations to promote principles like Leave No Trace.  Maps also make reference to the proper etiquette for publicly accessible trails, how to prevent the spread of invasive species, and information and regulations specific to the areas covered in each map. Green Goat Maps has  partnered with organizations such as Barkeater Trails Alliance, the Adirondack Land Trust, and The Nature Conservancy Adirondacks in these efforts.

One example of a Green Goat map is the region’s “go-to” map for winter recreation – The Lake Placid and Saranac Lake Winter Trails Map  – which offers all of the area cross country ski, snowshoe and fat bike trails in one document.  The map highlights the Jackrabbit Ski Trail and covers ski trails from Paul Smiths to Wilmington including the popular Hayes Brook Truck Trail, Deer Pond Trails, Moose Pond Trail, Brewster Peninsula Trails, Henry’s Woods, Heaven Hill and more.  The map also includes commercial ski centers, including the Paul Smith’s College VIC, Dewey Mountain Recreation Center, Cascade X-C Ski Center and Mt. Van Hoevenberg.  For the Winter Trails Map, Adirondack Research also added trails on private and municipal land with permissions well as adding gates and parking areas which were mapped from ground research. The top banner on each map inset also shows info about what activities people can do on each individual trail network

Additionally, Green Goat gives 1% back on the sale of its maps to nonprofits through 1% for the Planet.

For more  information on this and similar Green Goat Maps products, visit this page.

Mapping Broadband Infrastructure for Essex County

A current project Adirondack Research is working on is with Essex County (as well as four other counties) and local community leaders towards designing and implementing web mapping  visualization tools which will help support and guide expanded broadband installation across the County.   These easy-to-use geospatial tools are intended to be used by local officials in multiple governments to pinpoint gaps in infrastructure coverage. Other aspects of the project include mapping the boundaries of current broadband contracts with providers across the County, checking and verifying property addresses, and performing quality assurance on plan of record build-outs.

Broadband is only available is specific areas of Essex County. Mapping at the street level by Adirondack Research will enable government officials to work with broadband providers to expand coverage.

Contact:

Ezra Schwartzberg, PhD
Adirondack Research
73 Church St
Saranac Lake, NY 12983
www.akdres.org

The Art of Geospatial Collaboration: Allegany State Park Interactive Viewer

Cattaraugus County and Allegany State Park Share Resources and Vision

While GIS as a shared service as part of Governor Cuomo’s County-Wide Shared Services Initiative (CWSSI) has yet to take hold in a broad context across local governments in the  Empire State,  the statewide GIS community does have a great example to highlight how local governments can collaborate with a state agency in sharing geospatial technology.  Case in point:   The Allegany State Park Interactive Map viewer.

Located in Cattaraugus County in western New York abutting the Pennsylvania state line and  north of the Allegheny National Forest, Allegany State Park was created in 1921 and encompasses nearly 64,800 acres.   A major western New York State tourist attraction – the park averages  1.5 million annually – the park offers a wide range of four-reason recreation activities and lies within the Alleghany Highlands Forests ecoregion.   The idea of a joint effort between  Cattaraugus County and Allegany State Park online map viewer idea goes back as far as 2010 as part of a discussion between Daniel T.  Martonis, who at the time was GIS Manager for the County and Tom Livak who was then Director of Economic Development, Planning & Tourism.

The initial viewer was more emergency services focused with the collection of infrastructure data and intended for use by park staff only – nothing external.  Most of the data was collected by Dan and Tom, including Chris Holewinski – the current Cattaraugus GIS Manager – using various Trimble GPS units as well as utilizing old engineering maps.  The trio even brought out metal detectors to pick up the locations of pipes.   At the time, Dan was building web mapping applications with ArcIMS that Dan mentions was not “people friendly” and was ultimately discontinued by ESRI.  Along the way, though, both Dan and Tom knew they were beginning to frame a web mapping product which would be of great value to both the County and ASP.  ArcGIS Online began to emerge as a more functional and adaptable web mapping platform providing additional opportunities for the two government programs to build upon what had been started.

The ASP viewer represents the ongoing collaboration between Cattaraugus County and Allegany State Park. It provides easy to use access to a facility, environmental, and cultural data including historic aerial photography.

Continue reading

Geospatial Business Spotlight: Topographics, LLC

Company Name:                              Topographics, LLC

Location:                                          Saratoga Springs, New York

Website:                                           www.topographics.org

Number of Employees:                   3

Established:                                    2016

Topographics  provides maps and mapping solutions for a wide variety of clients throughout New York and the United States. Evolved from JIMAPCO, Inc, a long time and well recognized New York State based cartographic and mapping company, the Topographics cartographic team has over 100 years of combined experience providing printed maps, digital files, and most recently interactive mapping applications.  Their client portfolio includes a variety of municipalities, chambers of commerce, educational, religious, and medical organizations, as well as a vast assortment of business clients across the Empire State.

Products and Services

Hardcopy

Using their expertise in graphics and print production, Topographics provides printed folded maps, laminated wall and tourism maps, atlas books, and other hard-copy products for hundreds of customers. Hardcopy products are published using Adobe Illustrator. Selected New York State examples include:

Data obtained from the New York State GIS Clearinghouse provided the foundation to create this statewide elevation model map for a major upstate university.

Product for Adworkshop, which does marketing and communications for Greene County and other organizations in the Catskills.

A section of the Town of Islip (Long Island) hardcopy map. The map contains OpenSource content (OpenStreetMap), features obtained from Suffolk County GIS, and other data sources.

Additionally, Paul Hein, one of the principals at Topographics has an impressive personal portfolio of cartographic products available for viewing and purchase at www.fineartamerica.com. This is a map of the Finger Lakes Region showing elevation contours and shaded relief. Each contour interval is colored with a different shade presenting the area as an abstract map. Take a look.

Online and Mobile

Beyond hard-copy, Topographics  provides digital files used for tourism promotion, sales and marketing, realty operations, way-finding, and business development, among others. Their online maps are interactive applications displaying information ranging from business locations to recreational trails. They most often implement the Leaflet or OpenLayers open source JavaScript libraries and make use of Mapbox and Mapzen services for the styling of OpenStreetMap and custom data as well as providing geocoding and directions. Other platforms include Avenza Web Author and the Google Maps and MapQuest API.  Ilustrative examples include:

This is one of my favorites: The Roman Catholic Diocese of Albany interactive map showing facilities and services within the Diocese. The application includes hundreds of Diocese related facilities and properties which can be turned off/on with the Categories button.

The Saratoga Convention and Tourism Bureau interactive map presents hundreds of visitor resources and opportunities for those in the city or planning a visit. Using our mobile-friendly technology, users can see their current location, locate nearby resources, see walking and biking trails, and find recreational resources.

The following examples are interactive maps for both the Washington County Tourism and the Village of Chatham (Columbia County).  Click on either image to be rerouted to the actual online map viewer.

The Topographics Crown Maple Farm (Dutchess County) map below is available as a hardcopy map and also runs on the Avenza Mobile Map App so it can be “used on the trail” with a smartphone.  User’s can also record their track (their movement) including elevation. User’s can also plot points on the map and assign attributes to the points, including photos. For the Crown Maple Map, Topographics had the owner of the property actually walk the trails using a preliminary map they created for the app to capture histracks. The owner emailed the X,Y’s back to Topographics to be incorporated into the final product. Topographics has created similar maps for other clients all over the world using the Avenza app.

Summary

Far from just a traditional hardcopy cartographic mapping company, Topographics uses and combines many industry leading Open Source software components in producing and publishing their products and services to their clients.   Be informative and nice to see Topographics presenting at future New York State GIS events and conferences.

For more information on Topographics, LLC products and services:

Contact:                        Paul Hein
                                      Topographics, LLC
                                       info@topographics.org
                                       518-428-6638


Orbitist: Storytelling on the Western Front

It’s always refreshing discovering new startups and firms mixing geospatial concepts with other technology and media platforms.  Not necessarily true geospatial firms which we’ve come to label as such, but clearly operating on the fringe and providing selected products and services mainstream geospatial consultants market and provide.  One such relatively new firm is Orbitist based out of Fredonia, New York.

Orbitist is led by Nick Gunner who has been filming and directing video productions since 2007 when he began pursuing his Bachelor of Science Degree in TV/Digital Film, Audio/Radio production, and Earth Science at the State University of New York at Fredonia. During that time, Nick started building content management systems and digital mapping technology which he continued while serving four years as the university’s New Media Manager.   On the side, he continued to pursue freelance work as a public radio producer, freelance documentary filmmaker, and web developer. In the Summer of 2015, Nick launched Orbitist LLC as part of the Fredonia Technology Incubator with the idea of using digital storytelling and technology to make important information as accessible as possible.

Initial Work

The Roger Tory Peterson Institute (RTPI) of Natural History was Orbitist’s first client.   In the Summer of 2015 they commissioned a short documentary on the Chadakoin River in Jamestown, as well as map three tours about various natural history topics.  Representative examples of RTPI products can be viewed on YouTube and the bottom three links on this Orbitist web page.  During this same time period – and ongoing today – Orbitist also performed work for the Chautauqua County Visitors Bureau.

Other recent products and services include:

A Story Map documenting the Winter 1929 Tewksbury boat and bridge crash on the Buffalo River resulting in the flooding of a 18 neighborhood blocks in South Buffalo.

This Story Map uses a variety of multimedia which pinpoints cultural and historical features from different Spanish-speaking countries, including architectural feats, traditional dances, and tipping customs, among others. Each map utilizes Spanish phrases with English translations to bridge the gap between languages.

Software Suite

Relying on the experience he gained building systems for the last 10 years, software products used at Orbitist reflects Nick’s commitment to combining content management with interactive mapping – much of which is accomplished by integrating and combining leading Open Source components.   Currently the Orbitist mapping platform is a simple content management system which associates posts (internally called “points”) with latitude/longitude values.  The Orbitist team often uses Mapbox GL as a primary front-end mapping library but behind that everything in their system is API-driven, meaning story maps are created top of products such as Leaflet and Google Maps.  They also use Carto as a stand-alone product for building real-time analytics maps.  All combined, the Orbitist “system” also manages images and a variety of data (icon type, time of day, external links, etc.) and provides access to YouTube, Vimeo, and even Facebook for video hosting. GitHub is leveraged to host static web projects. Continue reading

Jonathan Levy: Cartography Remixed

Jonathan Levy is yet another geospatial enthusiast I have made contact with via the burgeoning GeoNYC Meetup group. It’s a small world indeed as Jonathan and I share some common interests including music, sports, and time spent in one of my most favorite spaces: Idaho. His path down the cartographic road might be considered a bit different than the conventionally trained geospatial professional.  However, what is coming out the other end today is a wide range of interesting cartographic products and services.  Enough for an interesting dialog and blog post – including some interesting personal stuff on the side.  Enjoy.

Jonathan Levy grew up in the Durham and Chapel Hill areas of North Carolina spending lots of time running around in the outdoors.  His dad was a huge fan of National Geographic exposing Jonathan to both the beauty and vastness of the publication’s cartographic products and at the same time taking him camping and trail hiking around  in the Appalachian Mountains.  In his teens, he completed an Outward Bound course which introduced him to orienteering and using maps for navigation and survival.

After graduation from high school, Jonathan attended Brandeis University majoring in Near Eastern and Judaic Studies with a minor in Environmental Studies focusing on conservation biology and environmental politics.  After finishing his undergraduate work he traveled to Grenada, West Indies, to teach environmental/social science to children with Dr. Dessima Williams.   Afterwards, he worked for Polaroid’s Corporate Environmental Department in Boston, MA for nine months before heading to Salmon, Idaho as part of the Student Conservation Association working with the U.S. Forest Service in the Frank Church Wilderness Noxious Weed Inventory program.  It was here he was introduced to Global Positioning System (GPS) data collection concepts and GIS software to make maps of field guides of rare plant species in the wilderness area.

Completing his internship work in Idaho in 2002, Jonathan was  given a grant towards graduate study at at Hunter College in New York City in the MA program specializing in Geographic Information Systems (GIS)  and Media during which time he was able to intern at the United Nations and the New York City Office of Emergency Management.  He received his Masters from Hunter College in 2005.

Getting Started

His first job out of Hunter College was with the NY State Legislative Task Force for Demographic Reapportionment which Jonathan notes “was very GIS heavy and really interesting”.  At this point he began picking up freelance work on the graphics side of things with TED.com, Maps.com and Not For Tourists – the latter of which was has continued to be a successful long term contract.

Along the way he has continued to expand his use of the ESRI software particularly with regard to the spatial/network analyst extensions as well as becoming proficient in QGIS and Carto. Because he extends his cartographic product beyond the what is available with GIS software, Jonathan uses Adobe Illustrator and Photoshop for graphics processing, texturing and post production. For 3D renderings he uses Cinema 4D, After Effects, and Sketchfab.

Sample Cartographic Products

Lower Manhattan Buildings:

This 3D rendering of buildings in Lower Manhattan show the years in which they were built from 1700 to the present. The gradations of dark orange to light orange correspond to the newest to the oldest buildings. The data used to create this map came from NYC Open Data.

Environs Map Series:

This series is a way of sharing Jonathan’s life experiences of favorite places and spaces in his  life through map renderings and illustrations.  It is his personal experience of specific places and the personal “visions” of that space.  He gets requests to produce custom maps for friends, family and clients who want their town or neighborhood mapped in this style. He’s currently working on a Valentine’s day gift for a client who wants a map of Roncolo di Quattro Castella in this style.  These images are created using: Photoshop, Adobe Illustrator, scanned textures and GIS data.

Jonathan notes: “I love seeing Long Island City from across the East River. The Pepsi and Long Island City signs are featured prominently although here I’ve replaced them with my sister and brother in law’s names in lieu of their recent marriage.”

Airbnb:

Jonathan notes this was a “fun” project. Using some fancy internal tools Airbnb developed, Jonathan helped map out neighborhood boundaries in 20+ cities across the U.S – including New York City.   It involved lots of research and involvement with city planners, residents and/or a combination thereof to get a feel for the individual city.

Sample of one NYC neighborhood maps – Chinatown – Jonathan researched and created for Airbnb helping users better define which areas and neighbors they are looking for lodging and accommodations.

Montauk 3D:

This was a personal project that was inspired by his time this past summer learning to surf in Montauk. He was struck by the interesting topography of the area. He took digital elevation model (DEM)  data, exaggerated the contours in Cinema 4D for effect, created custom topographic palettes and created a website that uses Sketchfab’s API to switch out textures on the 3D surface. Link to website: http://aws-website-montaukd-vr1zr.s3-website-us-east-1.amazonaws.com.  (Note:  Sketchfab recommends WebGL to display 3D content in real-time  which is a standard in most modern browsers.  Check your browser for compatibility at http://get.webgl.org/).

Amped Topography of Montauk: If you know the Montauk landscape and locations of specific geographic features (i.e., Lake Montauk and the Lighthouse – chances are you would find these renderings of the area very interesting – and different.

Loud Noise/Noise Complaints:

Jonathan also enjoys scrapping data from public web sites to develop maps and visuals.  While living on the Lower East Side of Manhattan, Jonathan created a Party/Loud Music Complaints map based on 311 data obtained from New York City’s Open Data Portal. These maps include and reflect his interest in rendering the “personality” of geospatial data through design choices – as illustrated in this map/web map – including a dark background, a purplish nighttime color palate and star animated Gifs.  Indeed an interesting map from a person who loves loud music and spends his spare time playing in a metal band!

Built with OpenStreetMap, this interactive map allows users to pan around Manhattan to see which NYC zip code has the largest number of noise complaints as filed through 311.

The Other Stuff

Jonathan always finds his legal mapping client work interesting as it requires mapping and data development to such a fine level of detail.  Often such work involves boundary disputes requiring the review of historical deeds and historic photogrammetry to determine boundary line changes. Looking forward he continues working with Sketchfab in context of mapping in the 3D space.  He supports Sketchfab because it is “accessible, light and has a community for sharing 3D models with annotation”.

As a one person shop, Jonathan does not have a large marketing and public relations budget and as such all of  his business development is  word-of-mouth.  He’s recently created an interactive presentation for a close friend and chef/owner Will Horowitz (Duck’s Eatery / Harry & Ida’s) which he presented at the Food on the Edge conference in Ireland. He’s working on an online platform, Common Scraps, which addresses the issue food waste.   As an extension he has produced some animated maps that show how food scraps can be saved and reused in an exchange system between local farms/suppliers and restaurants.

Jonathan covers a lot of ground and styles in his work which is more detailed and described on his website. Take a look, and if you are really lucky you might find him playing at a local club down the street with his band Autowreck.  Go check them out.

Though take some ear plugs and hold on.

Contact:  Jonathan Levy @ jl@jlcartography.com


Finger Lakes Trail Conference: The Reach of Digital Mapping

As a hiker myself, I first visited the Finger Lakes Trail Conference (FLTC) website in search of information about the trail system with little knowledge of the incredible structure the organization has in place for creating and publishing hardcopy and digital maps. Thus, the genesis of this article and an overview of how FLTC makes all of the digital content come together.

Background

Established in 1962, the Finger Lakes Trail Conference (FLTC) mission is to “… to build, protect, enhance, and promote a continuous footpath across New York State. Forever!”  With administrative offices near the Mt. Morris Dam Visitor Center in Mt. Morris, New York, FLTC is a 501(c)3 non-profit organization which works in cooperation with its members and various organizations to develop and maintain the premier hiking trail system in New York.   The Finger Lakes Trail System includes the main Finger Lakes Trail (FLT) from the Pennsylvania-New York border in Allegany State Park to the Long Path in the Catskill Forest Preserve. The main FLT is 580 miles long. There are six branch trails and 29 loop trails and spur trails that extend from the main FLT. These branch, loop and spur trails currently total 412 miles. Including the Main Trail and all branch, loop, and side trails, the Finger Lakes Trail System offers 1,000 miles of hiking.    Today, more than 1,400 individual and family memberships currently support the FLTC  of which approximately one fourth actively volunteer to operate the organization and its programs.  The sale of maps and GPS track data help  build and maintain the trail system.

FLTC also recognizes Sponsors which are individuals or organizations which formally accept responsibility for maintaining a length of trail in the FLT System and Affiliates which are hiking clubs and Scout troops that operate their own local hiking program and sponsor (maintain) their section of the trail system. The FLTC is a Partner of the North Country Trail Association (NCTA) and cooperates with that organization and the National Park Service in maintaining and promoting that portion of the FLT that carries the North Country National Scenic Trail.  The FLTC is also a member of the Great Eastern Trail Association (GETA) and is constructing a branch trail of the FLT system (the Crystal Hills Trail) that will carry the New York portion of the Great Eastern Trail.

The Finger Lakes Trail System main trail from its eastern terminus in the Catskills to Allegany State Park in western New York State. From their interactive web application this image also show outlines of section maps which provide detail at larger scales.

Mapping and Cartography

Since the early 2000s with advancements in GPS technology and digital data collection, trail mapping responsibilities within the FLTC have been increasingly assigned to the Trail System Management program within the organization.   Within this structure, the mapping of new and/or changes to trails fall on the responsibilities of volunteers trained in use of  GPS devices – either their own Garmin device or an FLTC-owned Garmin Montana.  FLTC maintains  detailed specifications on what GPS devices are acceptable and how they are to be configured.  The GPX file from the walk is emailed to the mapping team which is currently under the direction of Greg Farnham and Jo Taylor).    Following a very detailed process document, the mapping team uses Garmin Basecamp to edit the official, unfiltered GPX track, which is referred to as the “trail centerline”.    There is adequate iteration with the person who walked the trail and the  Regional Trail Coordinator (RTC) overseeing that section of the trail where the data is being collected to ensure an accurate rendition of the (trail) data has been collected.  Regional Trail Coordinators and other FLTC administrative positions are highlighted on the organizational chart on their website. Continue reading