10 Questions: Peter Carlo

From my level, it’s a rare occurrence any more running into someone in the geospatial field when I can make reference to Arc/INFO and AML (ARC Macro Language) without him or her giving me a big blank stare. A testament to how long we have both been around.    One of those individuals is Peter Carlo, who works for the New York City Department of Parks and Recreation in the forestry division having worked in the geospatial field for over thirty years.  Yes, learning the ropes at the dawn of GIS with command line Arc/INFO and one of the most senior GIS professionals in the vast New York City government GIS user community.  I was fortunate to catch up with him recently to discuss some of the highlights of his long career in the Big Apple.

eSpatiallyNewYork: Maybe a little of your background and where you are originally from?

Carlo:  I was born in the northern Bronx.  In my early years, the family moved to southern Vermont.  After graduating high school I briefly attended Castleton College in Rutland, VT, though eventually returned to New York City to attend Lehman College in the early 1990’s and enrolled in the geography department.  Since then I’ve lived in a couple places in the metro-NYC area but now live with my family on Long Island.

eSpatiallyNewYork:  What is your current responsibility(s) with NYC Parks Department?

Carlo: I am currently the GIS Supervisor at NYC Parks I.T. division.  Our team is made up of  six GIS specialist and our primary goal is to administer the Parks GIS central geodatabase and to support geospatial projects throughout the Agency.  These projects range from configuring Survey123 mobile data efforts to writing data ETL’s (extract/transfer/load) to our central data warehouse.

eSpatiallyNewYork: So geography at Lehman College in the early 1990s.  Where did it go from there?

Carlo: Yes, I really found the passion for GIS technology at Lehman College.  In 1991 or so I had the opportunity to build an ESRI “enterprise” GIS at the GIS lab at Lehman.  Everything from backend data to an ARC/INFO front end access.  I found a passion in setting up hardware and software solutions while configuring components like digitizing tables and then spending hours digitizing contour maps of the Bronx geology.

Soon after graduation from Lehman, I was hired by the NYC Parks Department Forestry Division and started working on the (first) 1995 street tree survey dataset, which was done by associating a tree location with an street address.  At that time, the Parks Departments Forestry offices where located in each of the five boroughs and were managing their own tree data in a disk operating system (DOS) program called Tree Manager.  I also worked with the Parks I.T. Division to setup the our first central geodatabase using SQL Server and ArcSDE.  Working with Lehman College interns we were able to map out all park athletic facilities, playgrounds and comfort stations.  This data still serves as the foundation for the Parks geodatabase.  (Editor Note:  An entirely different read on its own is the effort behind the New York City Street Survey program.  The most recent 2015 tree survey, which is coordinated by NYC Parks,  inventoried nearly 700,000 trees in the five boroughs.  Read here for more details.) 

eSpatiallyNewYork: In this capacity what are some of your current projects?

Carlo: We are currently working with our Forestry division to deploy an interagency Survey123 application that will be used during storm events.  It will be the second version of this solution.  The application will stream 311 hazardous tree request (like tree downs and limb downs) to potentially over 300 field inspectors made up of Parks, FDNY and DSNY staff to name a few. A large part of our work is making our GIS data interoperable with legacy software/data solutions.  We also participate in integrating spatial data and functions into new business and software solutions.

eSpatiallyNewYork:  Do you have a “favorite” GIS project you’ve worked on while in the NYC Parks department?

Carlo:  I would say working (about 10 years ago) on Forestry’s first mobile storm response application.  It was called Storm Mobile.  It worked on the thick IBM Toughbook tablets utilizing wireless and GPS technology, 311 integration and data from the 2005 Tree Census. That was all new stuff for us and everything worked just fine.  I made some lifelong friends during that experience and learned so much.  A majority of our mobile application use smart phones and tablets with AGPS.  However, there are some teams that use Trimble units when needed.

eSpatiallyNewYork: NYC Parks Department is an ESRI shop – what about other software programs, hardware components in your office?

Carlo:  We are using Infor EAM (Enterprise Asset Management) for a work order management software.  This is highly integrated with our central GIS database.  We also have a new group of data scientists who are utilizing open source GIS tools at a high level. Currently the Agency has over 200 ArcGIS Desktop Pro installation, Multiple SQL/SDE central data repositories and an internal data warehouse that serves as a point of access.  A lot of our ArcGIS Desktop/Pro users utilize extensions such as Spatial Analysis, Workflow Manager and Geostatistical Analyst.  We are also using Cyclomedia Street Smart and Pictometry oblique photos.

Parks is currently on a path to migrate over to a more web GIS approach to spatial data access.  We’ve been moving over to Enterprise ArcGIS 10.8 by utilizing ArcGIS Server and ArcGIS portal to build web apps, Survey123 and Collector solutions.  Around the ArcGIS Online (AGOL) framework.  This has allowed us to streamline workflows and make GIS data more accessible to non-GIS specialists.  Overall, spatial data has increasingly become more integrated throughout the Department data footprint – it is just going to continue to grow.

eSpatiallyNewYork: What other NYC departments do you work the most closely with in GIS/geospatial efforts?

Carlo: The Parks Department works closely with many of the other City Agency GIS units.  We often share data with NYPD, FDNY, OEM and DoITT.  I think interagency data and resource sharing is the next big thing for all NYC Government GIS units.  I finally imagine a central GIS data portal coming together, where all city agencies can upload standardized data that could serve as a central data store for Agencies System of records. It’s kind of the next step from the Open Data portal.  Beyond the geospatial perspective the Parks Department maintains an impressive list of partners in doing work with throughout the city system..

eSpatiallyNewYork: What’s the next big “geospatial thing” in NYC Parks?

Carlo:  I would say that it is data interoperability, web GIS and the move to cloud solutions.  For my team it’s going to be about quickly standing up “no code” data collection and analytical tools that will empower end users (subject matter experts) without them having to be GIS experts.

eSpatiallyNewYork:  Are you involved on any level contributing to the NYC Open Data portal?

Carlo: My specific unit isn’t directly involved in publishing to the portal but NYC Parks as a whole contributes significantly.  Right now I believe there are close to 100 NYC Parks datasets available.

eSpatiallyNewYork: Yankees or Mets?

Carlo:  BIG TIME YANKEE FAN!  I remember watching the Yankees during the Bronx Zoo era!

Contact:

Peter Carlo
GIS Supervisor
NYC Parks I.T. division
peter.carlo@parks.nyc.gov
https://www.nycgovparks.org/services/forestry

Geospatial Business Spotlight: VHB

Location:                      Albany, New York (30+ locations along the East Coast)

Website:                       www.vhb.com  &  www.vhb.com/albany

Employees:                 180 New York State / 1,600 Nationwide

Established:                1979

The Company

VHB’s 1,600 professionals include engineers, scientists, planners, and designers partner with public and private clients in the transportation, real estate, institutional, and energy markets, as well as federal, state, and local governments. With locations along the East Coast, including five regionally in  Albany, Hauppauge, New York City, White Plains, and Newark, VHB is dedicated to improving mobility, enhancing communities, and balancing development and infrastructure needs with environmental stewardship.

VHB’s integrated services approach leverages a robust line of applied technologies the firm has developed through experience and cooperation with clients and partners. Whether it’s utilizing geospatial technology to pinpoint demographics to enhance decision making or keeping critical projects moving forward by utilizing Big Data, VHB’s team is dedicated to uncovering innovative solutions that benefit the communities they serve.

The following sections cover a few of these technologies, but for more information, please visit VHB’s Applied Technology website.

Geospatial Products and Services:

VHB celebrates a long history with the GIS community, integrating lessons learned and best practices to each new opportunity. As an Esri Business Partner for more than 20 years, and part of Esri’s Business Partner Advantage Program (BPAP) which provides access to Esri’s developers and technical staff, VHB is positioned to understand Esri technology at the highest levels and receive treatment for technical issues and targeted assistance. Additionally, VHB is certified as one of Esri’s ArcGIS Online Specialty partners, which symbolizes the company’s extensive experience in creatively implementing ArcGIS Online/Portal technology within any organization.

Services that are offered by VHB’s GIS consultants include:

Planning Services

  • GIS Strategic Planning
  • GIS Needs
  • Assessments GIS
  • Business Planning
  • ROI Studies
  • GIS Audits

Application Development

  • GIS Web Development
  • Mobile Application Development
  • Spatial Enablement
  • System Integration: BI, CRM, document management, permitting, asset management, etc

Support

  • On-Call Support
  • Technical Training
  • Maintenance of Data of Systems Created
  • Hosting of Web and Mobile Applications

System Design

  • Requirements Analysis
  • GIS System Architecture

Correlating GIS Mapping With Data for Healthy Communities

VHB’s innovative Healthy Mobility Model utilizes GIS mapping powered by ESRI to establish a baseline health risk assessment within a designated area by correlating census and published health data with land use, urban design, and mobility data. This assessment, or community health profile, eliminates intensive and time-consuming surveying while identifying and prioritizing improvements.

With the Healthy Mobility Model, municipalities can easily distinguish alternative scenarios and identify factors with the strongest relationships to building better health outcomes while tracking improvements over time. These quantitative results within a given profile help decision-makers think more holistically and support sustainable solutions that consider social, environmental, and economic impacts.

This VHB application combines six census track level disease risk variables to calculate an overall “Healthy Mobility” score. Based on the 2018 data in the application, this Long Island census tract had an overall “Average” risk.

Decoding Parcel Data to Understand Sites

VHB has been creating web-based parcel viewers for county and local government agencies within New York State for more than 15 years.  As internet technology and Esri’s solutions changed over the years, their experienced applied technologists have constantly evolved applications to remain state-of-the-art. The core components of all systems include a suite of GIS functionality and a robust user interface that gives users extensive tools for accessing and manipulating parcel data, including searching for parcel buffers, generating assessor’s lists, and accessing assessment information. Many sites also include custom functionality such as the creation of a parcel flyer, the calculation of wetland acreage, and the displaying of documents from other systems.

VHB has implemented numerous web-based parcel viewer applications for local and county governments within New York State, including:

VHB property/parcel viewers integrate a variety of spatial datasets from local, county and state data sources. The applications provide a range of functionality at the parcel level.

Leveraging Big Data and Traffic Analysis to Keep Projects Moving

Collecting traffic data is a critical piece of advancing transportation projects. Intersect, VHB’s latest technology-driven innovation, revolutionizes the way traffic volumes at urban, suburban, or rural intersections are quantified during typical and atypical circumstances. As a transportation planning tool, Intersect combines big data analytics and traditional traffic analysis to identify traffic data at intersections more efficiently than ever before, without the need for traditional manual or electronic counts.

By leveraging big data and traffic analysis through an innovative four-step process, Intersect keeps critical projects, and Departments of Transportation initiatives, moving forward.

Turning Data into Action

Since no municipality is exactly alike, collecting data on buildings can be an incredible challenge, especially when these results are needed quickly and efficiently.

VHB’s Cultural Information Resource System (CRIS) was developed for the New York State Historic Preservation Office (SHPO) as a web-based resource information system to catalogue and manage the agency’s huge range of programs and assets. CRIS records and manages data concerning the cultural resources within the State and gives both SHPO and their partner agencies a platform to submit, review and process wide varieties of historic preservation projects—effectively eliminating bottlenecks during a review process. CRIS also eliminates nearly all physical paperwork to help streamline record-keeping.

In the wake of Superstorm Sandy in 2015, VHB launched CRIS Trekker as a mobile-friendly enhancement to CRIS to help SHPO assess the condition of historic buildings and resources within the areas affected by the storm. CRIS Trekker captures real-time data in the field utilizing an easy-to-use interface that allows users to simply fill out a form, take a photo with their device, and submit digitally. The enhanced flexibility makes submitting, storing, analyzing, and managing incoming building surveys faster and more efficient.

In early 2020, VHB launched CRIS Trekker 2.0, a complete re-engineering of CRIS Trekker based on the latest Esri GIS platform. In the field, CRIS Trekker 2.0 has been critical in keeping technicians safe and allowing building surveys to continue.

The combination of CRIS and CRIS Trekker 2.0 has provided SHPO with an integrated digital platform to enable the continued review and processing of incoming projects without interruption during the COVID-19 pandemic.

Improving Mobility & Safety in Communities

VHB designed the enterprise-level Highway Crash Geocoding & Safety Management Systems to help state transportation agency clients improve mobility and communication within the communities they serve. This future-focused technology manages the safety of community streets and roadways, streamlines workflows and processes, and helps agencies (like those listed below) deploy responses with enhanced speed and accuracy.

For NYSDOT, VHB is developing a new, customized suite of applications collectively called the Crash Location and Engineering Analysis Repository (CLEAR) system. CLEAR provides a series of modules for geocoding, editing, and managing crash data while providing tools for conducting the six-step safety management process to improve roadway safety and reduce the number of crashes, injuries, and fatalities within the state.

The CLEAR internal facing password-protected application provides NYSDOT staff a suite of tools to analyze statewide passenger and truck vehicle accident location data. Similar to all of VHB browser-based geospatial tools, the application is built on top of ESRI ArcGIS Online technology.

Managing Assets for Streamlined Capital Planning

 VHB’s Smart Asset Management and Inventory System (SAM IS) helps clients keep track of their inventory of physical assets, inspections, and maintenance so that capital planning can proceed without a hitch. The system is built on Esri’s ArcGIS Online platform and designed it to be intuitive and scalable so that whatever the need, clients can track and manage assets without over-spending valuable capital. Since it is cloud-based, SAM IS offers broad accessibility to anyone within an organization with basic Internet access. SAM IS dashboards also readily provide the information needed to help make more informed decisions and deliver projects faster, safer, and more efficiently. Available nationwide, both the City of Albany, NY, and the County of Westchester, NY, currently subscribe to SAM IS.

The VHB SAMIS application provides a wide range of functionality to clients including access to mapped infrastructure features, statistics, dashboards, and an interface connection to mobile data collection efforts.

Contact:

Steve Anderson, GISP
Director, VHB Applied Technologies
sanderson@vhb.com

Editor acknowledges the contribution of Elizabeth Arabadjis in preparation of this article

10 Questions: Larry Spraker

My guess the name Larry Spraker doesn’t need much of an introduction across the New York State and New England GIS landscape.   His work and contributions since the late 1980s to the geospatial community are many and have included efforts from academia, government, and for many years the private sector.  As well as a ton of volunteer work with GIS user groups and the like. It has been an privilege crossing paths with him in so many ways over the years.  

So depending on the time of day, I recommend grabbing your favorite beverage, pull up a chair and continue reading.  There’s a lot here.  And after you are done, close your eyes and envision Mr. Spraker in another time or comos. Or, as the immortal Rod Sterling would say on the Twilight Zone “Another Dimension”.  Under the bright lights, behind the desk, and waving his hands fevorishly.  Yup, that’s him in his new gig – performing his best Chris Berman “Swami Sez” imitation as he hosts the 6PM ESPN SportsCenter broadcast.

Enjoy.

eSpatiallyNewYork:  Let’s start from the beginning.   The Albany-area boy goes to SUNY Albany for undergraduate and then on to Indiana State for graduate work.  How and when did geography become your educational and professional focus? 

Spraker:  I originally went to UAlbany as a Communications major with aspirations to be a sportswriter. After realizing that was a tough gig that didn’t pay particularly well (at least back in the early 80’s), someone recommended Computer Science. After a few courses, I really liked programming, but hated the high-end math courses such as Calculus and Differential Equations. A minor in Computer Science didn’t require the math courses, so I went to my advisor and asked “What would be a good major with a Computer Science minor?”. He listed a number of majors that included Physics, Math, and the last one he mentioned was Geography. I had already taken 6 credits in Geography as electives, so I asked for more details and somehow this guy had a fair bit of knowledge in this area and explained just enough of cartography, GIS and remote sensing to pique my interest. I registered for Intro to Cartography and Intro to Remote Sensing the next semester and fell in love with the both courses, and quickly found my new major. I focused primarily in Remote Sensing as an undergrad, and my professor, Floyd Henderson, really encouraged me to go graduate school. At the time Indiana State University was a leading remote sensing program, having the first remote terminals into the mainframe computers at Purdue which was the state of the art for image processing software. Floyd knew the professors at ISU, wrote me a recommendation and helped me get a Research Assistantship, so I packed up my car with everything I owned and drove to Terre Haute, Indiana for 2 years and finished my Masters. Although I focused a lot on Remote Sensing, I got exposed to a lot of GIS as well, and by the end of grad school had really got the GIS bug.

As an aside, after I graduated from ISU and came back to the Capital District, Floyd called me and asked me if I would teach his Intro to Remote Sensing and Aerial Photo Interpretation classes while he was away on sabbatical that year. So I returned to SUNY Albany as an adjunct professor and taught his classes that year. When Floyd returned, I stayed on as an adjunct faculty member and transitioned to developing and teaching several GIS courses. I really enjoyed working with the students and ended up teaching at SUNY Albany for 17 years.

Continue reading

Geospatial Business Spotlight: Bergmann (GIS Services and Solutions)

Company Name:               Bergmann (GIS Services and Solutions)

Location:                               Rochester, NY

Website:                                bergmannpc.com

Employees:                        400+

Established:                      1980

Bergmann is a full service, multi-disciplinary design firm employing a wide range of professionals and practitioners in the geospatial  industry.  The company represents four decades of a culture built on the work of client-focused experts. Its core business segments include Transportation Systems, Civil Works, Building Design, Land Development, Community Planning & Design, and Program Services.  Within these areas, Bergmann’s rich portfolio of work features everything from restoration of historical landmarks, to the comprehensive bridge and highway design, to waterfront master planning.  Specific client geospatial support services include:

  • Client Consulting: enterprise strategy, system planning & GIS coordination.
  • Implementation & Support: architecture design, system configuration & optimization & technical support.
  • Software Development: software extensions (ArcGIS & Geocortex), custom solutions (web/mobile/desktop) & system integration.
  • Data Services: database design, data development, and management & data migration.

The Bergmann GIS Services team is a nationally recognized leader in the field of Geographic Information Systems (GIS).  Project Managers, GIS developers, GIS analysts, and 3D Design Specialists offer clients advanced and unique technical skillsets to solve complex information challenges. The company focuses on building strong, collaborative partnerships with clients to create applications, data, and workflows which bring efficiencies and value.

Continue reading

BuildingFootprintUSA: Setting the Foundation in Albany

Somewhat fitting a new geospatial start-up would emerge in the Albany area.   The region being home to MapInfo, an early player in the desktop GIS software market appearing at number 23 in Inc. Magazine’s annual list of the 500 fastest-growing private companies in the U.S. in 1992.   While the software product is still around, the company has since been acquired by Pitney Bowes.  Across the Empire State geospatial landscape it’s not uncommon to bump into someone working in the GIS space with ties to MapInfo.

Case in point, in 2016 four ex-MapInfo colleagues, each with over 25-years of experience in the geospatial space focusing largely on data development, went out on their own and launched BuildingFootprintUSA with the intent of providing to the geospatial industry spatially accurate and attribute rich building footprints covering the United States.  Their initial focus has to been to provide data to the location based advertising, insurance, and telecommunications industries.  In January of this year, Geoawesomeness included BuildingfootprintsUSA (BFUSA) in the 2019 Top 100 Geospatial Companies and Startups List.

BuildingFootprintUSA’s 3D model of Albany including the Empire State Plaza. Buildings are commonly attributed with addresses and assessment data.

Given that the company is only three years old and has only a handful of full-time employees, BFUSA might be considered a typical tech start-up.  However, co-owner Scott Robinson notes that the company is in the midst of significant growth with a growing list of clients nationwide.  The company is an ESRI Emerging Business Partner and is part of the START-UP NY Program in a partnership with SUNY Albany.

The fast-growing company’s catalog already includes over 90 million footprints covering 75% of the US population, several large clients and to date has not required any external funding.  Using an addressed building footprint as the foundation of their product line, BFUSA routinely connects a wide range of attribute data to the footprint including, but not limited to, census designations and demographics, assessment files, property and facility information, and business characteristics such as category and size of company.  For residential structures, detailed demographics (i.e. age, race, income, education, etc) and household profiles on consumer behavior and lifestyles are also available.  Structure height (z-value) is also included in the footprint dataset which is derived from available LIDAR databases as well generated from their own photogrammetry or other BFUSA business partners.

We are committed to data integrity”, notes co-owner Scott Robinson, “our work is essentially a  huge data curation effort – blending and harmonizing data from many different sources including open data portals, government websites, and commercial data services”.   Specific and very detailed attention is given to the spatial/positional accuracy of the footprint as well as the numerous data fields associated with the footprint.  Robinson points out that not all building footprints are created alike noting that many “single” footprints can be comprised of several offices or living spaces such commercial buildings and/or condominiums and apartment buildings.  Similarly the same footprint can have different heights (z-value) which factors into line-of-sight analyses and wireless signal studies.  He continues “It’s not uncommon to find at least 25% of the building footprints we receive from others to be off at least 100 feet”.

Specific examples of how BuildingFootprintUSA products and services are used include:

Insurance

In assessing structural risks in designated flood plains, using building footprints versus parcel centroids provides a more informed evaluation. In this example, dots represent parcel centroids. In some instances where parcel centroids are located in the flood plain, associated parcel structures may/may not be (orange and yellow) vulnerable to flooding. Both a red dot and red footprint indicate a more vulnerable property while both a green dot and green footprint imply major property assets are not subject to flooding.

Telecom

A Telco company uses BuildingFootprintUSA data to understand optimal placement of 5G network towers in NYC; based identifying what buildings the signal can reach and what are the characteristics of the building itself. In this picture residential buildings are shaded by affluence of the residents.

Location Based Advertising (AdTech)

Detailed business data attributed to building footprints can then be integrated with consumer movement data generated by mobile devices. Buffers around specific buildings can support a variety of pattern analyses which provides a very educated guess on where a mobile device has been over a period of time. Using both store visit insights and foot-traffic data, building footprint data empowers retail analytics firms and real estate asset managers to conduct live trade area analysis and give retailers insights on the characteristics of these people, and know the reasons that are drawing people to those locations.

BuildingFootprintUSA data products are currently available via ESRI Shapefiles and geodatabase (GDB) and MapInfo TAB in Coordinate System WGS84.  Later in 2019 the company plans to offer data via an API. Datasets are typically sold as nationwide coverages though smaller geographic footprint are available as well.  Data is offered by annual license with quarterly updates.

Summary

Refreshing to see a geospatial start-up emerge in Albany only minutes from the Empire State Plaza.  With the UAV technology well recognized and established from Syracuse into the Mohawk Valley Region, we can be optimistic that BuildingFootprintUSA’s success – and perhaps by extension its association with START-UP NY – will be recognized and brought to the attention of the state’s elected officials.  Highlighting both the company’s contribution to the local and state economy and illustrate how geospatial marketplace commodities are routinely produced and made available by industry.

Perhaps a start to similar industry growth in the greater Albany and Hudson River Valley region.

Contact:

Scott Robinson, VP Strategy
scott@buildingfootprintusa.com
BuildingFootprintUSA
200 Great Oaks Blvd, Suite 214
Albany, NY 12203
518-218-4444

2019 Westchester GIS User Group Meeting

Making it the largest annual event to date, nearly 200 individuals attended the 2019 Westchester GIS User Group Meeting May 16th at Purchase College. The annual event included a diverse mixture of user presentations and demonstrations for attendees representing local and county government, utilities, nonprofits,  business and industry, and academia (both college and high school programs). Faculty and facility support from the College’s Environmental Studies program and sponsorship from twelve vendors again helped enable the Westchester County GIS community to meet and discuss the countywide geospatial agenda.  And by virtue of the venue, promoting SUNY GIS educational opportunities as well.   It was a great GIS day for all attending and participating.

As the day progressed, nearly 200 registrants assembled as part of the 2019 Westchester GIS User Group Meeting at Purchase College. The main lecture auditorium was filled to capacity with standing room only by mid-morning.

2019 Agenda and Speakers

While the 2018 agenda had a specific theme, this year’s agenda was intended to be more diverse covering a wide range of topics including health and human services, pavement management systems, oblique imagery applications, training workshops, forestry inventories, public safety, mapping and visualizing the human brain, the 2020 Census, and a special presentation by ESRI focusing on accessing the County’s new planimetric datasets via web services.

Session I:  Allison McSpedon and Jeff Worden from the Westchester County Continuum of Care Partnership for the Homeless led the day off with a presentation focusing on the use of mobile technology as part of the annual Homeless Point in Time (PIT) Count taken in January 2019.  This was followed by Nancy Birnbaum, Manager of Software Architecture, Westchester County Dept. of Information Technology who presented the new Westchester County Online Community Mental Health Directory.

Managers from the Continuum of Care Partnership for the Homeless detailed the pros and cons on the use of mobile data collection technology as part of the January 2019 count. They anticipate even better results and ease of use when deployed in the next count.

Andrew Reinmann, Advanced Science Research Center, Graduate Center of CUNY and Department of Geography, Hunter College followed with the use of geospatial tools as part of the Westchester County Forestry Inventory: Mapping and Ecosystem Services Assessment.  The morning session ended with a series of lightning talks highlighting the use of the County’s new oblique imagery.

Session II: After intermission, VHB and staff from Westchester County Dept. of Public Works and Transportation discussed the new Smart Asset Management and Inventory System (SAMIS) application which was followed by an excellent demonstration on the use of Laser Scanning technology by the Westchester County Police Forensic Investigations Unit.  Patrick Gahagan, Technical Analyst at ESRI finished the morning session discussing advancements in civil engineering and surveying integration between the Autodesk and ESRI platforms.

Detectives from the County Police Forensic Unit captivated the audience on the use of laser scanning in crime scene investigations. GIS staff is now working with the Forensic Unit on integrating laser scanning data into the enterprise GIS environment.

Session III:  After lunch – and an audience participation session of GeoJeopardy – Jonathan A. N. Fisher, Ph.D., Director of the nearby Neurosensory Engineering Lab at the  New York Medical College in Valhalla provided an overview of his project called Neurodome which centers on the mapping of the human brain with an assortment of technology and visualization tools.   Daniel Wickens, Solution Engineer from ESRI then gave two overviews on “What’s New with ArcGIS Field Apps and ArcGIS Online.”  Concurrently in separate locations training classes were offered on how to use the new online CONNECTExplorer oblique imagery viewer and the ESRI “Explore Future Climate Change” tutorial.

Session IV:  The last section of the agenda was brief and included an update on mapping efforts association with the 2020 Census by Margaret Baker, Geographer, from the U.S. Census Bureau Manhattan office.  The final presentation by Westchester County GIS staff included the latest developments and anticipated upgrades to the Westchester County GIS website including the scheduled launch of the Westchester GIS Geospatial Gateway

Individual meeting presentations can be accessed and downloaded using this link.

The U.S. Census Bureau is ramping up for the 2020 Census and has a variety of mapping and geospatial products in their toolbox. GIS technology is essential in helping identify areas which have had low counts and responses.

Little Things Make it Work

I’ve written before about the small details which we believe enable the Annual Westchester GIS User Group Meeting to continue to be successful – and we’re the first to admit there is always the element of luck.  Even the weather matters.  To the extent possible, elements such as keeping the content and speakers “Westchester” focused, minimal –  if any –  registration fees, lots of time for interaction with the sponsors on the exhibit floor, and the centrally located venue at Purchase College – all matter. One of the ironies, and downsides, of having the show on a college campus in mid-to-late May is that spring semester is already over and students have fled campus.  However,  there is normally a handful attending looking for summer or full-time work and passing out resumes.    The naturally lighted vendor area in the Natural Sciences Building, albeit small, adds to the personal “feel” of the show.    Easy access and plenty of parking is also essential.  And don’t forget lots of proactive outreach to the professional organizations and societies  we work with on a day-to-day basis:  police/fire, engineering, surveying, public works, assessors, nonprofits, and the planning community.   The added message here is to encourage consultants which are supporting local governments across the county – to attend the meeting.  To learn more about accessing and leveraging Westchester County GIS products and services and how this improves service and cost efficiencies to municipalities they serve.   Individually, any of these items listed above may seem trivial,  but they all add up in delivering a show that will bring the same people back next year.

The exhibit floor was busy (and loud!) during breaks with all vendors noting interaction with attendees was good and productive. All attendees can complete a Vendor Bingo Card and be eligible for a raffle prize at the end of the day. This year’s prize was a vendor donated iPad!

Summary

Over the next couple weeks, conference organizers will be sending out a survey to both attendees and vendors to gather more detailed information on the various elements (presentations, speakers, refreshments/breaks, vendor interaction/feedback, facility issues and the like) of the show.  This information will help guide decisions about content and any changes that may need to be made, if any, about the structure of the show.

Staff will take a few months off and begin planning for the 2020 show in the fall of this year.  In doing so, we look forward to the continued relevance and position of the Westchester GIS User Group Meeting in promoting countywide geospatial development and use.

Geospatial Business Spotlight: EagleHawk One, Inc.

Company Name:                EagleHawk One, Inc

Website:                             www.eaglehawkone.com

Established:                       2016

Employees:                       6 + Nationwide network of certified drone pilots

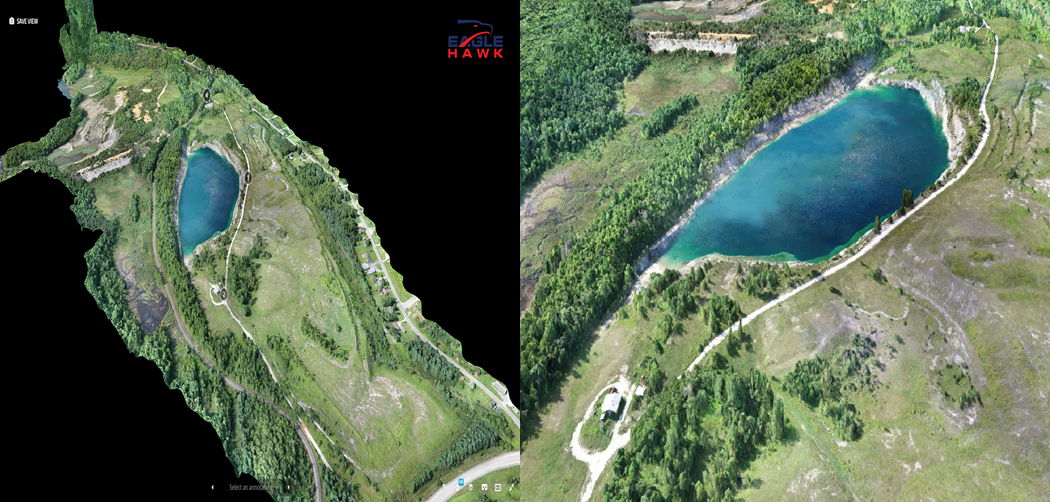
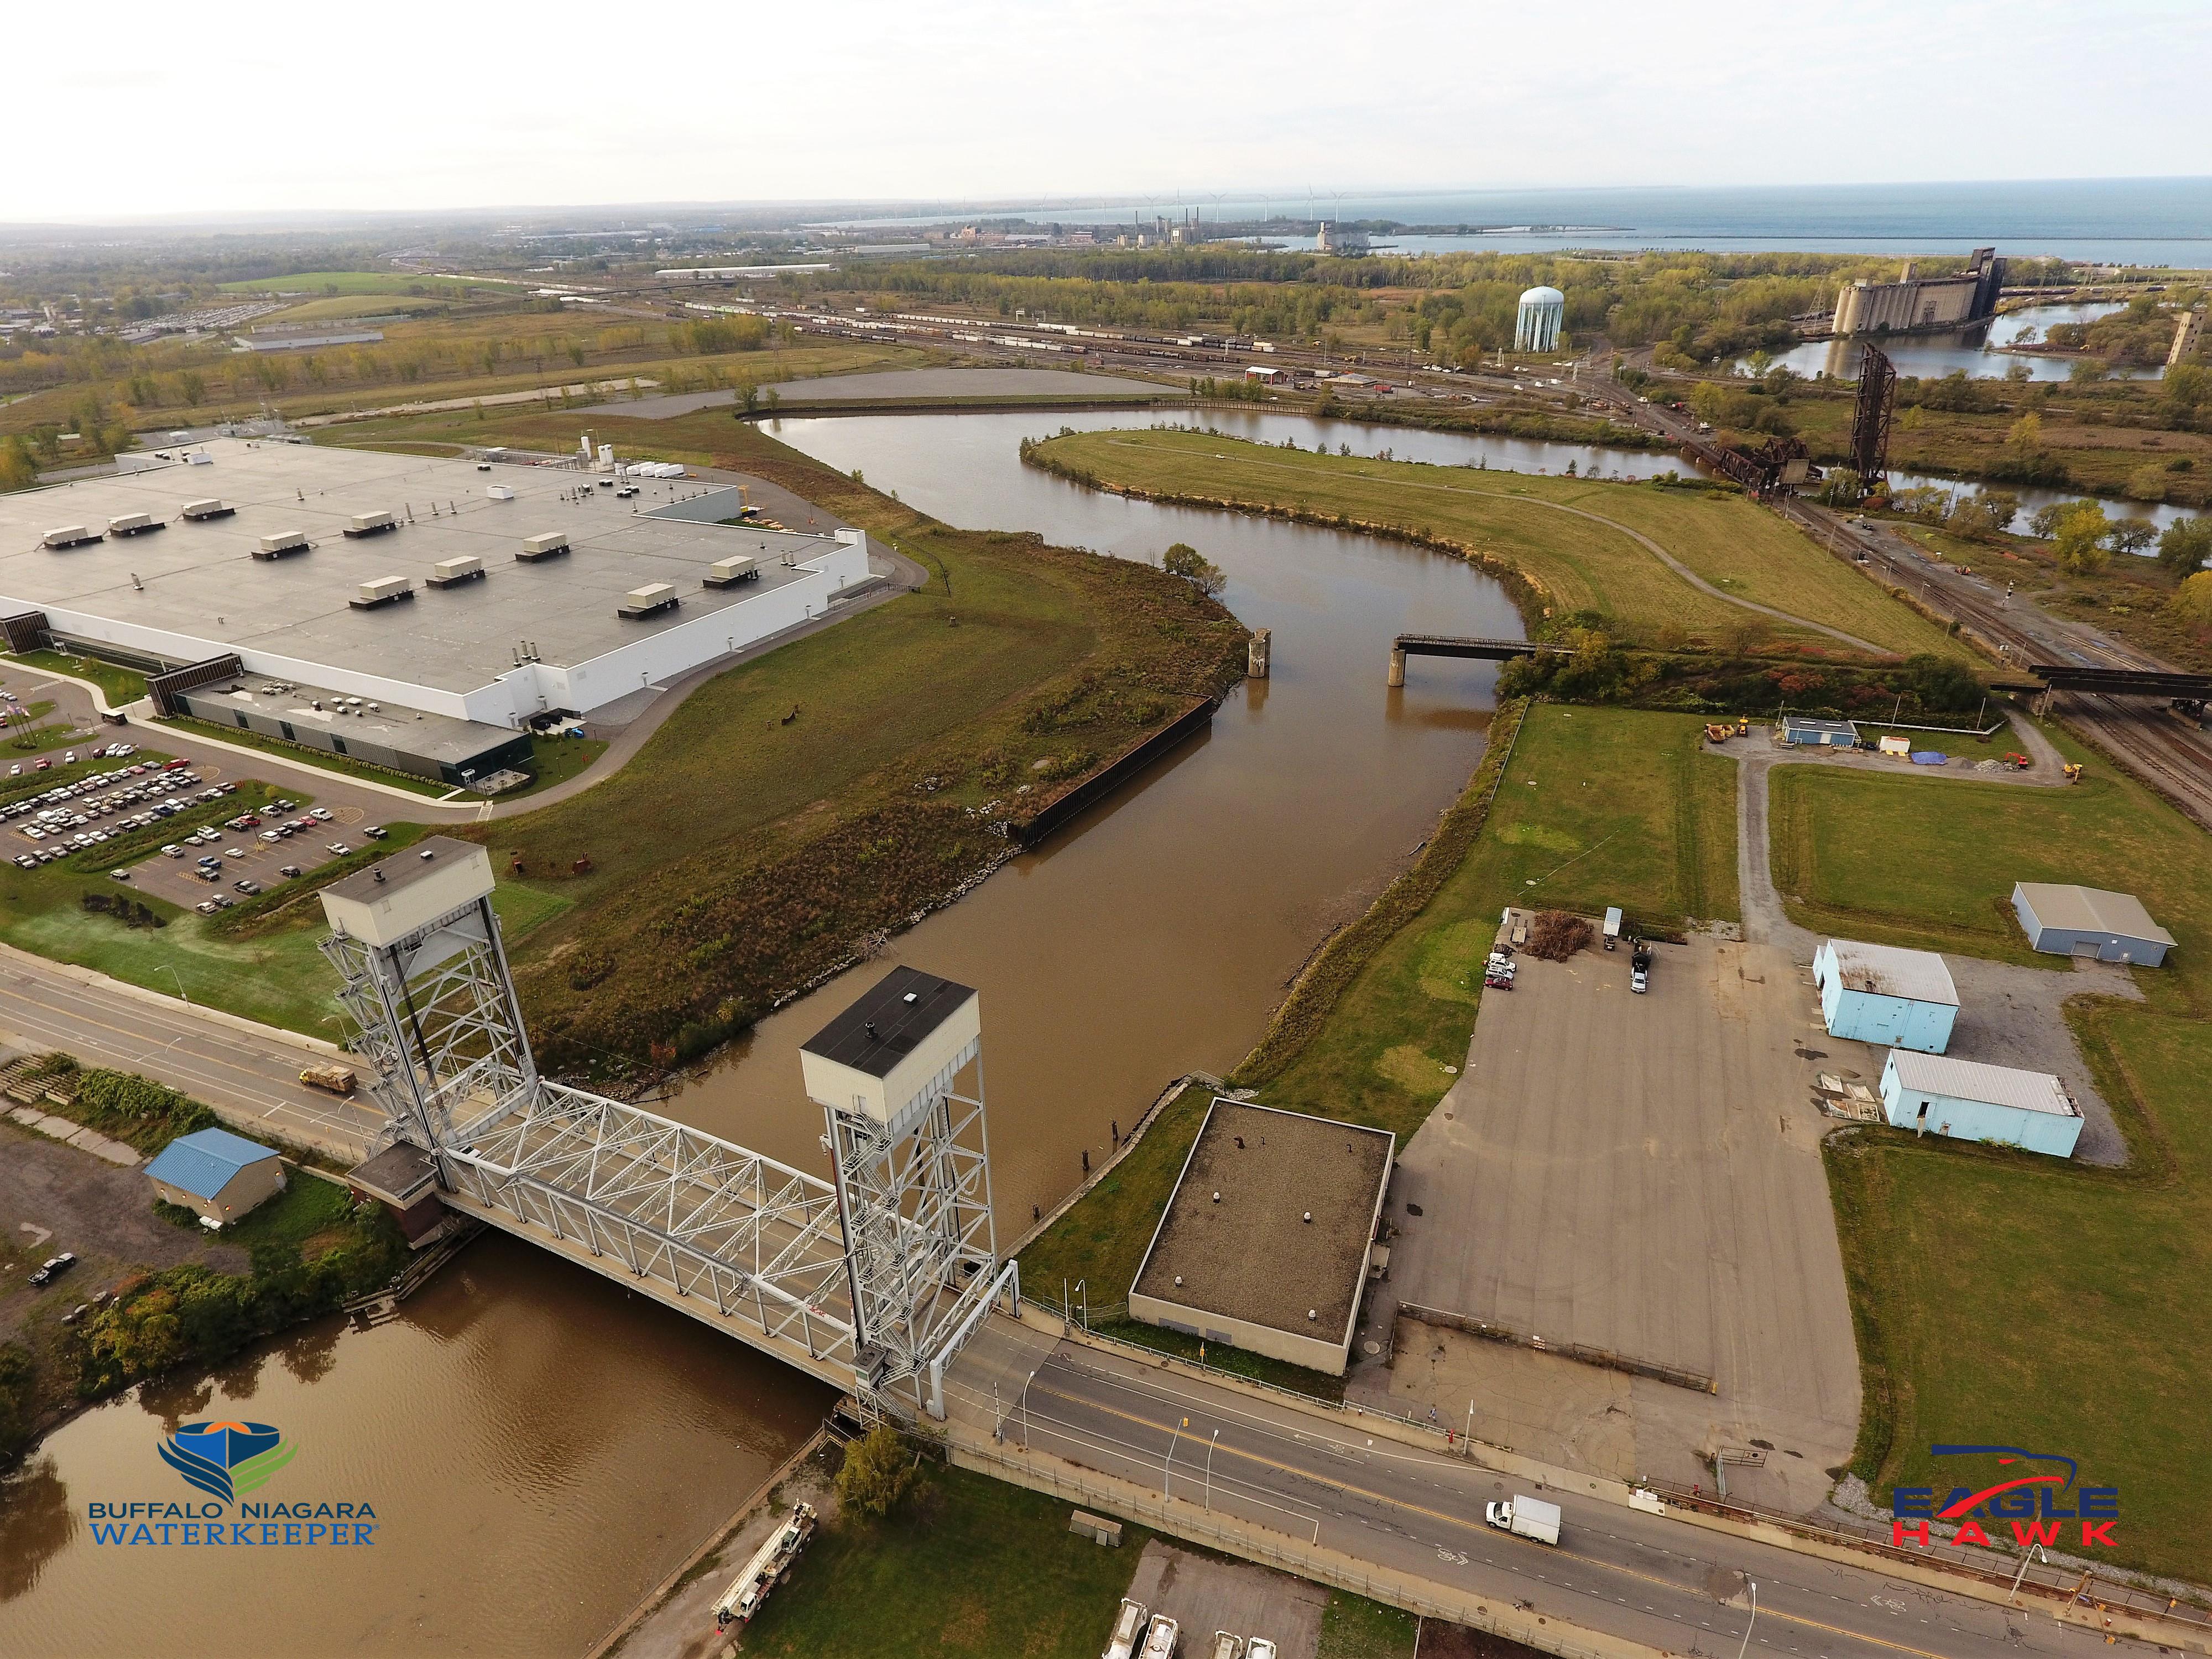
EagleHawk was founded in 2016 by Willard Schulmeister and Patrick Walsh in Buffalo, NY, and has grown to be one of the most successful drone data and services operations in New York State today. Together they bring years of technological and business expertise to the fast moving startup company. Willard has a Master’s degree in Geographic Data Science and Geography from the University at Buffalo and Patrick holds a Master’s degrees in Aerospace Mechanical Engineering from the Rochester Institute of Technology as well as an MBA from Rollins College. Both are licensed sUAS (drone) pilots with the Federal Aviation Administration. EagleHawk has recently added Jonathan Byrd to its executive team. Jon holds an MBA from Harvard Business School and has over 15 years of experience in strategy, finance, engineering, and operations, and has held leadership roles in a variety of companies and industries. EagleHawk’s professional staff includes engineers, pilots, data scientists and industry experts located at their offices in Buffalo, Syracuse, Charlotte and Orlando, as well as other remote locations in the U.S.

EagleHawk has built a solid reputation within the drone community and has completed work for over 100 customers to date, many of which are repeat clients. EagleHawk is a Launch NY portfolio company and an Esri Emerging Business Partner. They are active in the NYS GIS Association and in both the central and western NYS GIS  communities. EagleHawk recently won $500,000 prize in GENIUSNY, the world’s largest business accelerator program for drone systems and technology based in Syracuse, NY.

Geospatial Products and Services

EagleHawk provides a portfolio of specialized services, but they are most often sought out by corporations, universities, and developers for their expertise in campus-wide aerial infrared roof inspections. To date, EagleHawk has inspected over 800 buildings and has found that nearly 80% of those roofs show signs of leaking.

The company has established a routine inspection program that empowers clients with a means to proactively manage and extend the average lifespan of their roofs, enabling a logical and fiscally responsible approach to capital planning and budgeting for roof maintenance. EagleHawk is currently developing a GIS-based asset management software solution that uses artificial intelligence and machine learning to derive meaningful insights from the data they collect.

EagleHawk specializes in the following areas:

  • Geographic Data Collection and Map/Data Processing
  • University and Corporate Campus Physical Inspections
  • Aerial Infrared Roof and Building Analysis
  • Utility and Infrastructure Inspections
  • Sensor Integration with UAV’s

A more detailed listing of EagleHawk’s services can be found at: www.eaglehawkllc.com/droneservices

University and Corporate Campus Mapping & Inspections

EagleHawk has conducted several large inspections for universities and corporate campuses throughout the Eastern United States.  For these projects, the campuses are carefully mapped in order to generate useful information for the inspection, such as building dimensional information, or roof elevation profiles.  EagleHawk conducts both façade and roof inspections  using advanced thermal imagers to detect issues not visible to the naked eye. EagleHawk certified data analysts conduct a building-by-building evaluation and generate meaningful insights from the data collection.

This image, from a SUNY campus, identifies wet and areas of concern within the building roof insulation invisible to the naked eye.  These areas are within the georeferenced “red rectangles” in the upper right image.

Pre-Construction Site Analysis

For this project EagleHawk collected approximately 550 acres of map data and imagery over a rural area in upstate New York for a client. Elevation data was needed for a pre-construction site analysis in order to determine if the area was viable for development.  EagleHawk generated an orthomosaic map, elevation contours and a massive 3D point cloud which allowed for critical decision making regarding plans at the site. This project was a great example of the benefits of drones in capturing geographic data for a large site effectively and efficiently.

For this upstate project, EagleHawk used two drones with 20MP cameras to collect imagery in one field day.  Imagery captured was processed to generate orthomosaic and topographic data delivered in common GIS & CAD formats. Clients receive the data as well as access to an interactive GIS with the data.

Buffalo Niagara Waterkeeper

EagleHawk has worked with Buffalo Niagara Waterkeeper on more than a dozen different project sites throughout western New York including the Buffalo River, the Niagara River, Ellicott Creek and at Tifft Nature Preserve. EagleHawk collects aerial imagery and maps project sites to document change and also generates useful geographic data to aid in shoreline enhancements and restoration efforts.

The Buffalo River is one of eight habitat restoration projects in the Buffalo area that EagleHawk  is collecting imagery on.

Contact:

Patrick Walsh CEO – pwalsh@eaglehawkllc.com
Willard Schulmeister COO – wschulmeister@eaglehawkllc.com
Jonathan Byrd CFO – jbyrd@eaglehawkllc.com

EagleHawk One, Inc –  844-4-UAS-DATA  |   716-810-1042  | info@eaglehawkllc.com
FAA Certified Commercial Drone Operations

Digital Agriculture Continues to Evolve in New York State

Agriculture is important to New York State’s economy, and takes place in almost every region of the State as nearly one-quarter of New York’s total land area is utilized as farmland. There are a plethora of statistics which document the vastness of the agriculture industry across the Empire State:  An annual economic impact of over $42 billion, over 36,000 farms, 1.5 million head of cattle, 40,000 acres of apple trees, $25 million worth of maple syrup and 14.9 billion pounds of milk.  And #1 in the nation in the production of over 700 million pounds of yogurt.  The list goes on.

It’s refreshing to see this important statewide industry begin to intersect with geospatial in a more expanded and robust means.  The movement began to see traction a little over three years ago with the New York Precision Agriculture Workshop held in Geneva, NY in December 2015.    The goal of the workshop was to help assess the use and development of precision agriculture in New York State and was held after a directive from the New York State Legislature instructing the Commissioner of Agriculture and Markets to “issue a report assessing the use and development of precision agriculture in the state with recommendations pertaining to rural broadband accessibility, use and support for the farmer, as well as cost savings and higher crop yield.”   Over 50 individuals from the New York agricultural community were in attendance representing higher education, research, agronomic business, farmers, technology, government and more.

Nearly a year later in November 2016, the 151-page Digital Agriculture in New York State:  Report and Recommendations was published through Cornell University College of Agriculture and Life Sciences.  One of the primary recommendations which was ultimately established was the Cornell Initiative for Digital Agriculture  (CIDA).  Recently, CIDA hosted its inaugural Digital Ag Workshop October 9, 2018 on the Cornell University campus. The event was titled “Transforming Agriculture and Food Systems” and was attended by 200 individuals.  The Workshop included a wide range of presentations and resulted in the establishment of four interdisciplinary Digital Agriculture (DA) Working Groups:  Rapid Phenotyping, Socioeconomic Analysis for Digital Agriculture, Weather, Climate and Agriculture, and The Software-defined Farm.  It will be interesting to see how CIDA evolves in its outreach, research, and building partnerships with government and industry.  Cornell University was rated one of the Top 25 Best Colleges for Precision Agriculture in the United States.   For those interested in following the program, upcoming events and webinars, sign-up for updates and e-News from this CIDA webpage.

Other signs of growth in the statewide Digital Agriculture (also often referred to as “Precision Agriculture”) space augmenting CIDA’s mission includes a recent  ESRI press release announcing Ag-Analytics which is part of their Emerging Partner Startup Program.   Ag-Analytics offers a platform with tools that make utilizing farm data easier than ever. Built around the Software-as-a-Solution (SaaS) framework, Ag-Analytics offers farmers the ability to better manage and visualize their production records to make informed decisions when it comes to understanding risk.  As farm equipment manufacturers become larger and prominent players in the Digital/Precision Agriculture development, it is no surprise that the Ag-Analytics program is integrated with the John Deere Operations Center.  Faculty from the Charles H. Dyson School of Applied Economics and Management at Cornell University are involved with the Ag-Analytics program.  We also saw in 2018, DropCopter, an agricultural technology startup funded through the GeniusNY drone incubator in Syracuse, which managed to pollinate apple orchards in Lafayette, New York using their hexacopter drone. The recent decline of bee populations has raised pollination prices significantly, creating a market for alternative technologies such as Dropcopter.   Evolving in other areas, we would anticipate seeing government program areas such New York State Agriculture and Markets and/or the  New York office of the USDA Natural Resources Conservation Service (NRCS) begin to build some level of digital/precision agriculture capacity as well.

On a related note at the federal level is the passage of the Precision Agriculture Connectivity Act of 2018.  With the focus of the bill  to “identify and measure current gaps in the availability of broadband Internet access service on agricultural land”, the bill assigns responsibility to the USDA and FCC to “develop policy recommendations to promote the rapid, expanded deployment of fixed and mobile broadband Internet access service on unserved agricultural land, with a goal of achieving reliable capabilities on 95% of agricultural land in the United States by 2025”.  Kudos to the National Society of Professional Surveyors (NSPS) working to successfully amend language in the original bill to ensure that members of the task force assembled to make recommendations include “representatives with relevant expertise in broadband network data collection, geospatial analysis, and coverage mapping”.

No doubt, exciting developments for the agriculture industry across the Empire State and great opportunities for the geospatial community to contribute and be part of.

Retail Trade Geospatial Mapping and Analysis

There is no secret of the increasing use of GIS technology in the real estate industry due to the latter’s overwhelming interest and dependency on LOCATION.  For real estate professionals, location is always one of the determining factors influencing property value.  Geospatial technology provides the foundation for many common real estate tasks including  property research, market analysis, spatial analysis, matching tenants to available properties, plan market expansion and contraction, as well as staying abreast of changing consumer tastes and local demographics.  The expanding availability of business and marketplace datasets, online property (records) and land information systems, and more friendly and accessible enterprise web-based  geospatial software tools enables real estate firms building geospatial capacity to act more quickly than their competitors.

One Empire State firm which has embraced and is currently expanding it’s GIS infrastructure is the The Shopping Center Group (SCG).  A more focused group within the company is called SCG Retail which is located in Manhattan and concentrates on retail real estate properties in urban environments not specific to shopping centers.  It is in this office where primary SCG GIS resources are located providing geospatial support and guidance to other SCG offices in the United States.   Established in 1984, SCG is a retail-only real estate company providing advisory services to tenants, landlords, developers, investors and financial institutions.  With 22 offices from New York to Southern California, it is the largest commercial/retail-only real estate firm in the United States.

Sample SCG-Retail map of “targeted” neighborhoods in southern Westchester and Fairfield (CT) Counties. SCG-Retail uses ESRI’s Business Analyst to estimate the number of total employees who work within a defined area to generate a general idea of daytime population/employment hubs.  Rent ranges (Est. rent per square foot of retail space) is provided by brokers and business partners.

The SCG-Retail GIS operations are built on top of the ESRI GIS platform to conduct their industry leading mapping and demographic studies.  Connected offices utilize ArcGIS Server services, ArcGIS Online, and selected ArcGIS client programs.  In the Metro NYC region, SCG GIS staff utilize a variety of datasets as part of their market and site specific analysis including ESRI’s Business Analyst and Tapestry Segmentation products and in the a variety of public (Metropolitan Transportation Authority [train, bus, subway ridership], New York City [property/parcels, permits, bus ridership, etc]) and other commercially available real estate and consumer databases. Directing the SCG Retail geospatial efforts its New York City office is Will Parra who joined SCG Retail after working with Sanborn Mapping Company in Pelham, New York.

“SCG Retail’s use of GIS has grown significantly over the past 24-26 months” notes Parra, “it is used and integrated into all of our business decisions”.  Illustrative of SCG-Retail’s work is their recent 125th Street Corridor retail analysis in Harlem, New York – with the world famous Apollo Theater near the center of the study area.   To assess current and anticipated demographic changes in this area of Manhattan and how these trends will effect the potential retail trade landscape,  SCG-Retail GIS staff employed a variety of databases and mapping/analysis tools which enables staff to utilize custom designed GIS tools to establish potential consumer movement patterns in the study area during daytime and evening hours.  The resultant findings of their analysis, as highlighted in this StoryMap, identifies the 125th corridor, particularly the western end, as an excellent area for commercial retail growth and development.

Chase Welles, Partner, SCG Retail comments “Within the last 24-36 months, GIS technology has become an essential tool in working with clients and defining potential retail trade areas.  SCG Retail always had access to U.S. Census and demographic data, estimated consumer trade and drive-time zones, the ability to place potential consumers in defined locations at specific times of the day (AM/PM) via mobile device (smart phone) generated X,Ys  has been a game changer for us working in this space.  This mash-up of new consumer locational data with traditional Census, consumer spending patterns, and other GIS overlays is a very new, powerful, and emerging market analysis tool.”

When representing clients, a basic SCG-Retail map product is a radius map (typically .5 mile radius around a specific address) which provides a basic understanding of the demographics in a given designated trade area. Data is generated using ESRI Business Analyst Online.

Using data collected by mobile devices, The Shopping Center Group developed this map in ArcGIS Desktop to highlight the differences between where people who frequent Colonie Center in Albany, New York, live and where they work. This information is then used within Esri Business Analyst Online to uncover the slight variations in both the demographics and the psychographics of Colonie Center guests.

Learn More About SCG

SCG Retail GIS work has been featured in a February 2017 ArcNews article as well as in an ESRI Case Study YouTube video.  In 2016, The Shopping Center Group was also recognized at the annual ESRI User Group Conference with a Special Achievement In GIS (SAG) award.  Additional information and background on consumer research and analysis in the shopping center industry, visit the International Council of Shopping Centers (ICSC) website.

Contact Will Parra, SCG Retail, at wparra@scg-retail.com.

Geospatial Business Spotlight: The CEDRA Corporation

Company Name:         The CEDRA Corportation

Location:                     1600 Mosley Road, Suite 500, Victor, NY  14564

Website:                      http://www.cedra.com

Employees:                 12

Established:               1985

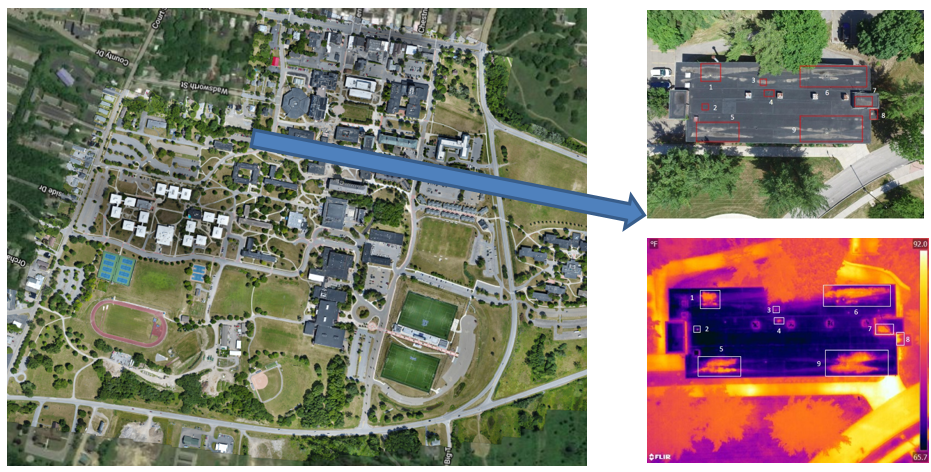
The CEDRA Corporation offers GIS based software for mapping, civil engineering design and modeling, surveying and database maintenance applications. CEDRA’s AVseriesTM suite of software operates directly within Esri’s GIS software (ArcGIS® 9.x and 10.x), thus eliminating the need to switch back and forth between various software packages. CEDRA software is developed entirely in-house and marketed worldwide to public works agencies, tax assessors, utilities, municipalities and private sector companies.

Complementing CEDRA’s Software Development Division is CEDRA’s Professional Services Division which has performed consulting projects throughout the U.S. and specializes in developing, populating and maintaining GIS databases.   CEDRA’s Professional Services Division offers consulting services to clients for a multitude of applications including CEDRA-specific software solutions or can be totally non-CEDRA software related consulting projects. CEDRA staff is highly proficient in GIS Analysis, Data Capture, Data Conversion, Map Production, Routing and Custom Application Development in toth the desktop and server environments.  As an authorized Esri business partner and reseller, CEDRA has a long history in the use and application of Esri’s GIS suite of software dating back to 1987.

CEDRA’s corporate mission is to provide services and software that improves the efficiency and productiveness of its clients. This goal is achieved by (a) developing software that is production oriented and (b) offering services that enable clients to streamline workflows. CEDRA believes the more automated a workflow can be made, the more efficient a client will be and a higher quality product will be produced. CEDRA offers Expertise, Experience and Commitment when undertaking a project.

Illustrative CEDRA products and services include:

Wayne County E911, Lyons, New York

Under this project CEDRA assisted Wayne County staff in developing the County’s E911 street database. Specifically, the work involved acquiring the NYS Street Address Mapping (SAM) data, extracting the street data for Wayne County, and working with the County in verifying and updating the street center line database for use in the County’s E911 system.

In performing this work, CEDRA staff was on-site at the County’s office performing the work and training County staff in the process. A workflow was developed and adopted by the County. Additionally, a training guide was developed enabling County staff to maintain the street center line data with their own resources. Continue reading