The Definitive Map for New York State Media Arts

New Online Application Shows Locations and Services for Organizations and Artists Across the State

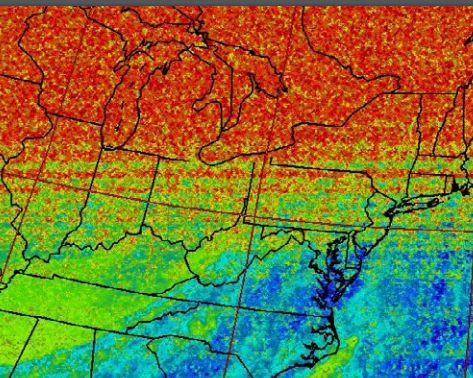
Image from Heidi Neilson’s Southern Florida Beachball Antenna Archive (2017)

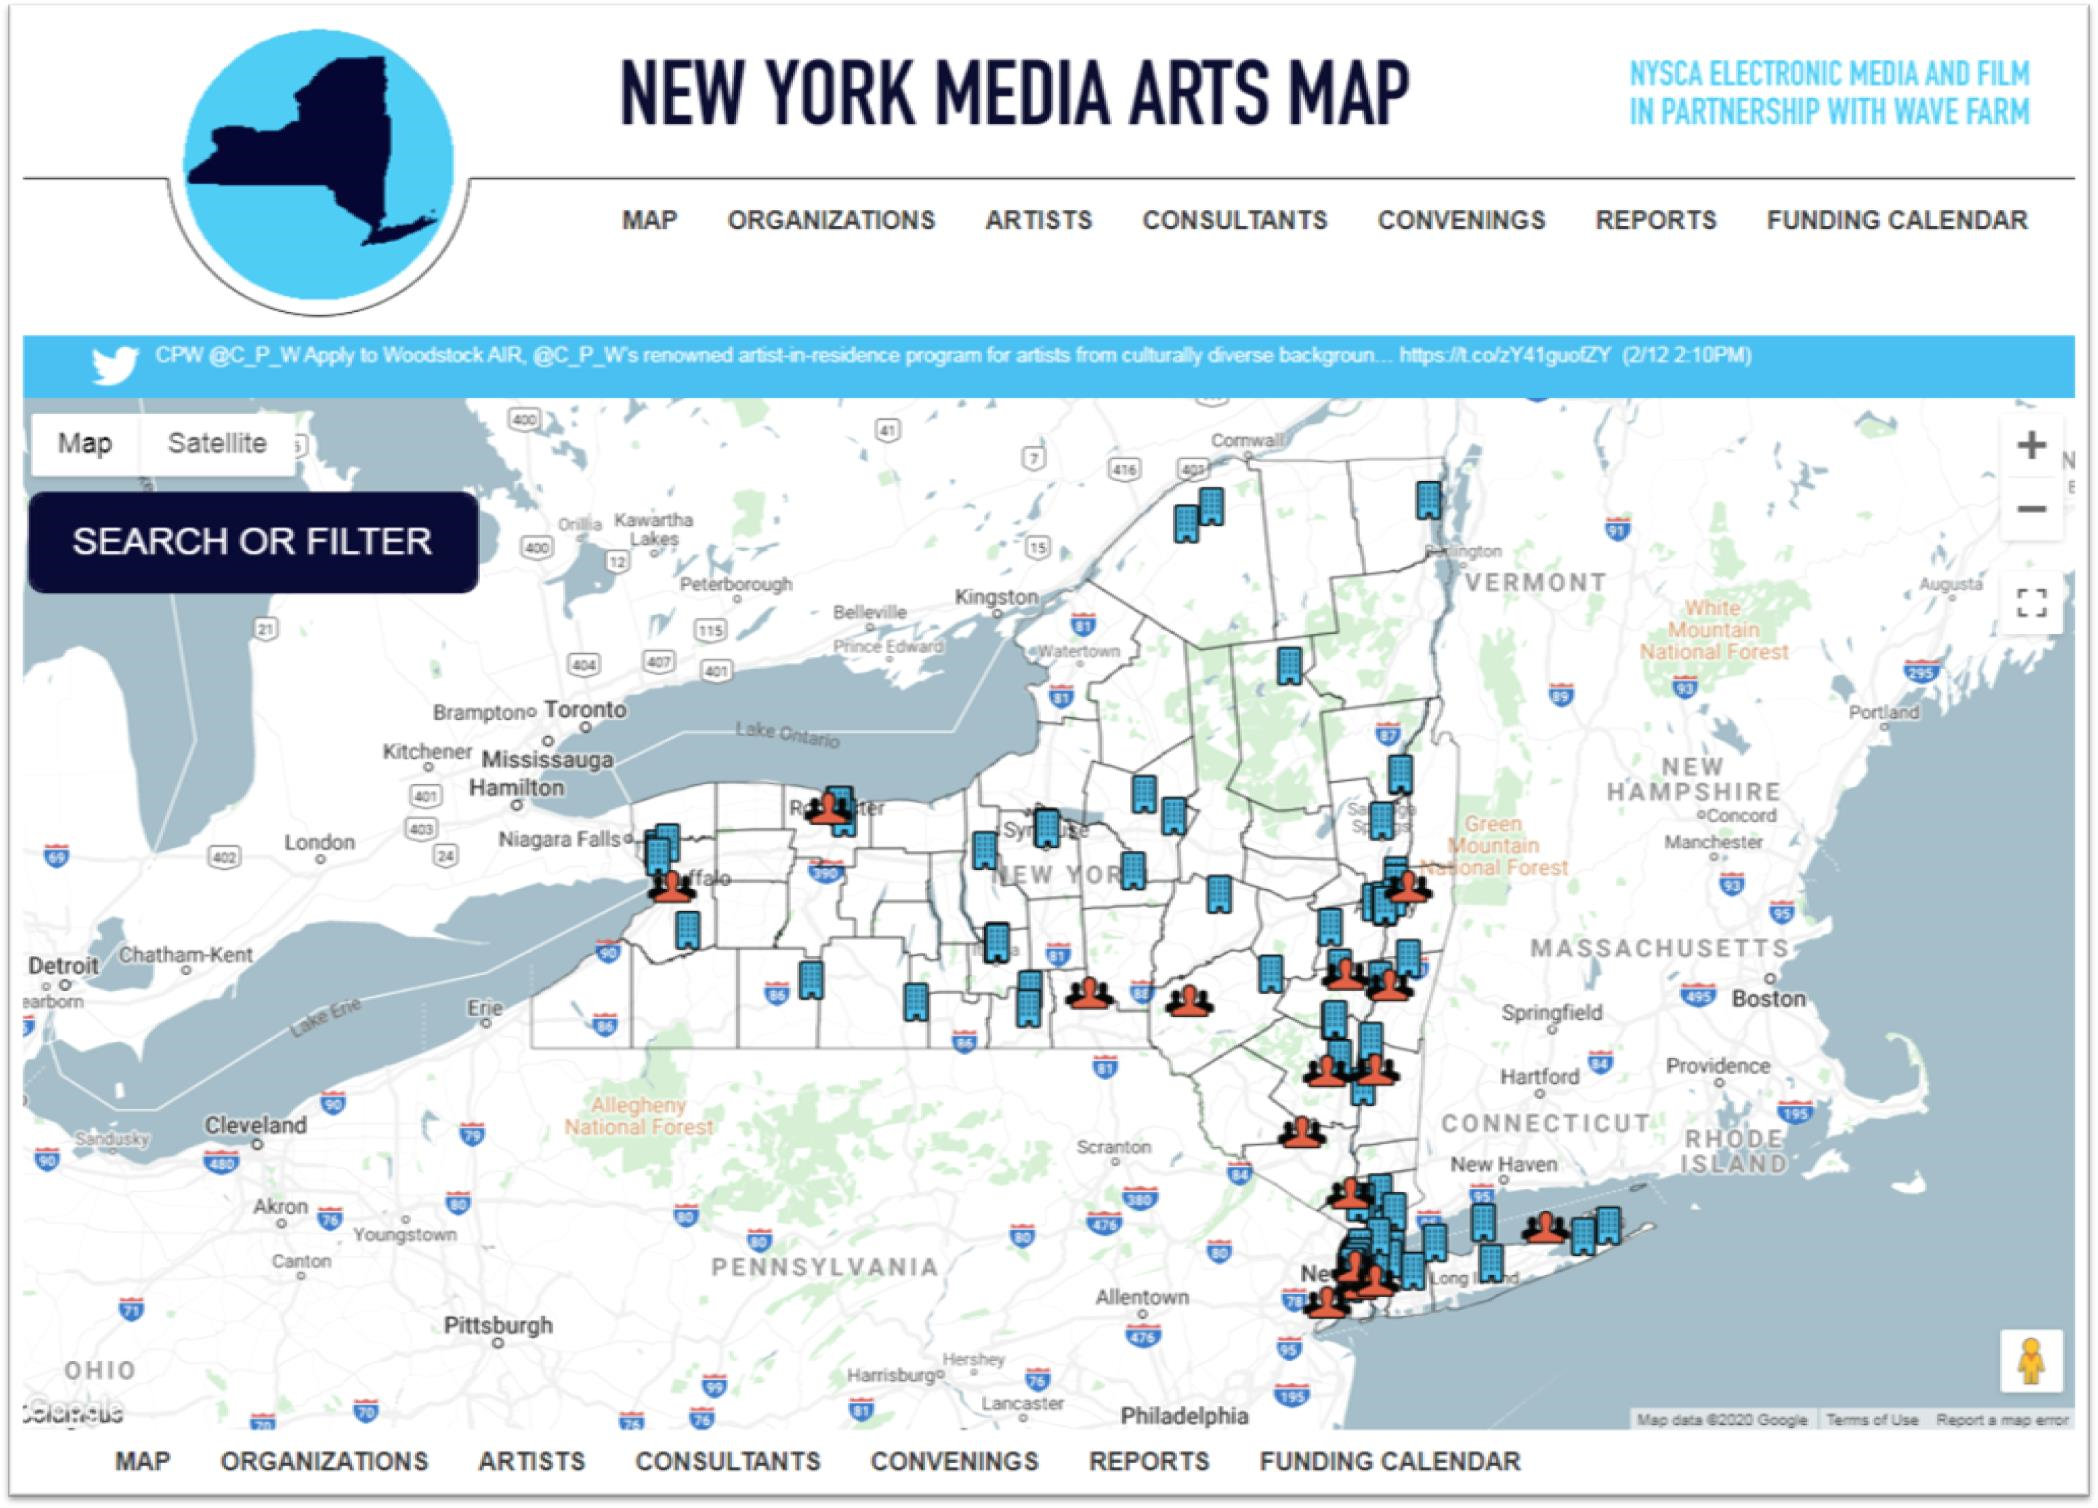
While the Empire State geospatial community is accustomed to seeing terms such as Google Maps JavaScript API, GeoJSON, and HTML as part of the conversation in building online mapping applications for government and business, we increasingly see the use of these same online mapping development tools in the nonprofit sector as well.  One such example is the newly updated New York Media Arts Map which is a project of of the New York State Council on the Arts (NYSCA) Electronic Media and Film program, managed by Wave Farm.  Though Wave Farm is more commonly recognized as an arts organization dedicated to transmission arts with FM and online radio stations, it is their regrant partnership through NYSCA which ultimately led to its stewardship of the online Media Arts Map. Serving in this capacity, Wave Farm assists in administering and distributing grant funds, ranging from $500 to $10,000, to dozens of New York State individual artists and organizations – all of which are included in the Map.

The Map

At its core, the Map is an extensive online catalogue of Media Artists, whose interdisciplinary work includes a wide range of fields including visual art, film, computer graphics, data visualization, sculpture, architecture, music, photography – even drones – and much more. The Map lists organizations which are recent grantees of the NYSCA Electronic Media and Film program (EMF) and the Media Arts Assistance Fund (MAAF).  In all, there are 198 organizations and 69 artists included in the Map.  First launched in 2009 and originally hosted by Rhizome, the 2014 update is the work of Peter Berry who is a developer affiliated with Supercosm, a Seattle, WA based firm which focuses on work with nonprofits.  In addition to the software components already mentioned, Peter’s work on the back end of the map includes the use of open source pieces CakePHP and Apache bundled with MySQL.

In addition to providing location information on organizations and artists included on the map, pull down menus along the top tool bar include additional statewide media arts information on meetings and workshops, partnership reports, and information on funding opportunities.

The Search box offers a wide range of options to filter the organization/artist database. Search queries provide a description of the types of work, services, and types of media arts offered as well as online contact information.

Intersection of Media Arts and Technology

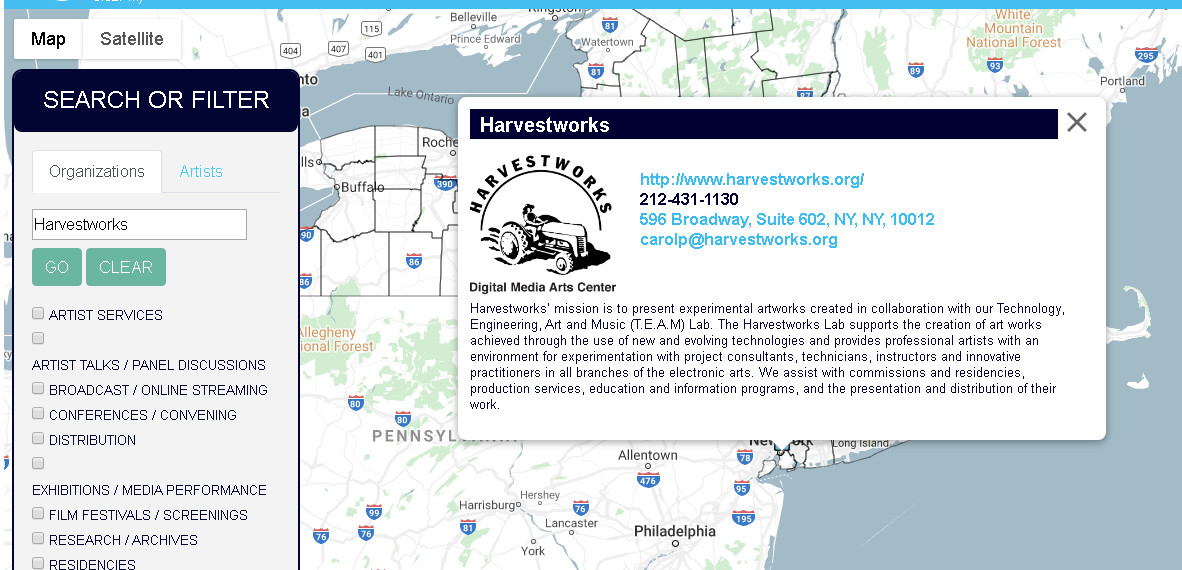
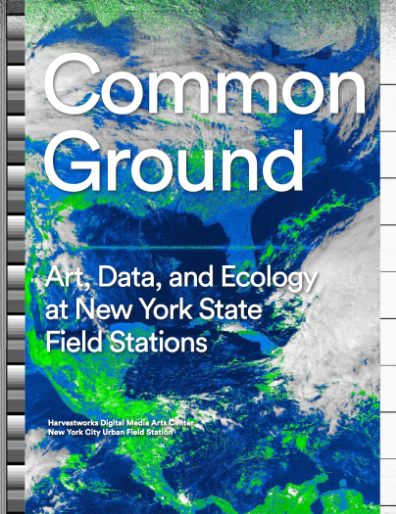
It’s interesting to see, albeit even on some small level, how  the media arts world finds itself close to the geospatial space.  For example, take the work of  Harvestworks which supports the creation of art works achieved through the use of new and evolving technologies and provides an environment for experimentation with project consultants, technicians, instructors and innovative practitioners in all branches of the electronic arts.  A recent report by the organization entitled Common Ground provides “an overview of how and where transdisciplinary work is taking place in New York State, and makes recommendations to encourage further opportunities for artists that, when combined with environmental research, can aid engage the public, encourage environmental stewardship, and benefit communities”.

The report was published by the Harvestworks Digital Media Arts Center and The New York City Urban Field Station which is a partnership of the U.S. Forest Service, New York City Department of Parks and Recreation, and the Natural Areas Conservancy. (The Field Station in NYC supports the Arts and Humanities Residency Program. Check out the Summer 2018 Moon Arrow project – a time lapse compilation of the Moon Arrow pointing to the moon on New York City shorelines).  Open data, building code and hackathons in the geospatial space of your interest?  Then take a look the work of the School for Poetic Computation.  And how about drones?  While the technology is evolving incredibly fast, there was the 2018 Art Omi, Wave Farm and eteam live performance of The Aerial Actor which focused on the rising use of drones in science and art.  Actual drones were used as both carriers of messages and actors in the performance.  “The Map is a vital resource identifying art and technology projects and activity throughout New York State supported by NYSCA Electronic Media & Film”, says Galen Joseph-Hunter, Executive Director, Wave Farm. “It is also a useful tool for showing a geographic picture of how support is distributed throughout the state.”

Summary

So stop for a minute, grab a cup of coffee and put down the pen, I mean your mouse, and take a deep drive into the New York Media Arts Map site.  See what’s in your region, maybe even your neighborhood.  Support the statewide media arts community.  Cool stuff – all from the traditional artistic settings to the avant garde and experimental.  And sometimes, just a one-off from the geospatial space we work in.

Enjoy.

Contact:

Galen Joseph-Hunter
Executive Director
Wave Farm
Radio: WGXC 90.7-FM, Transmission Arts, Grants
518-622-2598
galen@wavefarm.org

The Art of Geospatial Collaboration: Allegany State Park Interactive Viewer

Cattaraugus County and Allegany State Park Share Resources and Vision

While GIS as a shared service as part of Governor Cuomo’s County-Wide Shared Services Initiative (CWSSI) has yet to take hold in a broad context across local governments in the  Empire State,  the statewide GIS community does have a great example to highlight how local governments can collaborate with a state agency in sharing geospatial technology.  Case in point:   The Allegany State Park Interactive Map viewer.

Located in Cattaraugus County in western New York abutting the Pennsylvania state line and  north of the Allegheny National Forest, Allegany State Park was created in 1921 and encompasses nearly 64,800 acres.   A major western New York State tourist attraction – the park averages  1.5 million annually – the park offers a wide range of four-reason recreation activities and lies within the Alleghany Highlands Forests ecoregion.   The idea of a joint effort between  Cattaraugus County and Allegany State Park online map viewer idea goes back as far as 2010 as part of a discussion between Daniel T.  Martonis, who at the time was GIS Manager for the County and Tom Livak who was then Director of Economic Development, Planning & Tourism.

The initial viewer was more emergency services focused with the collection of infrastructure data and intended for use by park staff only – nothing external.  Most of the data was collected by Dan and Tom, including Chris Holewinski – the current Cattaraugus GIS Manager – using various Trimble GPS units as well as utilizing old engineering maps.  The trio even brought out metal detectors to pick up the locations of pipes.   At the time, Dan was building web mapping applications with ArcIMS that Dan mentions was not “people friendly” and was ultimately discontinued by ESRI.  Along the way, though, both Dan and Tom knew they were beginning to frame a web mapping product which would be of great value to both the County and ASP.  ArcGIS Online began to emerge as a more functional and adaptable web mapping platform providing additional opportunities for the two government programs to build upon what had been started.

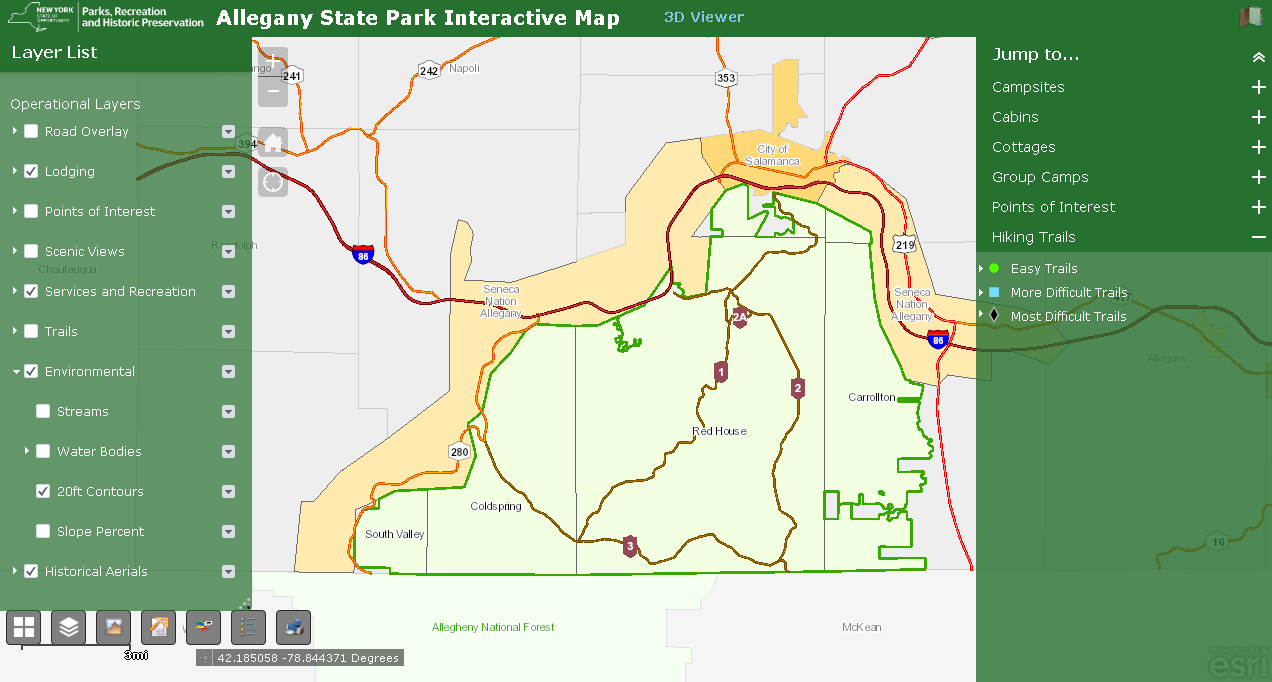
The ASP viewer represents the ongoing collaboration between Cattaraugus County and Allegany State Park. It provides easy to use access to a facility, environmental, and cultural data including historic aerial photography.

Continue reading

Geospatial Business Spotlight: CARTO

Company Name:                   CARTO

Location:                               New York, New York​​​​​

Website:                               www.carto.com

Employees:                          143

Established:                         2009

Founded by Javier de la Torre, CARTO is a diverse and expanding company which includes data scientists, geospatial analysts, cartographers, software developers and engineers, visualization experts, and web designers focusing on Location Intelligence.  Most recently in May 2019, CARTO expanded its worldwide professional service portfolio offerings by acquiring Geographica.

Providing ready to use software tools for data scientists and application developers, CARTO’s client focus is on turning location data into business outcomes, and is built around the following workflow:

  • Data Ingestion & Management
  • Data Enrichment
  • Analysis
  • Solutions & Visualization
  • Integration

Software & Capabilities

Complex analysis, filtering, and visualization are integrated in real time reducing time-to-insight.  Users can integrate CARTO’s API’s and geocoding services to complement other apps and business applications and can be integrated with custom proprietary analytical models.  CARTO can be used as an engine to visualize a wide range of data services.

CARTO is scalable and offers a Software as a Service  (SaaS) deployment model to push new features instantly allowing users to “grow as you go.” Being enterprise-ready also means making on-premise and private clouds architecture solutions available to clients.  CARTO also offers a mobile platform.

Sample Products and Applications

On October 16, 2019, CARTO hosted the 2019 Spatial Data Science Conference (SDSC) at Columbia University which I covered and reported on in a previous blog post.  Typically GeoSpatial Business Spotlight focuses on three or four applications from the firm being highlighted.  However, since SDSC was a day-long series of entirely CARTO-based applications, the conference website provides a better and more thorough overview on how CARTO is applied in business, academia, government, and nonprofit organizations.  Choose from presentations by Uber, Facebook, University of Chicago, American Securities, Salesforce Maps, and MIT among others.  In Empire State, CARTO supports numerous programs in the metropolitan New York City area in both business and government.

Contributions to the Profession 

As part of CARTO’s long-standing commitment to FOSS, Open Source, Open Data, and Open Science, the company has collaborated with many organizations providing access to next generation geospatial technology, data, and models. Most recently (October 2019), CARTO’s Javier de la Torre  joined the Urban Computing Foundation (UCF) Technical Advisory Committee which is a neutral forum for accelerating geospatial open source and community development.  The UCF operates under the umbrella of The Linux Foundation.  In July 2019, Geospatial Media and Communications included Javier de la Torre as part of the Location Analytics & Business Intelligence (LA & BI) Advisory Board.  Additional

CARTO is an open source software built on PostGIS and PostgreSQL which was first released in Beta at FOSS4G in September 2011 and officially released at Where2.0 in April 2012.  The CARTO software solution uses JavaScript extensively in front end web applications, back end Node.js based APIs, and for client libraries.

Overall, CARTO’s platform consists of the following primary components:

The CARTO platform enables users to access and manage vast amounts of data while at the same time providing numerous processes to discover, filter, and integrate local and Big Data libraries.  Geo-enabling large datasets provides a means to visualize and better understand large and complex datasets. CARTO enriches user location data with versatile, relevant datasets, such as demographics and census, and advanced algorithms, drawn from CARTO’s own Data Observatory and offered as Data as a Service (DaaS).

CARTO uses widget-driven dashboards, an array of maps, and unified workflows so that non-GIS and non-mapping users/staff can bring the power of location into the organization’s decision making.

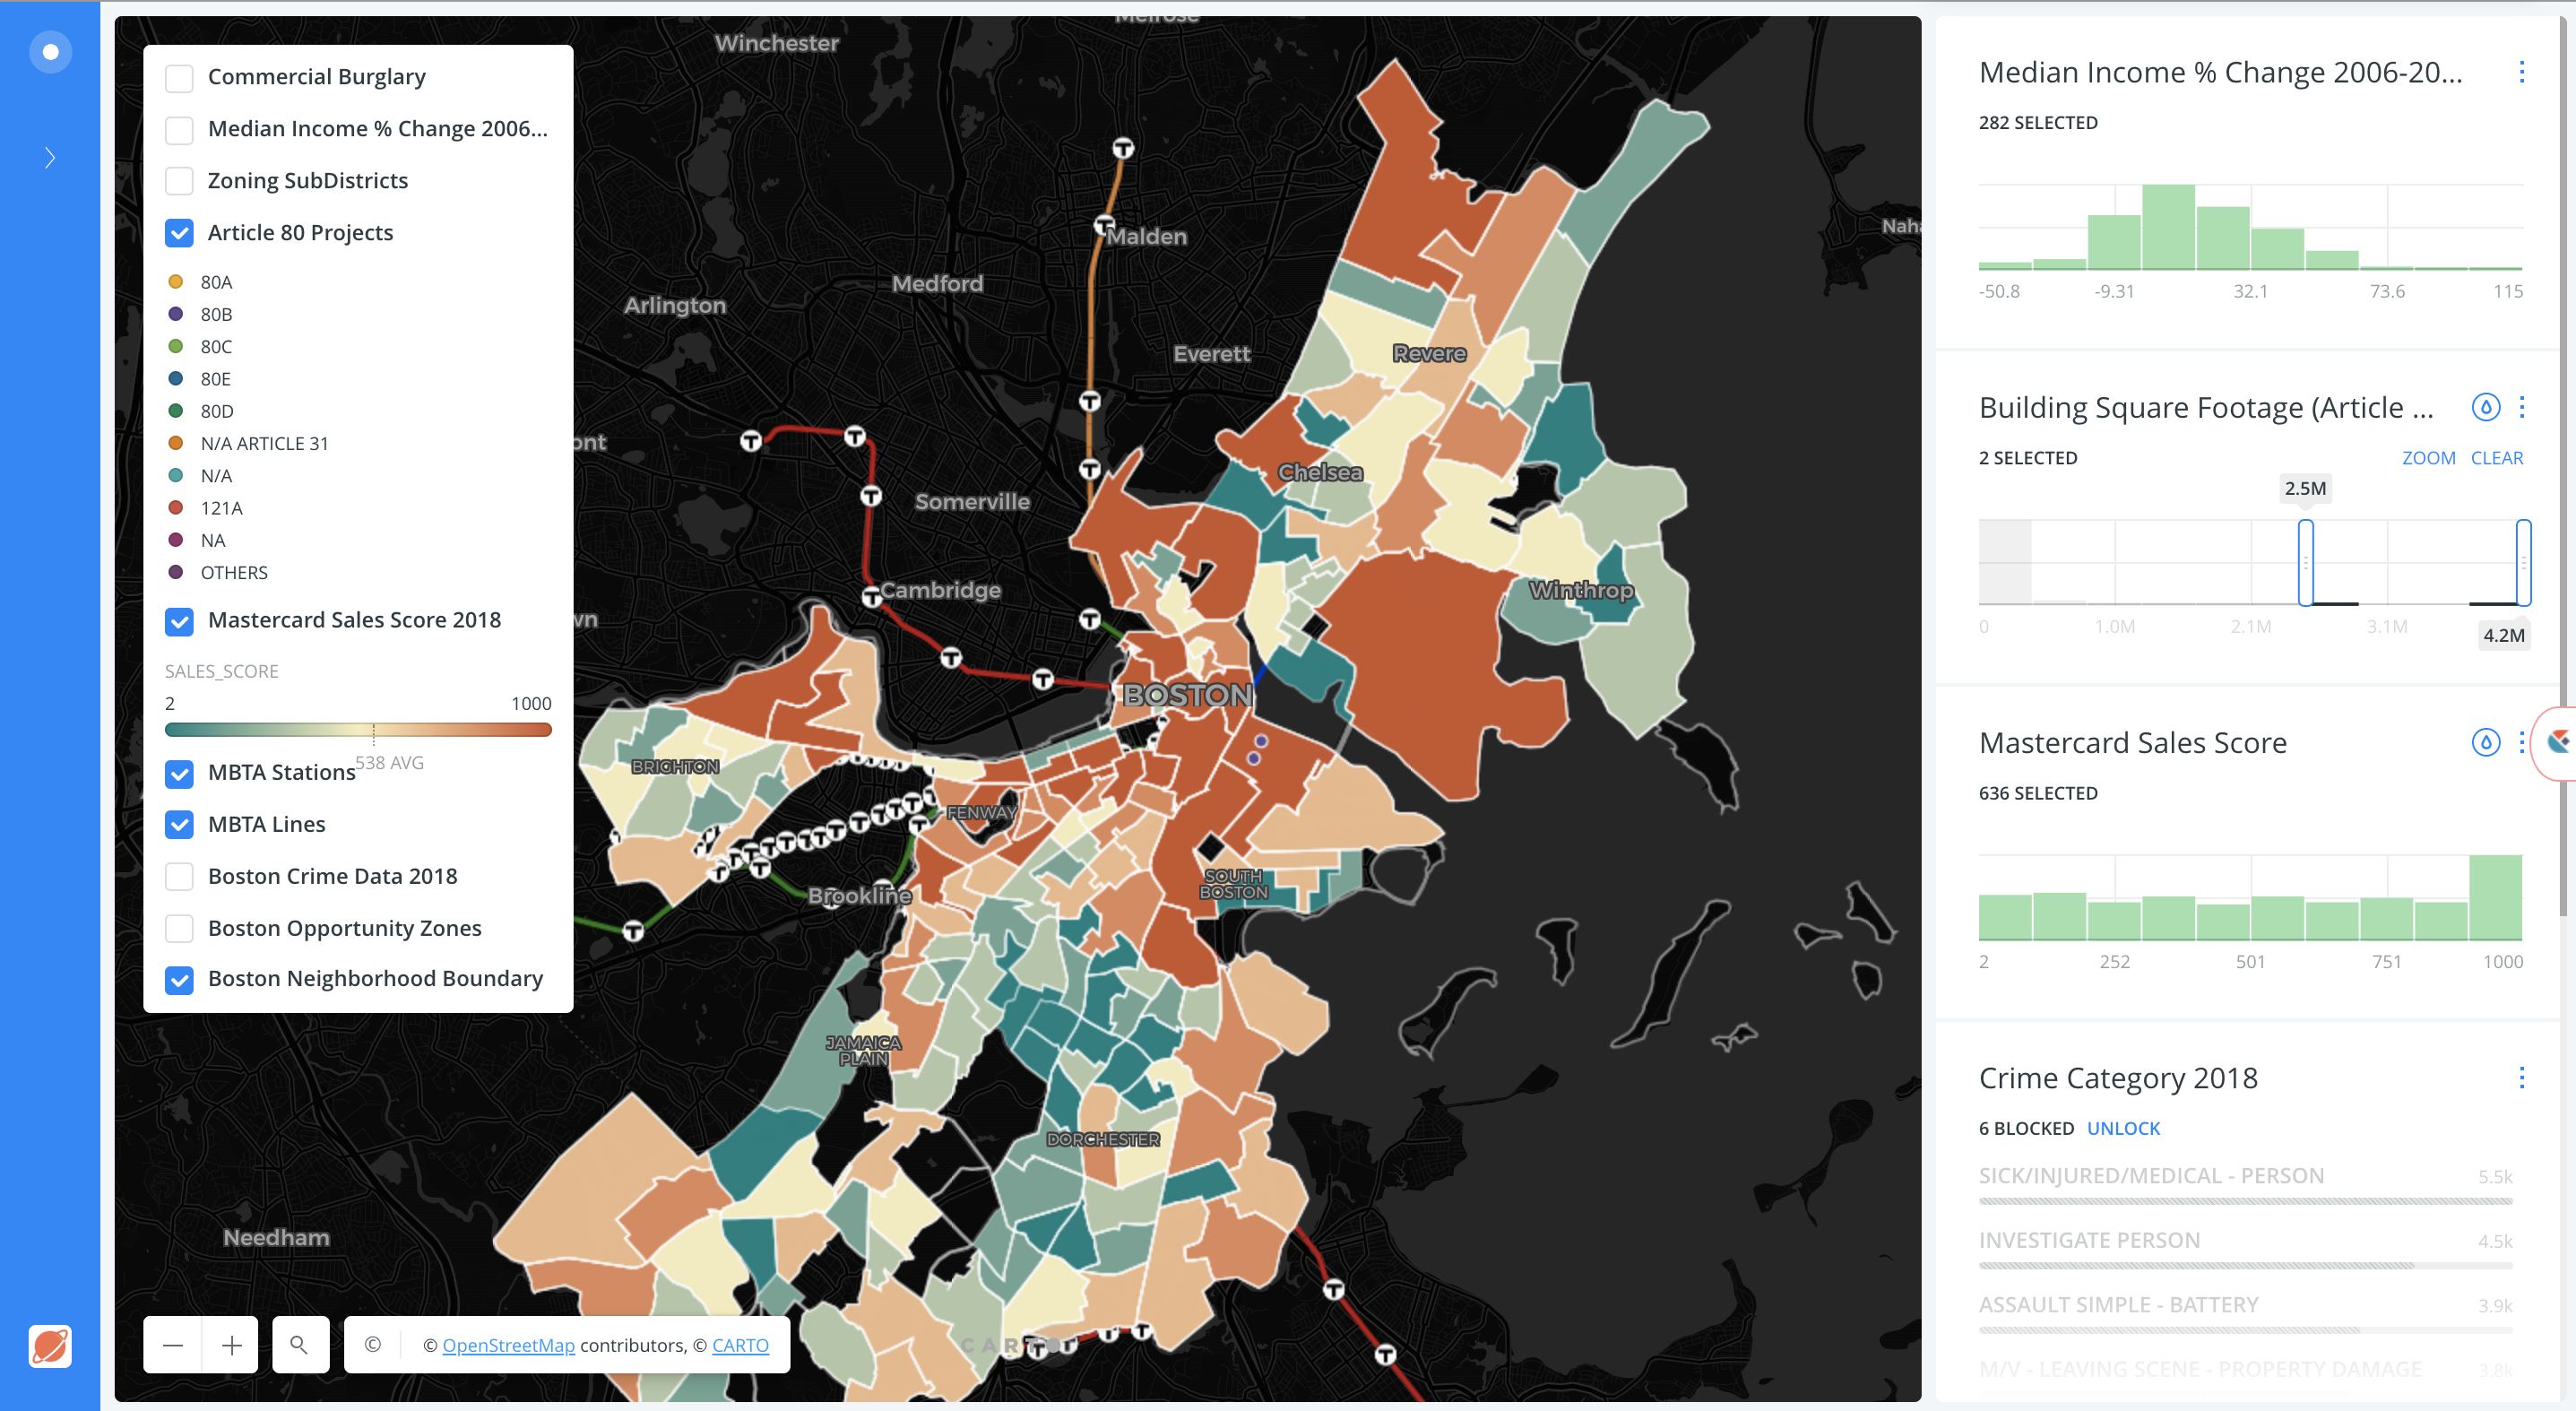
The CARTO software user interface provides both user-friendly mapping and dashboard visuals which can be customized to user needs and experience.

Complex analysis, filtering, and visualization are integrated in real time reducing time-to-insight.  Users can integrate CARTO’s API’s and geocoding services to complement other apps and business applications and can be integrated with custom proprietary analytical models.  CARTO can be used as an engine to visualize a wide range of data services.

CARTO is scalable and offers a Software as a Service  (SaaS) deployment model to push new features instantly allowing users to “grow as you go.” Being enterprise-ready also means making on-premise and private clouds architecture solutions available to clients.  CARTO also offers a mobile platform.

Contact:

Florence Broderick
VP Marketing
flo@carto.com
4475-686-89402


Geography as a Factor in Accessing Educational and Human Services

Focus on SUNY Campuses and NYS Correctional Facilities

In recent years I had a close college friend incarcerated in the New York State prison system and during this time I became interested in rehabilitation and re-entry programs offered to inmates.  Particularly in context of encouraging and helping my friend to focus on a path which would lead him to a better space, a new beginning, and away from the dark past.  My friend Bob (not his real name) actually became a shining example of what is possible in context of educational degrees and technical skills that are offered by the state as part of in-prison and reentry programs.  The intent of both which are to help incarcerated individuals to a successful transition to personal and community life after being released.  Bob became a minister while in prison and then was able to finish up his undergraduate degree and earn a Masters in social work from the City University of New York (CUNY) after his release.  Unfortunately these personal educational accomplishments did not change the trajectory of his life as what ultimately followed after prison were years of living in transitional housing and homeless shelters.  Never really able to rid himself of the many demons within that had haunted him most of his adult life.  Bob died of a heroin overdose four years ago.

Not long after one of my last correspondences with Bob’s family, I came across Mapping the Landscape of Higher Education in New York State Prisons (February 2019) published by the Prisoner Reentry Institute (PRI) at the John Jay College of Criminal Justice in New York City.    It’s a noteworthy report with plenty of content and includes an interesting reference which discusses the availability of educational opportunities for inmates which can depend, in part, on the geographic proximity between the locations of State University of New York (SUNY/CUNY) institutions and the statewide network of correctional facilities as administered by the New York State Department of Corrections and Community Supervision (DOCCS).  While I was able to establish communication with staff at the PRI, I had hoped to establish more in-depth discussions with staff at the two state departments (SUNY and DOCCS) to further build the story of the campus-prison relationship.   It is unfortunate that I did not as there is evidence of mapping products/software in the departments based on graphics in the report which includes a SUNY published interactive online viewer.  These products illustrate the issue of geography as a potential factor in the delivery of educational services to the statewide inmate population.

Current Correctional Facilities Landscape

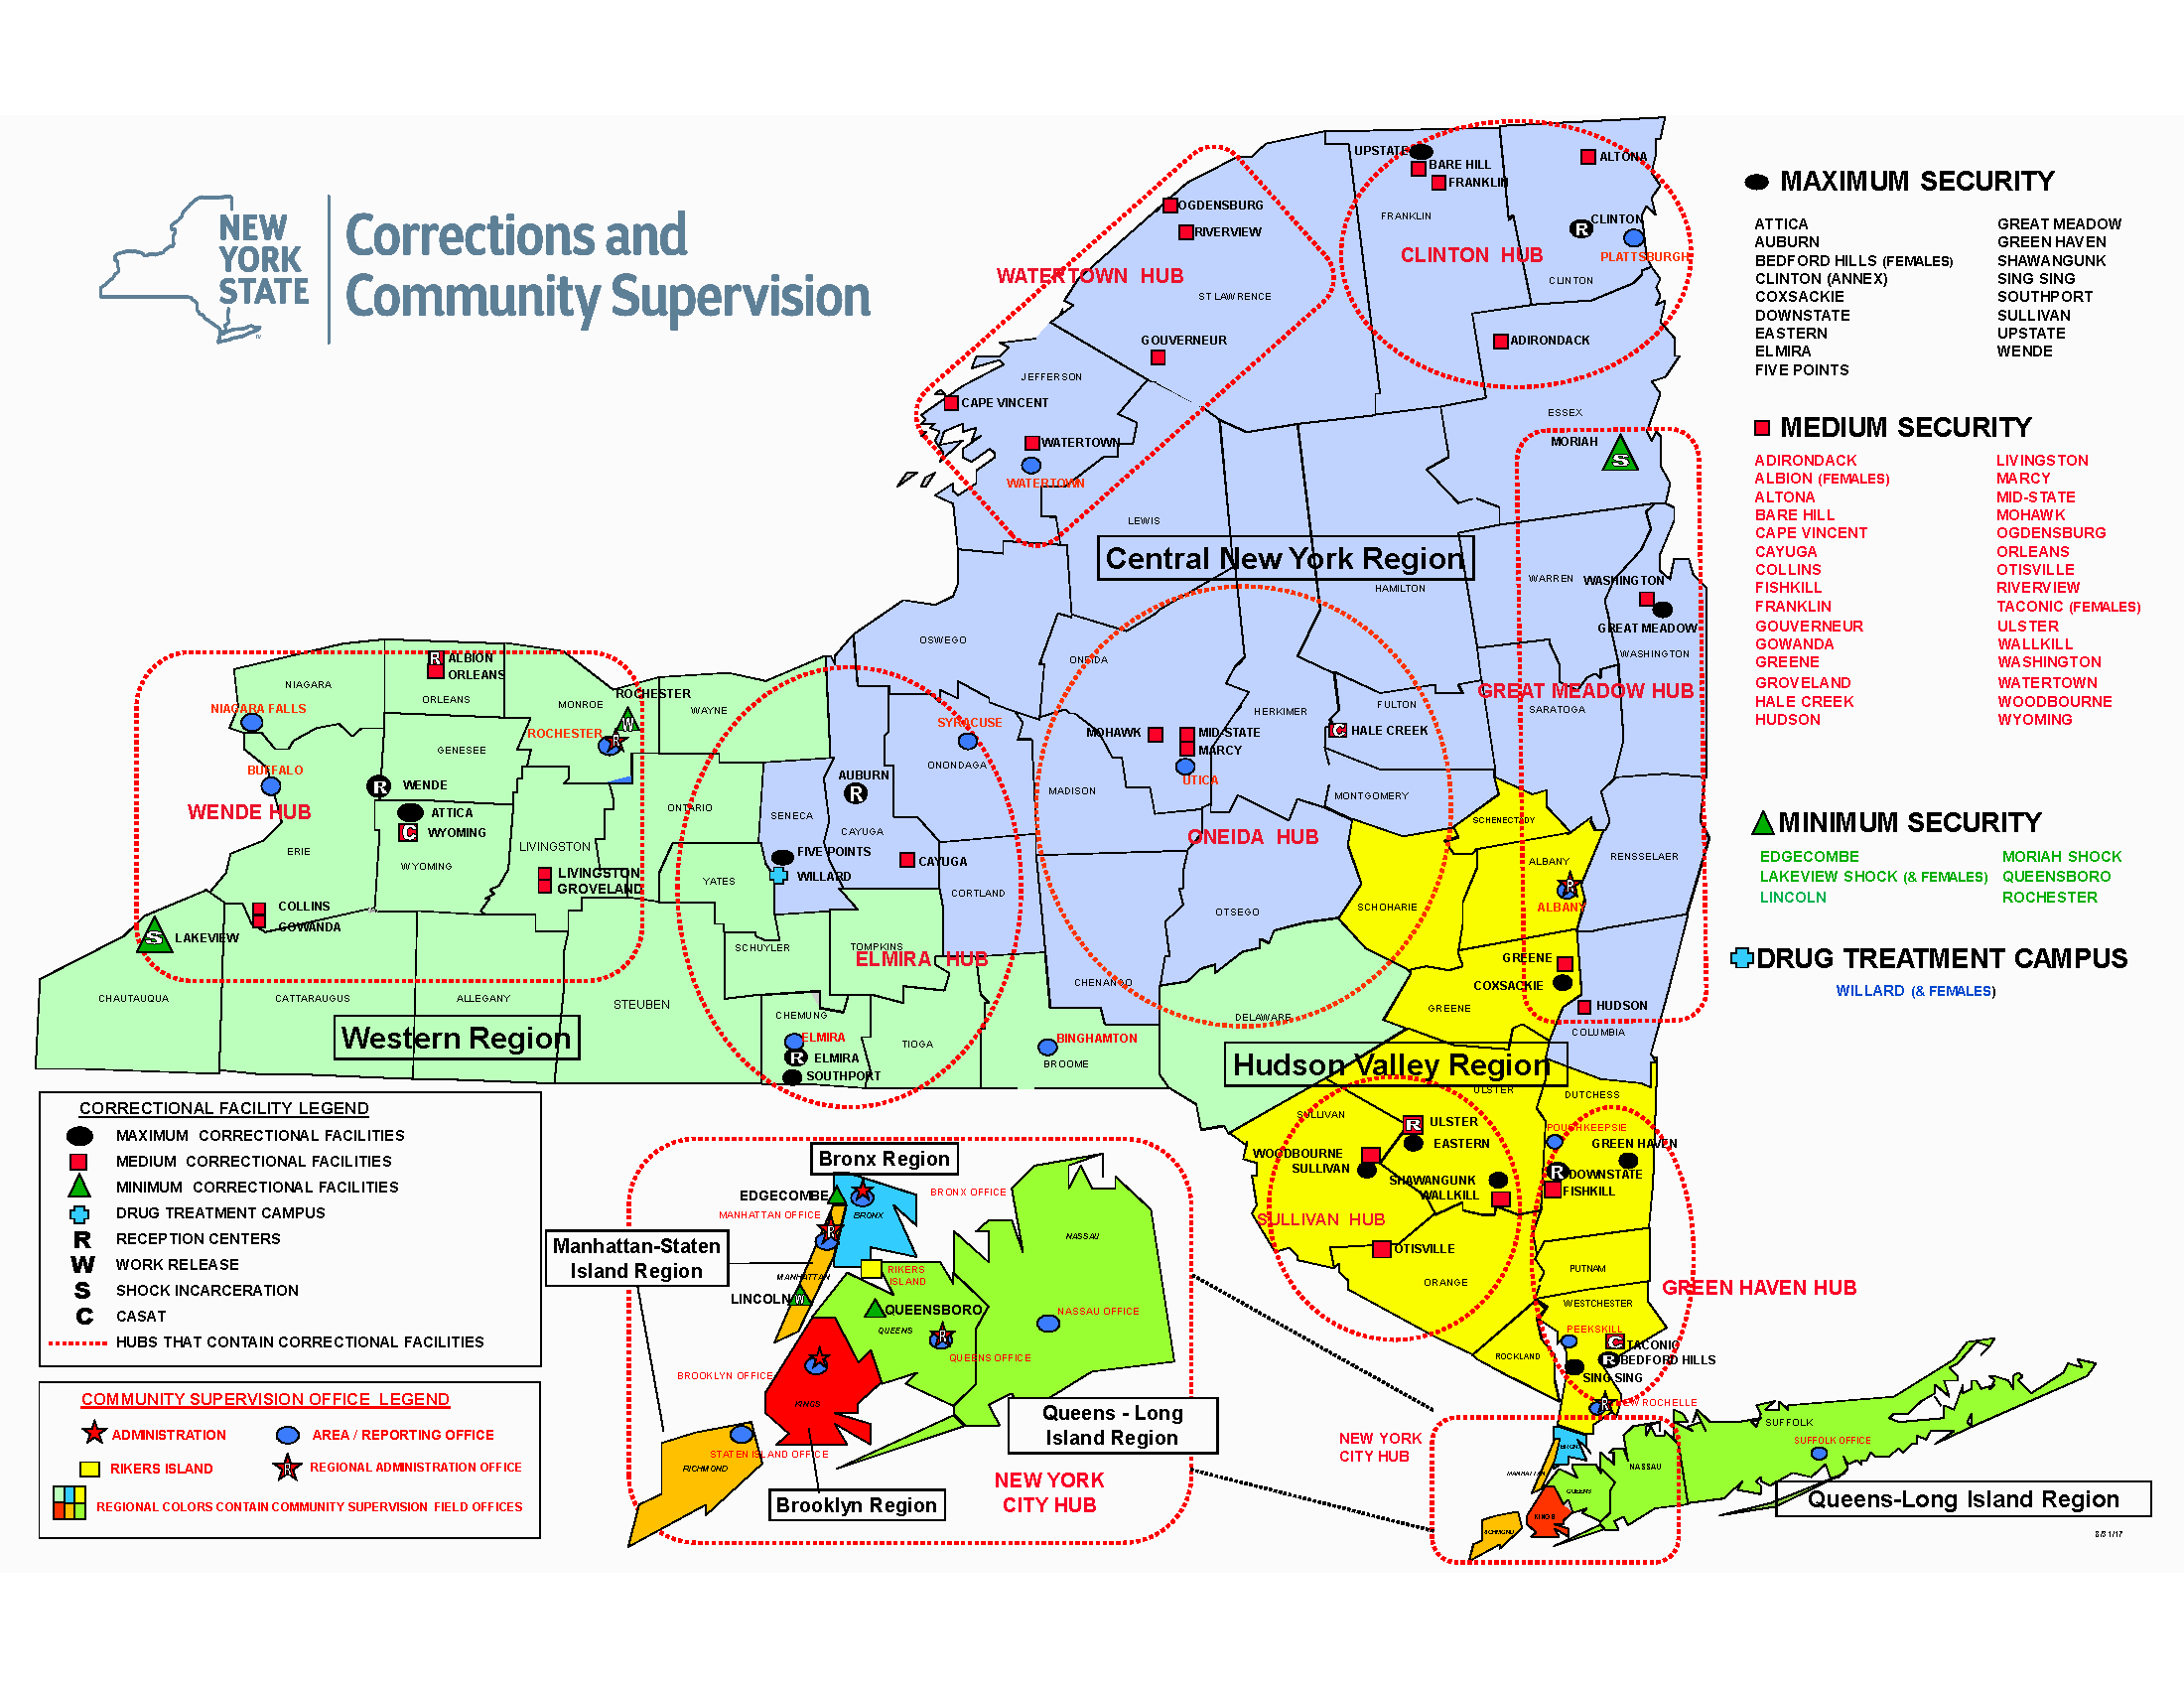
Per the image below, New York State maintains 52 correctional facilities in seven administrative regions across the state with approximately 46,000 individual under custody and another 35,855 parolees under supervision.

This map is better rendered by downloading the original PDF from DOCCS. Four of the seven administrative regions are in the metro NYC area.

There are now 15 college programs involving over 30 institutions of higher education operating in 25 DOCCS facilities. The report looks into the two systems – higher education and corrections – that are seemingly distinct, yet come together to provide access to college education for incarcerated people. It looks at the challenges, including geography, in meshing these two systems and how both corrections and college staff can work to overcome problems.

Good News Bad News

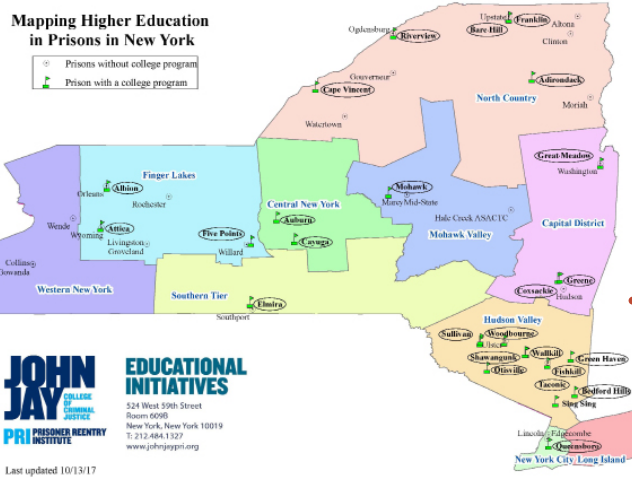
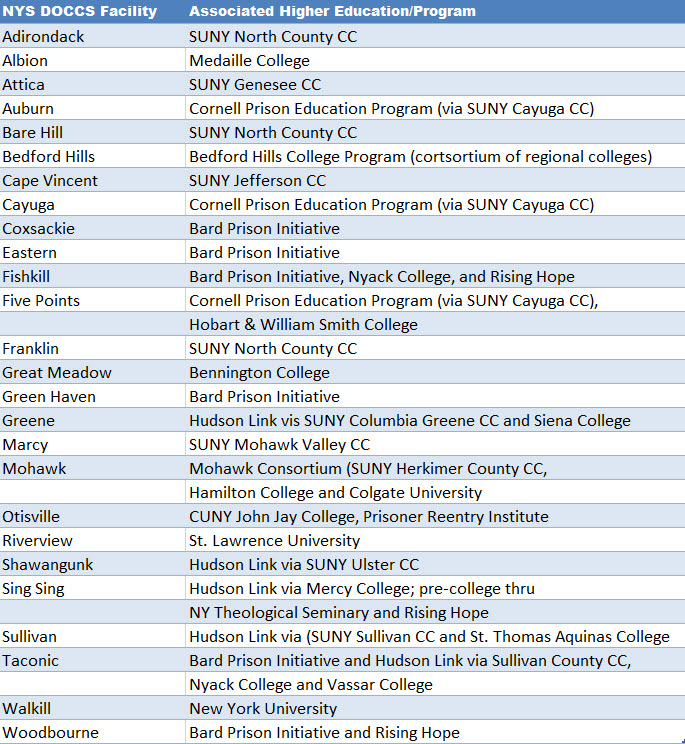
While the good news is there is generally good geographic proximity between SUNY (including the New York City CUNY system) campuses and statewide correction facilities – particularly in southeastern NYS, there is considerable variation in the operation of college-in-prison programs, including different types of administrative and financial structures, faculty, and pathways to higher education post-incarceration.  A detailed description of educational and academic opportunities for inmates is made available on this DOCCS webpage.   Of the participating colleges, roughly two-thirds are private institutions and one-third belong to the public sector.  Just over half of the maximum and medium security prisons in New York – 25 facilities – host some form of face-to-face college programming. Of the 54 DOCCS facilities, ten out of 16 male maximum security facilities and 12 out of 27 male medium security prisons house college programs. All three of the female prisons – two medium and one maximum – house college programs. The prisons with college education programs are shown in figure below (a clearer version of the map is found on page 27 of the report) and itemized in the following table.

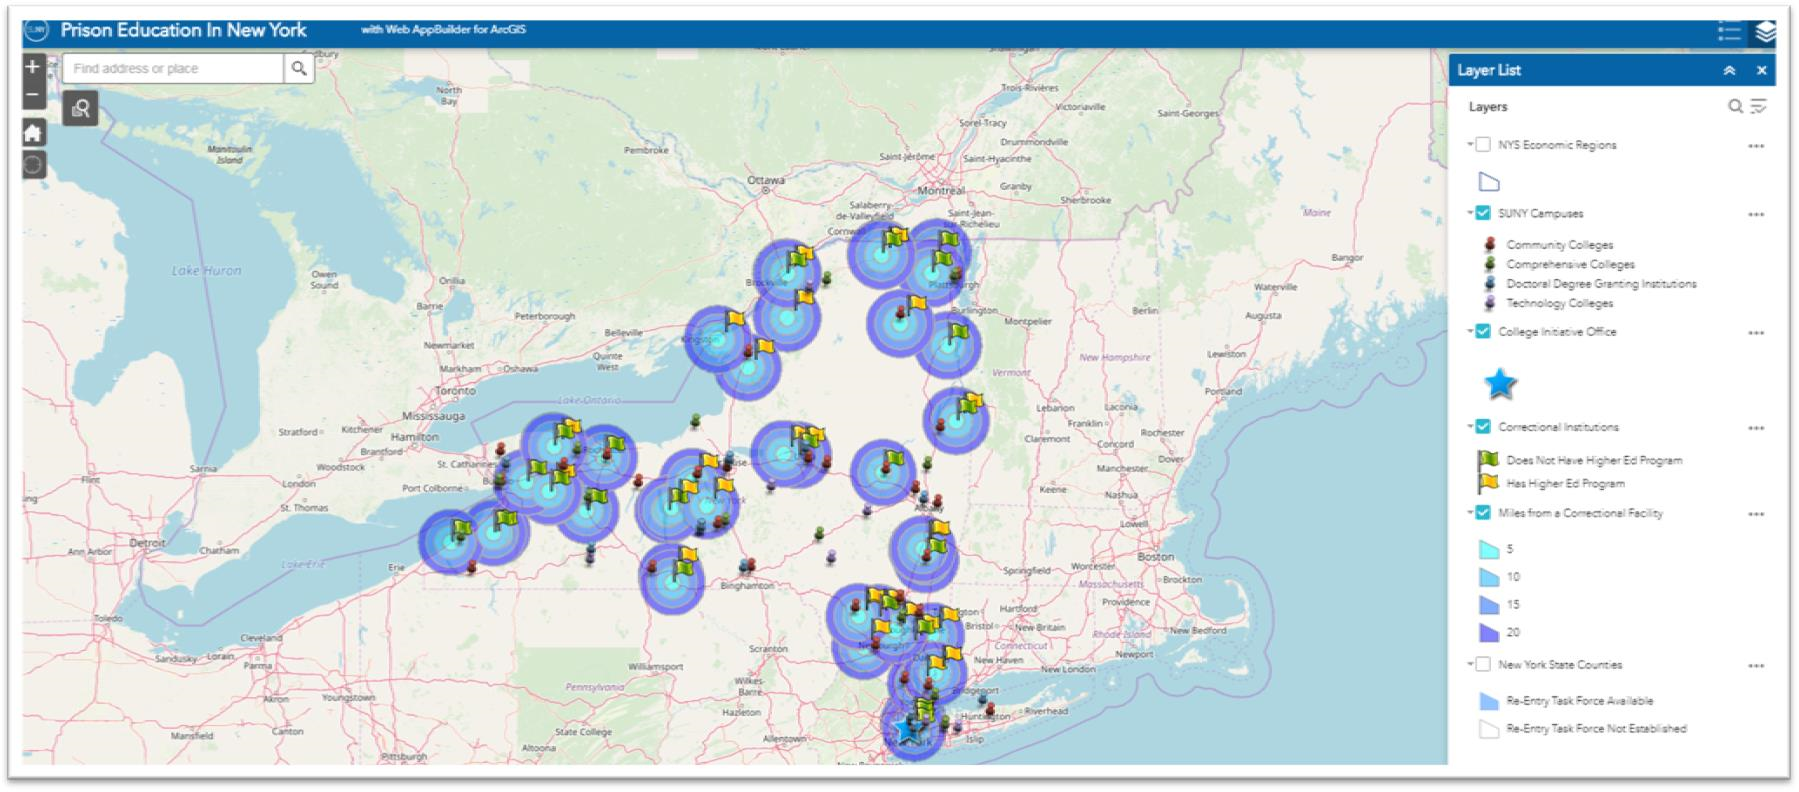
Most of the in-prison college programs are in southeastern New York State with less in the northern and western part of the state. A somewhat clearer version of this image can be downloaded from the report.

Most prisons with college programs are clustered in the Hudson Valley near the New York metropolitan area. The prisons without college programs tend to be further from New York City, likely a function of the fact that incarcerated people in downstate prisons (Bedford Hills and Sing Sing) were leaders in working with community groups and colleges from New York City and its immediate environment, as well as the ability of the colleges and non-profit organizations to generate funding and support for such programs. Moreover, the political environment of these communities was and remains more supportive of college-in-prison programs.

The PRI report (Include report name here) highlights how geography can play towards the delivery of educational services in the statewide correctional system albeit there are many other factors in play.  Matt Bond, staff at PRI, reported that currently only about 3% of the 46,000 individuals incarcerated in Empire State prisons are able to take college classes. Geography certainly presents challenges to offering college classes in prisons, but there are numerous other challenges, including:

  • Difficulty getting materials approved to bring into prisons,
  • The lack of technology (particularly internet access) in prisons,
  • Other demands on students’ time (such as working in order to purchase essential items from the prison commissary),
  • The fact that incarcerated students can be transferred from one facility to another, which interferes with their educational progress,
  • The need for sustained funding to maintain and expand college in prison programs,

This interactive SUNY published viewer shows the locations of both SUNY/CUNY campuses and NYS Correctional facilities. Rather than clicking the Miles from Correctional Facility box (which makes the make very busy at large scales) simply click on a correctional facility to see the distance to the closest SUNY campus.

Even though both of the institutions in this scenario are state governed and administered, each are largely fixed/physically located assets which dictates how much the delivery of educational opportunities can change albeit there are increasingly more options of offering educational programs remotely.  However, technology and internet capacity inside prisons available to inmates continues to be an issue.

But the fact remains today there are thousands of current inmates in the NYS correctional system in 2019 – male and female – who do not have access to the educational opportunities where geography does matter on some level.  The PRI report did not provide a specific overview or comparison on the quantity/quality of educational programs in the 5, 10, 15, and 20 mile buffers around each of the correctional facilities which would have spoke more specifically to the geographic issue.

The Geography Factor in other Human Services

While the PRI report did not make reference to any significant “gaps” in the delivery of educational opportunities to inmates, the “gap” issue is becoming more of an issue (or reference) in context of delivering other important public services across the state.  Such “gaps” are now being referred to as “deserts”.  In New York State, it is not difficult to search for recent references to deserts in the areas of  child care, maternity and mental health care, food deserts, and the struggles of rural hospitals disappearing across the U.S. landscape.  Significant geographic rural areas of the Empire State  are increasingly losing access to essential human services to which the reasons are many.

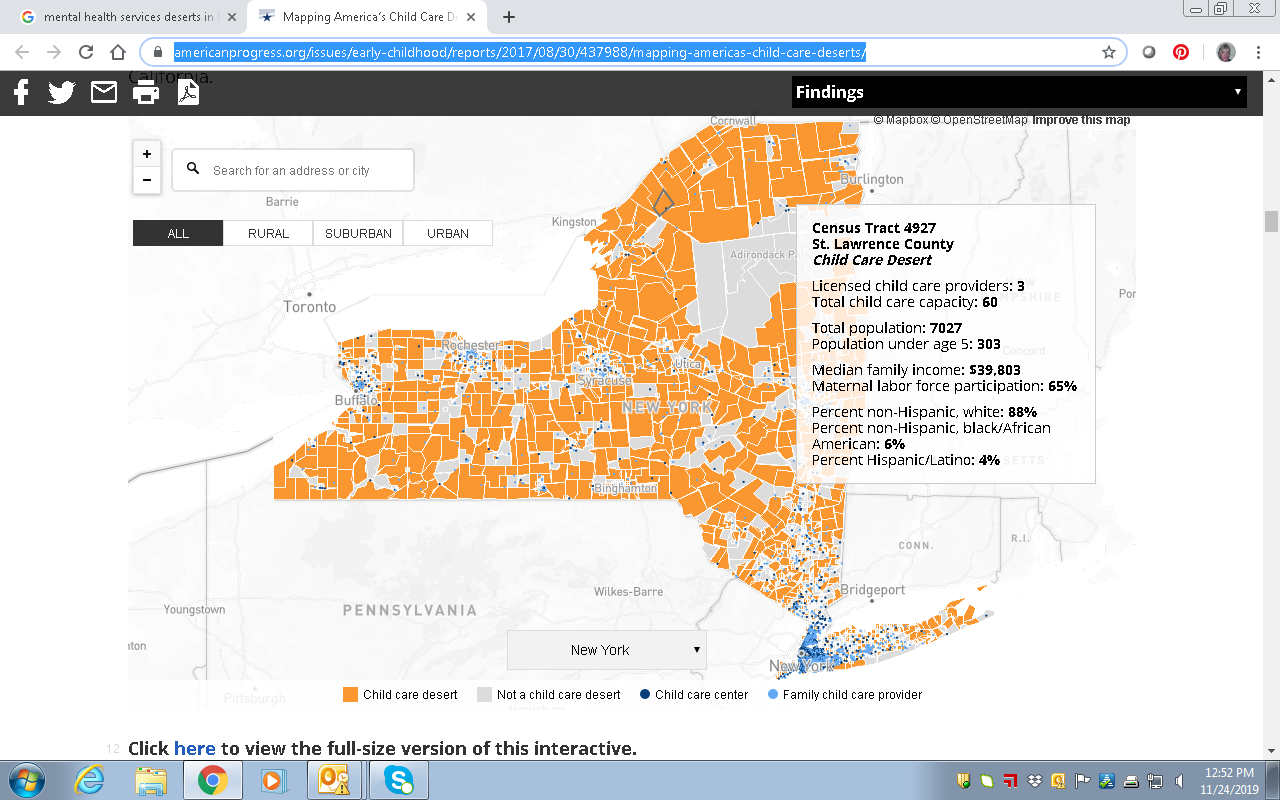
This image is a subset from the larger statewide map published in the article Mapping America’s Child Care Deserts. According to the report California and New York have the largest percentage of people living in child care deserts.

Geospatial technologies can play a central role in helping solve geography issues associated with growing number of health and human service delivery “deserts”.  Route GIS-based optimization programs based population centers, road networks, geocoding, and other dependencies. Furthermore, identifying potential temporary or “pop-up” service center locations in areas of greatest need which constantly changing over time.  A more mobile service delivery framework which can be leaner and more efficient.  Avoiding the need to higher cost fixed and permanent facilities.

There is much that can be done to advance access to a wide range health and human services including educational options for those incarcerated in New York State correctional facilities.  We are fortunate there is a strong geospatial technology foundation across the Empire State to build out these opportunities.

Spatial Data Science Conference 2019

I had the opportunity to attend the 2019 Spatial Data Science Conference (SDSC) at Columbia University on October 16th.  Hosted by NYC-based Carto, the event was attended by over 500 people from government, nonprofits, industry and business, and academia.  The day-long conference was highlighted by a variety of presentations and lightning talks from data scientists and program managers representing organizations from around the world including Uber, Airbnb, Datarobot, Waze, Instacart, MIT, Sidewalk Labs, Two Sigma, and Facebook among others.  All of the presenters use Carto’s Software as a Service (SaaS) platform which provides GIS functionality, web mapping, and spatial data science tools.

Data Science

Founded in 2017, SDSC  brings together organizations who are pushing the boundaries of spatial data modelling – ranging from large enterprise, to cities and government, as well as thought leaders from academic institutions.  Shown through the use of geospatial applications and organizational project initiatives, there was no doubt the common denominator and focus of those attending:  Data. It was definitely worth the trip.  SDSC is similar, but a very different kind of a “geospatial conference” for those of us who have spent a career running in traditional government geospatial circles.  Attendees and presenters are largely a completely different make-up from those normally attending the annual New York State GIS conferences.  (Of the 500+ preconference registrants, nearly 55% were from the private sector).   The day’s event included high quality presentations on the latest in modelling techniques, data science and analytics, visualization practices, and new data streams.  This later issue an increasingly important and interesting one across the statewide geospatial community as the day’s conversation clearly illustrated both the growing number of online geospatial data sources  (for example, numerous references were made to U.S. Census Bureau American Community Survey) and related data access tools.  Speakers noted both the importance and benefits of open data portals though not without the caveat that it was not uncommon to have to clean and often normalize the data prior to using in applications.  Numerous references to popular sites such as GitHub, Leaflet, OpenStreetMap, and Elastic (which presented at the event) were made with regard to supporting the open source ecosystem.

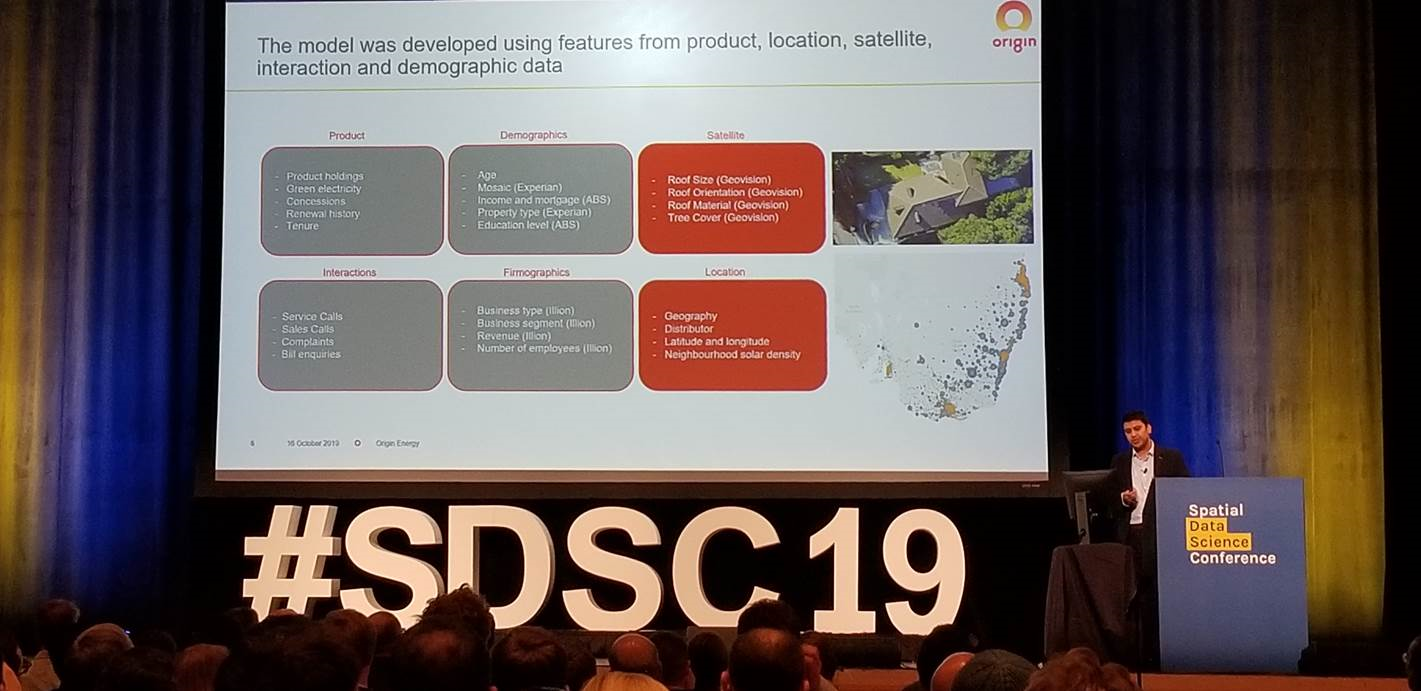
Mudit Srivastav from Australia-based Origin Energy, presented on the use of spatial data to support the increase sales of residential roof top solar panels. Note the many types of data the company is using to better define growth areas.

Data for the Social Good

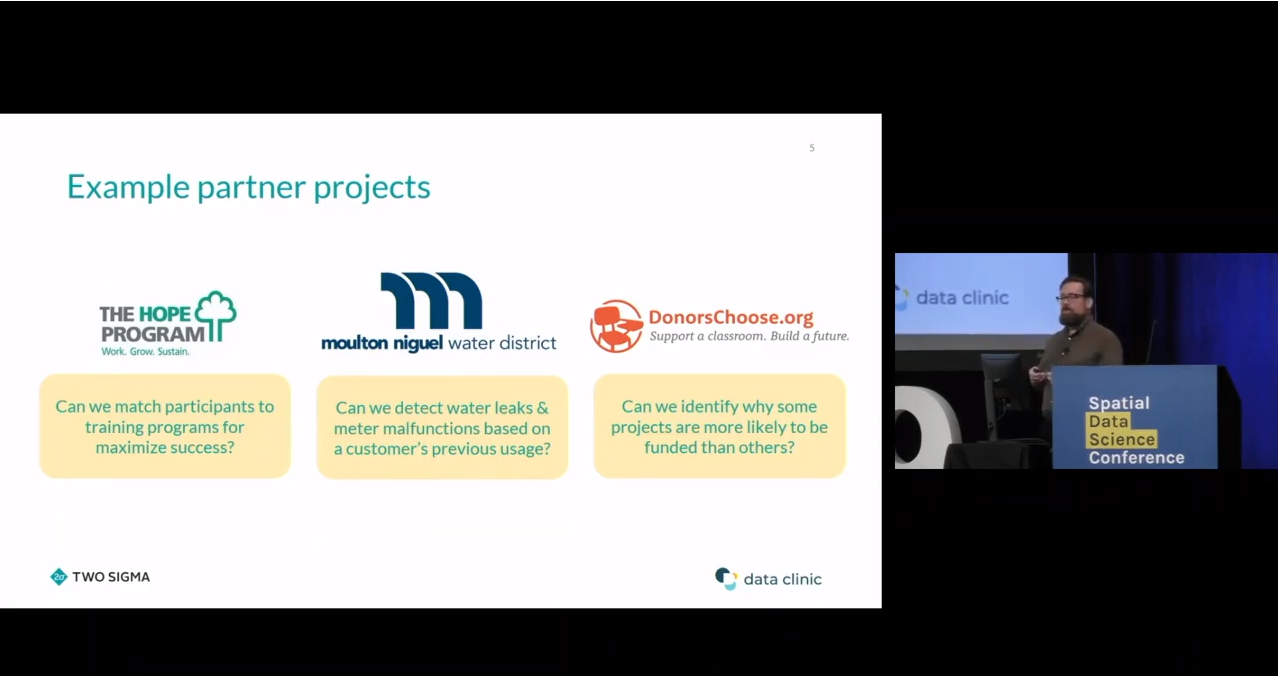
Another common theme throughout the day was the use of geospatial data for the social good.  Interesting to hear the point being made not only from nonprofits and academia, but from the private sector as well.  Way far away from the normal Albany GIS crowd, Stuart Lynn made a presentation focusing on how Two Sigma, an investment management firm located in New York City, provides spatial analysis support through the company’s Data Clinic program to nonprofits, academic institutions, and government organizations.  Their focus:  Enabling and promoting social impact through data driven predictive models while funding breakthrough research, education and a wide range of charities and foundations.    The image below identifies some of their recent projects.  Great stuff and I’m already planning on a more in-depth article with Stuart in the future.

Enabling Social Impact Organizations with Spatial Analysis Techniques

Stuart’s talk, as well as others during the day, made reference to the  The Data for Good movement which was a social media movement first started by DataKind to highlight how data science could be used to help address a range of humanitarian issues. DataKind is a collaborative network of organizations that work together with data scientists to leverage the science of data for social impact.  DataKind’s afternoon presentation “Spatial Data Science for Social Good:  Improving Access to Dignified Sanitation in Haiti” was excellent.  The video for this session and all of the day’s presentations are now available online at the Spatial Data Science Conference website.

Arguably, the demand for “data scientists” will increasingly intersect and expand in government geospatial programs in areas such as the health and human services, climate change, public safety, sustainability and resiliency,  and social and environmental justice to name only a few.   As the universe of geospatial data continues to expand and be integrated with both new artificial intelligence (AI) and machine reading technologies, as well as combined with the availability of more powerful GIS software, it is easy to see where the demand for data scientists focusing on locational and predictive analytics is headed.

I asked Javier de la Torre, Carto founder and SDSC organizer, what his impressions were of the day’s presentations and content.  He replied:

“First, moving the data discussion from WHERE to Why. Time to move to analyzing data using maps opposed to just seeing data in maps.  Second, the rise of the Spatial Data Scientist and/or where advance GIS is emerging as a new platform. And third, identifying the need for better data marketplaces which provides interactive solutions resulting in increased performance to users”

Links to the 2017 and 2018 presentations are also available on the SDSC website.

Mobility for All Abilities Hackathon

While I personally did not attend the September 21st Mobility for All Abilities Hackathon at the  Brooklyn Army Terminal, I had originally intended to put together a short summary article to post on the day’s events and activities after gathering information from BetaNYC staff.  But instead, check out BetaNYC’s own detailed summary here – its quite good.

The event coincided with the 2019 National Day of Civic Hacking and was co-hosted by by BetaNYC and MakerSpace NYC which partnered with  NYC Department of Transportation, NYC Mayor’s Office of People with Disabilities, NYC Mayor’s Office of Data Analytics, and other organizations to setup eight challenges for a day-long map-a-thon and civic hacking to improve mobility equity in New York City.  Incredible results!

New York City Council Member Brad Lander provided opening remarks at the Mobility for All Abilities Hackathon. Photograph by Charlie Hartwell / CC BY

I’ve written about BetaNYC before and they have presented at the Westchester GIS User Group meeting in the past. They fill a much needed and recognized space in metro NYC towards facilitating these types of technology/geospatial events which can serve as a model for similar civic focused programs across the state.

For more information on their programs and activities, visit the BetaNYC website.


10 Questions / Preguntas: Daniel Munoz

Daniel Munoz, GIS Manager, Orange County GIS Division, has been an integral part of the Orange County GIS program for over twenty years and involved in geospatial initiatives in municipalities across the county as well.  Somewhat atypical of how other county programs across the Empire State originally evolved, Daniel led implementation of the countywide effort from its beginning from inside the Orange County Water Authority and later on overseeing development into key enterprise programs in the areas of Real Property Tax Services and Emergency Services.  With Spanish being his native language, I also asked Daniel to offer any thoughts/ideas on how to expand and provide geospatial tools to the growing Spanish speaking populations across the Empire State. In further supporting this issue, this eSpatiallyNewYork post is published in both Spanish and English.

Daniel Muñoz, Gerente del SIG, Condado de Orange División de SIG, ha sido una parte integral del programa SIG del Condado de Orange por más de veinte años y también ha participado en iniciativas geoespaciales en los municipios del condado. Un poco diferente de cómo evolucionaron estos programas en otros condados en el Empire State, Daniel dirigió la implementación de los esfuerzos del condado desde el inicio en el Departamento de Agua del Condado de Orange y luego supervisó el desarrollo de programas claves en las áreas de Servicios de Impuestos de Bienes Inmuebles y Servicios de Emergencia. Como el español es su lengua materna, también le pedí a Daniel que ofreciera conceptos / ideas sobre cómo expandir y proporcionar herramientas geoespaciales a las crecientes poblaciones de habla hispana a través del Empire State. Para respaldar aún más esta situación, esta publicación de eSpatiallyNewYork es disponible tanto en español como en inglés.

1.  eSpatiallyNewYork: Let’s start from the beginning.  Where are you originally from and when/how did you end up in Orange County government?

Munoz:  Here is the short story! I’m originally from Mexico City where I earned my Professional Engineer (P.E.) stripes.   I graduated as an industrial engineer from the Autonomous Metropolitan University of Mexico City and initially worked as computer system analyst for an international kitchen appliance company. I was fine with reading English and working with computers programing languages, but struggled with conversational English.  Since I had friends in the city,   I decided to move to Boston, Massachusetts to learn English.  While there I met a woman from Orange County which I married and ultimately moved to Orange County.

eSpatiallyNewYork:  Empecemos por el principio.  De donde eres originalmente y cuando o como terminaste en el gobierno del Condado de Orange?

Munoz: Esta es la historia corta! Soy originario de la Ciudad de México donde obtuve mi titulo de Ingeniero.   Me gradué de Ingeniero Industrial  de la Universidad Autónoma Metropolitana de la Ciudad de México inicialmente trabaje de Analista de Sistemas de Computación para una compañía internacional de electrodomésticos de cocina.  No tenia problemas leyendo ingles y trabajando con lenguajes de programación de computadoras, pero me costaba trabajo el inglés conversacional. Decidí mudarme a Boston, Massachusetts para aprender inglés ya que tenia amigos en esa ciudad. Allí conocí a una mujer del Condado de Orange con la que me casé y finalmente me mudé al Condado de Orange.

2.  eSpatiallyNewYork: What were your earliest Orange County GIS efforts?

Munoz:  I started with the Orange County Water Authority (OCWA) which is a “cousin” of county government.  My title then was digital systems analyst, which in hindsight, was “being in  the right place at the right time”. When I moved here, Orange County had not developed an E-911 system, but OCWA had started gathering  various databases and integrated computer mapping technology to create a county wide Geographic Information System.  Which ultimately led to  OCWA starting  to  serve a significant  supporting role in developing the new computerized E-911 system.  It was during this time I developed my own passion for GIS technology.   Since then I have learned about and worked in the fields of emergency management, planning, tax mapping, public works, and many other areas of county government.  We are providing and integrating data for all services!

eSpatiallyNewYork: ¿Cuáles fueron tus primeros esfuerzos de SIG en el Condado de Orange?

Munoz:  Comencé trabajando para Orange County Water Authority (OCWA) la cual es un agencia del gobierno del Condado de Orange.  Mi título entonces era analista de sistemas digitales, en retrospectiva, fue “estar en el lugar correcto en el momento adecuado”. Cuando me mude aquí, El Condado de Orange no había desarrollado el Sistema E-911, OCWA había comenzado a recopilar varias bases de datos y tecnología integrada de mapeo por computadora para crear un Sistema de Información Geográfica para todo el condado.  Lo que finalmente llevó a que OCWA comenzara a desempeñar un importante papel de apoyo en el desarrollo del nuevo sistema computarizado E-911. Fue durante este tiempo que desarrollé mi propia pasión por la tecnología SIG. Desde entonces, he aprendido y trabajado en los campos de gestión de emergencias, planificación, asignación de impuestos, obras públicas y muchas otras áreas del gobierno del condado. ¡Estamos proporcionando e integrando datos para todos tipo de servicios!

3.  eSpatiallyNewYork: Do you remember the version of ARC/INFO you got started with and what ESRI products are you using today?

Munoz:  Oh boy.  I do and this really dates  me!   My GIS experience didn’t start with ARC/INFO, I started with ArcView 1.0 with option to update to 1.0a.  I still have the box almost intact with the 5¼” installation floppy disks (picture below). We did most of the work with ArcCAD an ESRI plugin for AutoCAD. My first interaction with ARC/INFO was at Version 7. Nowadays we try to keep up to date as much as possible but avoiding the “bleeding edge”. We are in the process of moving our full enterprise GIS to V 10.6.1. I use the full ArcGIS suite including  ArcServer and  ArcMap with the following extensions:  Network Analyst, Spatial Analyst and 3D Analyst.   I have tried ArcGIS Pro but still has some issues.  As far as the web environment, I created all of our websites with the old ESRI flash builder and have started to update them with Web AppBuilder.
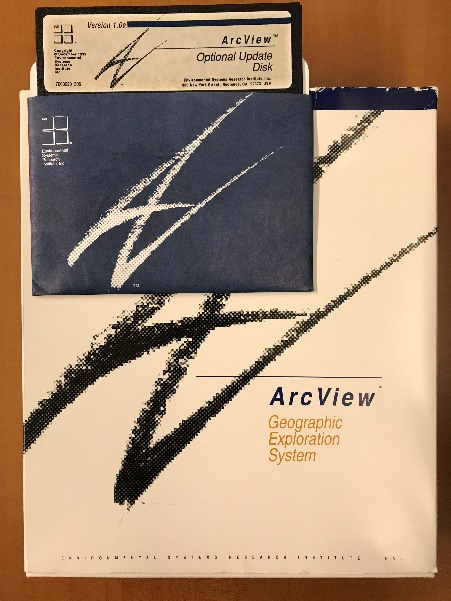
Like many others across the state, Daniel got his start with desktop ArcView software.  Still an ESRI favorite to seasoned GIS professionals.

eSpatiallyNewYork:  ¿Recuerdas la versión de ARC/INFO con la cual comenzaste y que productos de ESRI usasactualmente?

Munoz:  Ay Caramba! Recuerdo bien y revela cuanto tiempo ha pasado! Mi experiencia en SIG no comenzó con ARC/INFO, comencé con ArcView 1.0 con la opción de actualizar a 1.0a. Todavía tengo la caja casi intacta con los discos de instalación de 5¼ ” (imagen abajo). La mayor parte del trabajo fue echo con ArcCAD una extensión de ESRI para AutoCAD. Mi introducción con ARC/INFO fue en la versión 7.0. Hoy en día tratamos de mantenernos actualizados tanto como sea posible, pero evitamos estar a la “vanguardia”. Estamos en el proceso de actualizar nuestro completo SIG a la versión 10.6.1. Uso el paquete completo de ArcGIS, incluyendo ArcServer y ArcMap con las siguientes extensiones: Network Analyst, Spatial Analyst y 3D Analyst. He tratado ArcGIS Pro pero todavía tiene algunos problemas. Entorno de la web, construí  todas nuestras paginas de web con la antigua tecnología de flash pero ya comencé a actualizarlos con la tecnología de Web AppBuilder.

4.  eSpatiallyNewYork: You left GIS  for a while to take another position in County Information Technology –  but then came back to GIS.  Tell us about that.

Munoz:  For me,  GIS & IT always go hand to hand.  While working  for the County,  I always found myself splitting my work projects between GIS & IT.  At the beginning of my career in order to build a better GIS program I had to build a better IT infrastructure.   During this time, I obtained a Windows & Network professional certification. Having this expanded  IT background gave me the opportunity to move to an IT Director position which at the time was a good professional advancement for me.   Two years ago, the County decided to upgrade the County’s  GIS and I was asked  to be part of the team to interview  candidates and  proposals. Going through this process reminded me how much I enjoyed geospatial technology so I made the decision to move back to managing the Orange County GIS program.

eSpatiallyNewYork:  Dejaste el SIG por un tiempo para tomar otra posición en el departamento de Información Tecnología del Condado – pero luego regresaste al SIG. Platícanos a cerca de esto.

Munoz:  Para mí, el SIG & la IT siempre van de la mano. Mientras trabajaba para el Condado, siempre me encontraba dividiendo mi tiempo y proyectos de trabajo entre SIG y IT. Al comienzo de mi carrera, para construir un mejor sistema de SIG tuve que construir una mejor infraestructura de IT. Durante este tiempo, obtuve una certificación profesional de Windows y Redes. Teniendo esta experiencia ampliada en IT me dio la oportunidad de cambiarme a un puesto de director de IT, lo que en ese momento fue un buen avance profesional para mí. Hace dos años, el Condado decidió actualizar el SIG del Condado y me pidieron que formara parte del equipo para entrevistar a los candidatos y sus propuestas. Ser parte de este proceso me recordó lo mucho que disfrutaba la tecnología geoespacial, así que tomé la decisión de regresar a dirigir el SIG del Condado de Orange.

5.  eSpatiallyNewYork: So which areas of County government are the biggest users of geospatial technology?

Munoz:  Definitely Emergency Services!   They have three divisions working  24×7 using and creating data everyday.  Second would be the Planning Department and following very close the Department of Public Works.

eSpatiallyNewYork:  Entonces, ¿Qué áreas del gobierno del Condado tiene los mayores usuarios de tecnología geoespacial?

Munoz:  Definitivamente el departamento de Servicios de Emergencia! Este departamento tiene tres divisiones que  trabajan 24×7 usando y creando datos todos los días. Segundo sería el Departamento de Planificación y siguiéndolo muy de cerca el Departamento de Obras Públicas.

6.  eSpatiallyNewYork:  The County still offers hardcopy maps, shapefiles, and other products for download.  How has this changed, if at all, over the years?

Munoz:  It seems that technology is always driving the associated GIS changes.  The GIS offices are quieter these days as the phones don’t ring as much.  We use to answer the phone constantly to take requests, return calls to inform the caller their  request had been completed.  Today, our online automated GIS request website has taken care of many of these issues.   Individuals can create accounts, make  mapping or data requests, and be notified when the request has been fulfilled with instructions on how to obtain the request.  The website also has an area for data downloads and can notify registered users when County data layers have been updated by our staff.

eSpatiallyNewYork:  El Condado todavía ofrece mapas impresos, shapefiles y otros productos para descargar. ¿Cómo ha cambiado esto, si es que ha cambiado, con los años?

Munoz:  Parece que la tecnología siempre está impulsando los cambios asociados al SIG. Las oficinas de SIG son más silenciosas en estos días ya que los teléfonos no suenan tanto. Solíamos contestar el teléfono constantemente para recibir pedidos, devolver llamadas a nuestros usuarios para informarles que su pedido esta completo. Hoy en día, nuestro sitio de web tiene un sistema de pedidos automatizados y se ocupa de muchos de estos problemas. Las personas pueden crear cuentas, realizar pedidos de mapas o datos y recibir notificaciones automatizadas cuando el pedido se haya cumplido e instrucciones sobre cómo obtenerlo. El sitio web también tiene un área para descarga de datos y puede notificar a los usuarios registrados cuando nosotros actualizamos las bases de datos del Condado.

7.  eSpatiallyNewYork: Any integration with the AutoCAD environment?

Munoz:  Currently, a  small group of engineers from DPW and the tax mapping division are the only ones that still use AutoCAD.  Some years ago the tax mappers started to maintained the parcel boundaries from their tax maps in  an enterprise database with AutoCAD.  As  previously mentioned, our current  GIS upgrade project includes moving the full tax map maintenance program  to our ArcGIS environment.  Stay tuned!

eSpatiallyNewYork:  ¿Alguna integración con el programa de AutoCAD?

Munoz:  Actualmente, solo un pequeño grupo de ingenieros de el Departamento de Obras Públicas y la división de mapas de cadastro son los únicos que todavía utilizan AutoCAD. Hace algunos años, los mapas de cadastro se comenzaron a mantener a través de una base de datos con AutoCAD. Como se mencionó anteriormente, nuestro proyecto actual de actualización del SIG incluye mover el programa de mantenimiento de mapas de cadastro a nuestro sistema de ArcGIS. ¡Mantente al tanto!

8.  eSpatiallyNewYork:  As GIS Manager, what are your biggest challenges today?

Munoz:  I would have to say staffing.  Believe it or not in the last two years I have had to replace the GIS technician positions four times.  While each time each person has been  a competent young professional,  It seems to me the new generation of GIS technicians wants to keep moving on with the next opportunity for advancement.  As opposed to staying in one place for while and building a career in one place.   I find myself training people to see them gone within  6 – 12 months.   A huge challenge!

eSpatiallyNewYork:  Como Gerente de SIG, ¿cuáles son tus mayores desafíos hoy?

Munoz:  Tendría que decir que es el personal. Lo creas o no, en los últimos dos años he tenido que reemplazar las posición de técnico en SIG cuatro veces. Cada vez la persona ha sido un joven profesional competente, pero me parece que la nueva generación de técnicos en SIG siempre anda buscando la próxima oportunidad de avance. A diferencia de permanecer en un lugar por un tiempo y construir una carrera en ese lugar. Me encuentro entrenando personas para que desaparezcan en los próximos 6 – 12 meses. ¡Un gran reto!

9.  eSpatiallyNewYork: What’s the next big geospatial thing in Orange County?

Munoz:  The County is finalizing the Orange County Shared Services Property Tax Savings Plan.  One section in particular reads:

The County of Orange will offer geographic information services (GIS) to any and all of its 43 municipalities. This will include all cartography and geographic data services such as map development, maintenance and printing.

Coordinating and standardizing 43 municipalities will be our biggest project and will keeps us busy for a good while.  I’m hoping for staff continuity!

eSpatiallyNewYork:  ¿Cuál es la próxima gran cosa geoespacial en el Condado de Orange?

Munoz:  El Condado está finalizando el Plan de Servicios Compartidos de Ahorro de Impuestos de la Propiedad del Condado de Orange. Una sección en particular dice:

El Condado de Orange ofrecerá servicios de información geográfica (SIG) a todos y cada uno de sus 43 municipios. Esto incluirá todos los servicios de cartografía y servicio de datos geográficos, como el desarrollo de mapas, el mantenimiento y la impresión.

Coordinar y estandarizar 43 municipios será nuestro mayor proyecto y nos mantendrá ocupados por un buen rato. ¡Espero y el personal sea continuo entonces!

10.  eSpatiallyNewYork:  You are of Hispanic background.  Do you have any thoughts or ideas on how GIS technology could be extended to the regional Spanish speaking population?  Where and how would you start?

Munoz:  The beauty of GIS is that it can help everyone in so many ways.  But the challenge continues to be building applications which are relevant, accessible, and easy to use.  Research show that Hispanics are less likely to have an internet connection at home.  Hispanics are early technology adopters, and Hispanics are mobile-first community. These statements contradict each other a bit but it is because the Hispanic demographic is young. Based on this information I would focus available resources to build, design and post GIS apps in Spanish on mobile platforms (cell phones and tablets) where we know Hispanics are spending their time. These early adopters will spread the message among their social groups faster than any other method.

eSpatiallyNewYork:  Eres de origen hispano. ¿Qué piensas o que ideas tienes sobre cómo la tecnología de Sistemas de Información Geográfica (SIG) podría extenderse a la población regional de habla hispana? ¿Dónde y cómo empezarías?

Munoz:  Lo bonito del SIG es que ayuda a todos, pero debemos asegurarnos de distribuirlo a ellos. Las investigaciones demuestran que los Hispanos tienen la menor probabilidad de tener una conexión de internet en casa, los Hispanos adoptan la tecnología tempranamente y son una comunidad que usan los dispositivos móviles primero. Estas declaraciones se contradicen un poco, pero es debido a que la demografía hispana es joven. Basado en esta información yo pondría todos los recursos disponibles en crear, diseñar y publicar aplicaciones de SIG en plataformas móviles (teléfonos celulares y tabletas) donde sabemos que los Hispanos pasan la mayoría de su tiempo. Estos pioneros difundirán el mensaje atreves de sus redes sociales más rápido que cualquier otro método.

The Geography of an Adirondack High Peaks Unsupported Thru-Hike Record

Background

Since early July this summer when our youngest son Lukas and close friend Mike Jock completed and established  a new record for an unsupported thru-hike of the 46 Adirondack High Peaks, I’ve been asked by various friends and colleagues across the region (who became aware of the accomplishment) as to whether or not any professional geospatial/GIS technology was used in some capacity in supporting the effort.   Each time my humbling answer has been pretty much the same:  Not Really.  However, they did carry some new gadgetry which is currently used ubiquitously across the adventure and extreme sports landscape to collect data that was used to authenticate their achievement.  But more on that later.

Starting their trek at the trail head to Seward Mountain at 3:30 AM Thursday, June 27th on the west side of the Adirondacks, the two covered the 46 High Peaks in 7 days, 2 hours, and 52 minutes finishing by summitting Mount Esther, on the northern shoulder of Whiteface shortly after 3 AM on July 4th. Ultimately making it down to the Mount Ester trail head at 6:20 AM to complete the trip.   All said, nearly 212 miles and 70,000 feet gained in elevation – more than twice the elevation of Mt. Everest.  They averaged well over a marathon a day, covering some 25-30 miles. On the final day they kept moving for more than 23 hours covering 45 miles.

Michael, left, and Lukas at the summit of Armstrong Mountain with Gothics Mountain in the background. The two were soccer teammates at SUNY Cortland. Mike King photo.

Preparation was more old school than one would think.  Nothing in this space replaces on-the-ground knowledge of the trails, trail junctions, where and when to bushwhack, locations of rock cairns for reference points, as well as planning and hiking/testing certain stretches of the route ahead of time.  Yeah, practice runs.  Luke had the benefit of many years of experience having first started ADK trail hiking since he was barely in kindergarten.  Like many other young children, his first “mountain” being Mt. Jo overlooking Heart Lake adjacent Adirondack Loj.  Safe to assume that through the family ties, his spatial orientation has always been pretty decent. Mike, a local boy, grew up in the Plattsburgh area.

This was their third attempt.   And such accomplishments don’t come without the element of good fortune avoiding injuries (which was the case in 2018) and a bunch of days with generally decent weather.  The 2018 attempt was also impacted due to an encounter with a black bear.  Yet another ADK backcountry hiker lesson in overnight food storage.

Given the enormity, location, and challenges of the effort, it would clearly not be safe, if not irresponsible,  to rely solely on the new generation of lightweight/handheld navigational devices as a means to lead one through the Adirondack Mountain wilderness.  There is no substitute for first-hand knowledge of the trail network and a pre-determined plan.  They carried only the essentials such as lighweight sleeping bags, tents, change of clothing, raingear, first aid/basic emergency gear, water filters,  and food.  Counting every ounce in keeping their backpacks to about 40 pounds.  Even omitting the weight of gas canisters/gas stove and in doing so did not prepare anything hot the entire trip.  Zero assistance.

Cool Gadgets

It’s amazing how far the adventure mapping and video/data collection market has evolved since GoPro technology was introduced nearly a decade ago, if not earlier.  The ability to playback Mike and Luke’s accomplishment – made available below via a series of links – is amazingly made possible by just a one simple mobile (wearable) component.  They used a Garmin Fenix 5 GPS Watch to collect X,Y and elevation data which, based on wireless connectivity, automatically uploads to Garmin Connect.  Upon completion of their hike, the entire trip dataset was downloaded to Relive an outdoor 3D video website which allows further rendering and interactive use of the data.    Two Anker PowerCore 26800 pre-charged power banks kept their phones and Garmin device charged.   Of sufficient size to recharge their phones/devices numerous times over.  They took two but in fact only needed one.   The Garmin app also collects heart rate, estimated calories burned, pace (minutes per mile), elevataion gain/loss, and total daily distance – all of which is made available in interactive and graphic form.  In addition to the default Google basemap, data can be rendered on other base maps including satellite, terrain, OpenStreetMap, and Here.  Amazingly compact, yet powerful tools.

The Daily Numbers

The following section includes a brief narrative – Mike’s own words- and links which can be used to highlight trail and body metrics as well as mapping visuals for each hiking day.  For those familiar with hiking and trekking in the Adirondacks, the visuals certainly help put Luke and Mike’s daily segments in better perspective.

Hold on to your seats.

Thursday June 27

Hiker Notes: 3:30 am depart from Corey’s Road.   Day consisted of seven mountains: Seward, Donaldson, Emmons, Seymour, Santanoni, Panther & Couchsachraga. Out and backed the first four.  Trekked approximately 10 miles to Santanoni range.  Set up camp at the base, then we went up the expressway to summit Santanoni first, followed by Panther, and then finished with Couchsachraga. We came down the Panther brook trail before staying at camp at base of expressway again. Approximately 37.84 miles.

Instructions for all similar images below: Click on map for additional graphics and daily metrics. Or click the black triangle button at the bottom of the screen to see hiker movement over the course of the day.

Instructions for all similar Relive 3D Interactive links below: Click on the icon circled in red to see daily hiker movement on top of a 3D base map and associated photos. Clicking on the “View Interactive Route” button enables the ability to interact with the map and trail data “twirling” the image to see from the north, east, south, and west perspective.

Friday June 28

Hiker Notes: From camp, hiked over to Allen mountain, out and backed it before moving up towards Colden/Avalanche Lakes. We out and backed Mount Marshall before setting up camp over the dam at Lake Colden. We summited two mountains and covered approximately 28.47 miles.

June 28thRelive 3D Interactive

Saturday June 29

Hiker Notes: The ADK Loj Loop day. Summitting eight mountains and doing a big circle before returning to the same place we camped the night before. We started by going up the backside of Colden, then Tabletop, Phelps, Street, Nye, Wright, Algonquin and finishing on Iroquis. Approximately 32.18 miles

Note: The only day “noise” was either user generated or introduced by the Garmin device itself. In the vicinity of Street and Nye – Illustrated by the “straight” additional red line. Also reflected in the Relive 3D viewer.

June 29thRelive 3D Interactive

Sunday June 30

Hiker Notes:   Audible day. Started by moving to the base of Cliff and Redfield (out and bacs), then trekking up towards Gray, Skylight, Marcy, Haystack, Basin and finishing with Saddleback. Due to it raining all day, made the game time decision to check out and head towards Johns Brook Lodge where we camped at the trailhead of Big Slide Mountain (setting ourselves up the next day to finish the Great Range and start moving east). Summitted eight mountains and covered approximately 22.5 miles.

June 30th:  Relive 3D Interactive

Monday July 1

Hiker Notes:  Out and backed Big Slide early in the AM, before climbing up towards Great Range. First we summited Lower Wolf Jaw, then Upper Wolf Jaw, Armstrong, Gothics and Sawteeth. We then headed down trail to Lower Ausable Lake. Next we did Colvin and Blake before camping between those two mountains.   In total we summited eight peaks again and covered 23.97 miles.

July 1st:  Relive 3D Interactive

Tuesday July 2

Hiker Notes: Started by ascending Nippletop, moved on over to Dial, then bushwhacked down towards the Dix Range. Once we got down from bushwhack/brook we dropped bags and then out and backed the entire Dix Range: Dix, Hough, South Dix, Grace Peak & Macomb. From there we got our bags again and then moved our stuff over to Roaring Brook and the base of Giant Mountain. In total we covered 25.26 miles and summitted seven peaks.

July 2nd:  Relive 3D Interactive

 Wednesday July 3

Hiker Notes:  The 24 hour day. Woke up at 3 am and went to get Giant and Rocky Ridge Peak (out and backs). From there we picked up our stuff again and schlepped ourselves 5.5 miles down route 73 toward Marcy airfield. Next up was cutting from one side of 73 to the Lake Placid side of 73 along the ridge trail that summitted Porter and Cascade Mountains. Off of those we had then a 10 mile stretch on route 73 and then River Road towards the trai lhead to Whiteface mountain. Using the trail by Connery pond we entered that portion at 1030 PM and was able to summit both Whiteface and then Esther by 3:15 am. About 23 hour and 30 minutes of moving time we summitted our final 6 peaks and covered 44.18 miles. Passed out for an hour and reached Memorial Highway by 06:22 AM, where a time-stamped photo was taken.

July 3nd:  Relive 3D Interactive (Part 1)  Incredible day!!

July 4th:  Relive 3D Interactive (Part 2)

Summary

Quite an effort  and on top of setting the record, between this trip and last year’s attempt, the two helped raise nearly $18,000 for the Dubin Breast Center at Mount Sinai Hospital in New York.  Their accomplishment was covered by Backpacker Magazine as well as a selected number of upstate New York online publications (UpstateNewYork and NNY360) among others.  The articles are generally similar in content though do offer more details about food and other daily nuances/items which I omitted here.  Choosing rather to highlight and focus on the immense geographic element of the effort.

Both Luke and Mike are personal trainers living and working out of New York City.  More information can be found on their website Team Adventure Portal.

The Essential New York Climate Change Science Clearinghouse

There is no lack of geographic information these days on Climate Change and its increasing impacts across the Empire State in the areas of sea level rise, rising heat indexes, more frequent and intense storms, changes to the natural environment and critical habitats, and its influence on a broad range of public health issues to name only a few.  And we see geospatial technologies at the core of sciences being used to analyze, respond, and prepare for future consequences.

Whether it be policymakers, planners, business and industry, residents or community groups, New York State is fortunate to have its own geocentric one-stop website on climate change issues as part of the New York Climate Change Science Clearinghouse (NYCCSC).   Hosted by NESCAUM (Northeast States for Coordinated Air Use Management) , NYCCSC contains documents, data, websites, tools, and maps relevant to climate change adaptation and mitigation across New York State. The goal of the NYCCSC is to support scientifically sound and cost-effective decision-making. It was developed to provide a framework where users can find information in multiple ways, including through interactive tools that use data from different sources.

Established in 2015, the site today contains nearly 2100 resources including over 200 web maps and viewers and an assortment of data products and datasets and is curated by Ingrid H. H. Zabel, Ph.D.  Initially the site was populated by resources that had been referenced in the 2011 ClimAID Report and several other key documents, as well as resources identified by groups of sector experts.  Today, the site curator continues to seek out new content from a variety of sources to keep the site current and fresh.  Submissions to the Clearinghouse are welcome though each are reviewed based on relevance, utility, credibility, and accessibility as described in the site’s Business Rules.   The underlying mission of the site is to provide resources that are relevant to communities of many different sizes around New York State, are focused on practical, applied science and that are open access as much as possible.

Dr. Zabel is assisted by a Content Team and Sector Expert Groups consisting of individuals originally involved in the development of the site, from Cornell’s Northeast Regional Climate Center, the Paleontological Research Institution,  , Northeast States for Coordinated Air Use Management (NESCAUM), Frontier Spatial, and New York State Energy and Research Development Authority (NYSERDA). The sector experts were identified by NYSERDA, NYS Department of Environmental Conservation, and the NYCCSC team, and include individuals from New York state agencies, academia, and nonprofits such as (New England Interstate Water Pollution Control Commission (NEIWPCC),  , and the New York State Floodplain and Stormwater Managers Association (NYSFSMA).

Users can explore and mine through the site via ad hoc interactive mapping, topic specific web maps, data charts, and for published documents and reports.  In addition to offering advanced search tools, site content is also grouped thematically in categories such as Climate and Weather, Sea Level, Energy, Flooding, Plants and Animals, Social and Economic, among others.

Some options on the user interface to dive in and start searching for data include:

Interactive Mapping and Web Maps

One of the focal points of the website is an interactive map of climate change and related data for New York State.   Users can select data layers to display from a menu, filter layers by sector, vary parameters within certain layers, and select from a variety of base layers and regional boundaries. For each layer, links are available to metadata and the original source. Data being made available in the viewer has been curated through more of a group effort, with the NYCCSC team getting requests and feedback from a variety of places, including project managers (NESCAUM) and sponsor (NYSERDA).

The NYCCSC interactive mapper also leverages map services from authoritative sources. For example, this GAP Land Cover Dataset is a service being published by the USGS. Users can click the ‘i’ icon for a given layer which provides metadata on relevant URLs. The interactive mapper also includes a function for the user to add a map layer of their own using the Layer Import button found along the toolbar in the upper right hand corner of the viewer (circled in red). Imported layers do not get added to the map permanently, but rather are a means to temporarily “mash-up” local data with the permanent collection of content in the application

The site is built almost exclusively with open source products and largely supported by Steve Signell at Frontier Spatial.  PostgreSQL is the geodatabase used to store and manage map layers and metadata.  A combination of Geoserver and Leaflet are used to create and manage the web services and support the user interface. Javascript and CSS coding was used to create the custom UI and map functions.

If you’re looking for standalone web and story maps for specific Empire State climate change issues – look no further. As the date of publication of this article, the site listed 203 separate maps from a wide variety of contributors including this one from Westchester County focusing on the potential impacts of sea level rise on critical infrastructure assets.

Among the many great offerings, sites found in the catalog of interest include The Natural Resources Navigator (The Nature Conservancy), New York State Geographic Information Gateway (NYS Department of State), Surging Seas Risk Zone Map:  New York (Climate Central), Environmental Justice Screening and Mapping Tool (U.S. Environmental Protect Agency), and Trees for Tribs Statewide Data Explorer (New York Natural Heritage Program) to name only a few.

Climate Data Grapher

User-generated time series graphs of climate data, both observed and projected (future and historical.)  The data grapher provides access to climate data which can be summarized by the user according to various geographic units such as counties. The same summaries are used in the maps & GIS viewer to attribute the corresponding map layers for county and watershed boundaries.  Both user interfaces (Interactive Mapping and Data Grapher) draw on the same raw data sources but offer different capabilities for query, summary and visualization.

I used the interactive graphing tool to plot Westchester’s Winter Average Temperature. It’s one of
19 types of climate related data which can be charted by either geographic area: state, county, or river basin. (Upper left hand corner pull-down). Other datasets area available by gauging and/or weather stations. The chart renders different results depending on which RCP radio button (4.5 or 8.5) is selected. RCP (Representative Concentration Pathway) 4.5 and 8.5 are scenarios of future climate change based on varying degrees of societal progress in reducing human contributions to greenhouse warming.

Documents

A wide range of documents and reports on statewide climate change issues including the author(s) or publishing agency, a pdf download option and where available a corresponding website URL. The first document itemized –  a document central to the launch of the site – is  Responding to Climate Change In New York State: The ClimAID Integrated Assessment for Effective Climate Change Adaptation in New York State: Final Report (2011) which provided information on climate change impacts and adaptation for eight sectors in New York State: water resources, coastal zones, ecosystems, agriculture, energy, transportation, telecommunications, and public health.

The 2011 ClimAID report is one of the first comprehensive and definitive compilations on the many challenges on impacts of climate change across New York State.

Summary

NYCCSC is a huge repository of geospatial and other content focusing on the ongoing and constantly evolving Empire State climate change issue being made available by a wide range of publishers including governments, academia, nonprofits, and industry.     And whereas much New York State climate change focus in recent years has concentrated on the impacts to our coastal communities (i.e., due to sea level rise, hurricanes/severe weather events, storm surges –  much of which is included in the repository), NYCCSC offers content and case studies covering the entire New York State footprint.   Sometimes, however, the scale of the data associated with individual sites can be an issue when looking at issues at the local level.   But nonetheless the data is there.  Itemized websites are always a good starting point for metadata, individual dataset downloads or access to public facing REST endpoints.  .

It takes a considerable amount of effort and oversight to keep such online clearinghouses up-to-date and to this end NYCCSC is fortunate to have an ongoing relationship with NYSERDA for continued support of the project.  NYCCSC continues to welcome submissions but does not accept every resource that is submitted. At the bottom of the site landing page there is a button labeled “Propose Content” which provides access to a form in which content can be proposed.

Contact:

Ingrid H. H. Zabel, Ph.D.
Climate Change Education Manager and Curator, New York Climate Change Science Clearinghouse
Paleontological Research Institution, Affiliated with Cornell University
(607) 273-6623, ext. 122
info@nyclimatescience.org
nyclimatescience.org

Belated News Flash: Empire State GIS Web Maps Got Juice!!

Maybe a bit of yesterday’s news, but apparently many of us in the statewide GIS/geospatial circles were asleep at the wheel this past December when Governor Cuomo signed Senate Bill 9061 amending section 4511 of the Civil Laws and Practices Rules (CLPR).  In laymen terms, the bill “gives Google Maps and other global imaging websites the presumption of accuracy when they are used as evidence in New York courts.   Information taken from similar sites (web mapping services, etc) to Google Maps would be presumed accurate unless “credible and reliable evidence” is presented showing that it is not.”   The bill was introduced by Senator Michael Gianaris (D-Queens) earlier in 2018 and approved on June 15, 2018.  I reached out to Senator Gianaris’s office to inquire regarding his interest and/or constituent support in this space, but my emails were not answered.  If you are so inclined, the full grownup version of the bill can be found here.

This downtown Peekskill, New York Google Maps image is a staple in context of submitting “imagery” as evidence in New York State courts. Though readily available and easy to access by litigants, other government-based web mapping programs across the state often contain more detailed information and are available for increased use in court cases.

The reasons for the lack of notice, or interest for that matter, are probably for a myriad of reasons.  Could be there was simply a lack of attention because the statewide geospatial community was still dizzy from excitement by passage of the National Geospatial Data Act of 2018 last fall and its anticipated benefits to government and business GIS programs across the Empire State.  (Btw – if you are keeping a GDA scorecard, here is a May 2019 presentation on how the Act is moving forward on behalf of your GIS program.)

Though having received little attention and discussion across the GIS/geospatial communication channels and/or social media, the approved S9061 2018 legislation actually received a fair amount of dialogue in New York State law journals and blogs (i.e., Bleakley & Platt, Neufeld, O’Leary & Giusto, and Sahn Ward Coschignano among others).  With no real formal monitoring process or legislative agenda to effectively influence legislation on behalf of the statewide “profession”, legislation such as S9061 may continue to go unnoticed.  By comparison in contrast to the legislative agendas and committees of aligned Empire State geospatial professions such as surveying and engineering.

While Google internet mapping content will continue to be a norm, this legislation provides the opportunity for expanded credibility on the value of government and public facing internet web mapping sites to the legal community and in support of the  judicial process.   And by extension, one of the primary reasons in passage of S9061 – cost savings – as the new law should save litigants significant time and money and speed up trails.  In some instances, litigants have had to pay for companies to fly over a desired area and photograph it at a high cost, so that a witness would be available to authenticate the picture. Passage of S9061 also represents yet another way in which New York State legal rules are changing for the better to accommodate new technology. Notes Adam Rodriguez, Esq., attorney at Bleakley & Platt in White Plains, “This is a very practical amendment to the C.P.L.R. that will promote efficiency by saving time”

Using approximately the same Peekskill footprint as the image above, this Westchester County web mapping application renders completely different data including planimetrics, utility poles, and a sanitary sewer network. Increased outreach from government GIS programs to the legal community can illustrate the detail and richness of data which can be obtained from online web mapping programs.

Of course while the legislation gives the legal community more freedom in the use of online mapping content, it still recognizes that it may not be entirely correct and gives relief to opposing parties to challenge admis­sion of the web map content through “credible and reliable evidence that the image, map, location, distance, calcula­tion, or other information” does not “fairly and accurately portray that which it is being offered to prove.”  As such, expanded use and access to online web mapping content will increasingly require attorneys to better understand both the accuracy and limitations of the geospatial products (particularly hardcopy products generated from online applications) being submitted as evidence.

Post-World War II (1947) imagery of the same Peekskill footprint. While the Westchester County 1947 photography is of outstanding quality, conversion of such panchromatic photography to digital format can often introduce various types of errors and distortions. As such, not all “online content” is always correct and the legal community will need to continue to be cautious – and educated – about using “as is” online web mapping products.

The bill will make New York State practice consistent with Federal practice, which allows courts to take judicial notice of Google Map images because they “can be accurately and readily determined from sources whose accuracy cannot reasonably be questioned” under Federal Rule of Evidence 201.

Another plus for our tax payer funded geospatial products.  Albeit not on a day-to-day basis, but nonetheless, providing cost efficiencies in the judicial system and a little more something for the GIS program return-on-investment (ROI).

Talk to your government attorneys or firms which represent your GIS program about Senate Bill S9061.