Geogames: The Intersection of Geospatial and Games

Behind the scenes in the various worlds of films, games, science, military, government, and even the maker culture, is how “geo” has been gradually verging/bringing all of these industries together. The proliferation of smart phones with maps and searches for food and entertainment, geotagging, as well as ride sharing has brought “geo-data” to everyone and seemingly everything.  Though geospatial data, geospatial analysis, and basic mapping and cartographic concepts have been well established for many years, it’s only been within recent years that technology has enabled science to push and combine animation and gaming with real world geometry.

Here in the Empire State, faculty at Rochester Institute of Technology (RIT),  recently ranked #4 in the United States in Video Game Design Schools, Brian Tomaszewski and David Schwartz, are currently working on this technology “convergence” supported through a grant from the National Science Foundation (NSF).  This effort combines Dr. Tomaszewki’s recognized work focusing on GIS (geographical information systems) applications in the areas of disaster management and risk assessment.  He currently serves as Associate Professor and runs the Center for Geographic Information Science and Technology. Augmenting this work is Dr. Schwartz’s background and ongoing work in game programming, prototyping, and design, which he uses to build academic collaborations across RIT program areas including liberal and visual arts, engineering, business, and now the geospatial sciences. He serves as Director and Associate Professor in the  School of Interactive Games and Media (IGM).

“The world of games has long sought academic legitimacy, which for the most part has been achieved, by demonstrating ‘seriousness,’” notes Schwartz.  Some of the best games are great at teaching players to play those games, many of which have been designed at RIT: Lost and Found (religion), IPAR (computing security), and others.

Lost & Found is a game series that teaches medieval religious legal systems with attention to period accuracy and cultural and historical context. Both games are set in Fustat (Old Cairo) in the 12th Century.

If designers can capture that same immersive engagement for learning, training, education, then game development can make traditional learning, or “non-fun” entertaining and more participatory. There have been several great examples, and there are all kinds of offshoots with government, military, humanitarian, scientific applications, e.g., Instructional Design, Games for Health, and Cybersecurity.

Some of the underlying concepts and building blocks of mashing gaming and GIS software, what is called geogames and location-based games, together include, but not limited to, are:

  • Focusing on creating applications around a recent and “real life” historical event that has relevance to end users
  • Using industry accepted development tools to create the geogame
  • Demonstrate that a location-based game based on real-world data can promote and teach spatial thinking skills
  • Provide a “game” to emergency responders and local users that provides a framework for future refinements and enhancements to the game
  • Demonstrate that a serious geogames have academic and research merit

With respect to the intersection of gaming and geospatial, Pokemon Go has recently demonstrated people interacting with a virtual world “on top” of the real world, incorporating location-based data into visual interactive, decision-making environment. “The Games for Change” organization based in New York City has generated considerable attention to showing how game creators and social innovators drive real-world change using games that help people to learn, and improve their communities.

Convergence of Films and Games through GIS

One reason for the excitement on the evolution of geogames is this convergence of various disciplines, technologies, and software environments. Geogames being developed at RIT include free and open source software (FOSS), such as Open Street Map for ubiquitous baseline street data, as well as  Unity—a leading and popular game engine for rapidly making games. Unity (which is free for certain applications) has been incredibly important for the “indie” game scene, as well many other industries in professional games, movies, advertising, marketing, and more.

Other key aspects of the convergence include ESRI’s CityEngine, which historically has been used for urban design and 3D modeling.  It has had success in various films in making the worlds for Toy Story 2 and Coco. Even RIT’s hometown of Rochester, New York, was an early adopter of City Engine. Other pieces include real-world geospatial datasets, such as elevation models and flooding reach information.

Taking real-world mapping data into City Engine and then porting everything into a game engine enables game developers to visualize a real-world city or landscape. The game then renders graphics and animation,  handles interactions (player controls and responses), and embeds (through a lot more programming and design) the game rules (what happens, or outcomes, when the player interacts in specific ways.

Project Lily Pad:  Bringing the Pieces Together

Tomaszewski and Schwartz’s NSF grant and support of RIT’s computing college includes research experience for undergraduates (REU), which took eight undergraduate students from around the United States and four School of Interactive Games and Media (IGM) students from RIT to study how geogames can improve visualization for disaster planning.  Their study area was city of Dickinson, Texas, where Hurricane Harvey hit the city on August 30, 2017.

The program was developed integrating GIS and game technology by transferring (and updating) data/models from Open Street Map to ArcGIS to CityEngine and finally to Unity. Both local elevation model and flood data were used to model the city and create the game with almost real-life accuracy as best the team could in only a few weeks of summer work!

Project Lily Pad was developed over Summer 2018 with the purpose of teaching spatial thinking in terms of disaster resilience. The game is set in the city of Dickinson, Texas, which was impacted by Hurricane Harvey on August 20, 2017.

Through a series of lectures and background on geogame research, game jams (rapid prototyping of games), game design, programming, geographical information systems (GIS), spatial thinking, and more, the students developed and implemented Project Lily Pad—a serious geogame to demonstrate how to educate citizens about wayfinding in a disaster, like a flood. The name “Lily Pad” derives from the concept of higher elevations where people go to rise above flooding.

Responders in the Dickinson flooding had a chance to review the first generation of the geogame and offered suggestions. There is a new team of REU and IGM students who will collaborate this summer to improve the game, its workflow, and learn more about what a geogame can do as part of RIT’s new MAGIC building. This project is just one of many that bring together films, games, and other technology. Future ideas include investigating virtual reality (VR) for deeper immersion for players, using procedural generation for creating urban environments, and involving residents for crowd sourcing accuracy of urban environments.  It is hoped the geogame concept can be applied for planning for other disaster scenarios besides flooding. The Lily Pad user manual and a game download can be accessed here.
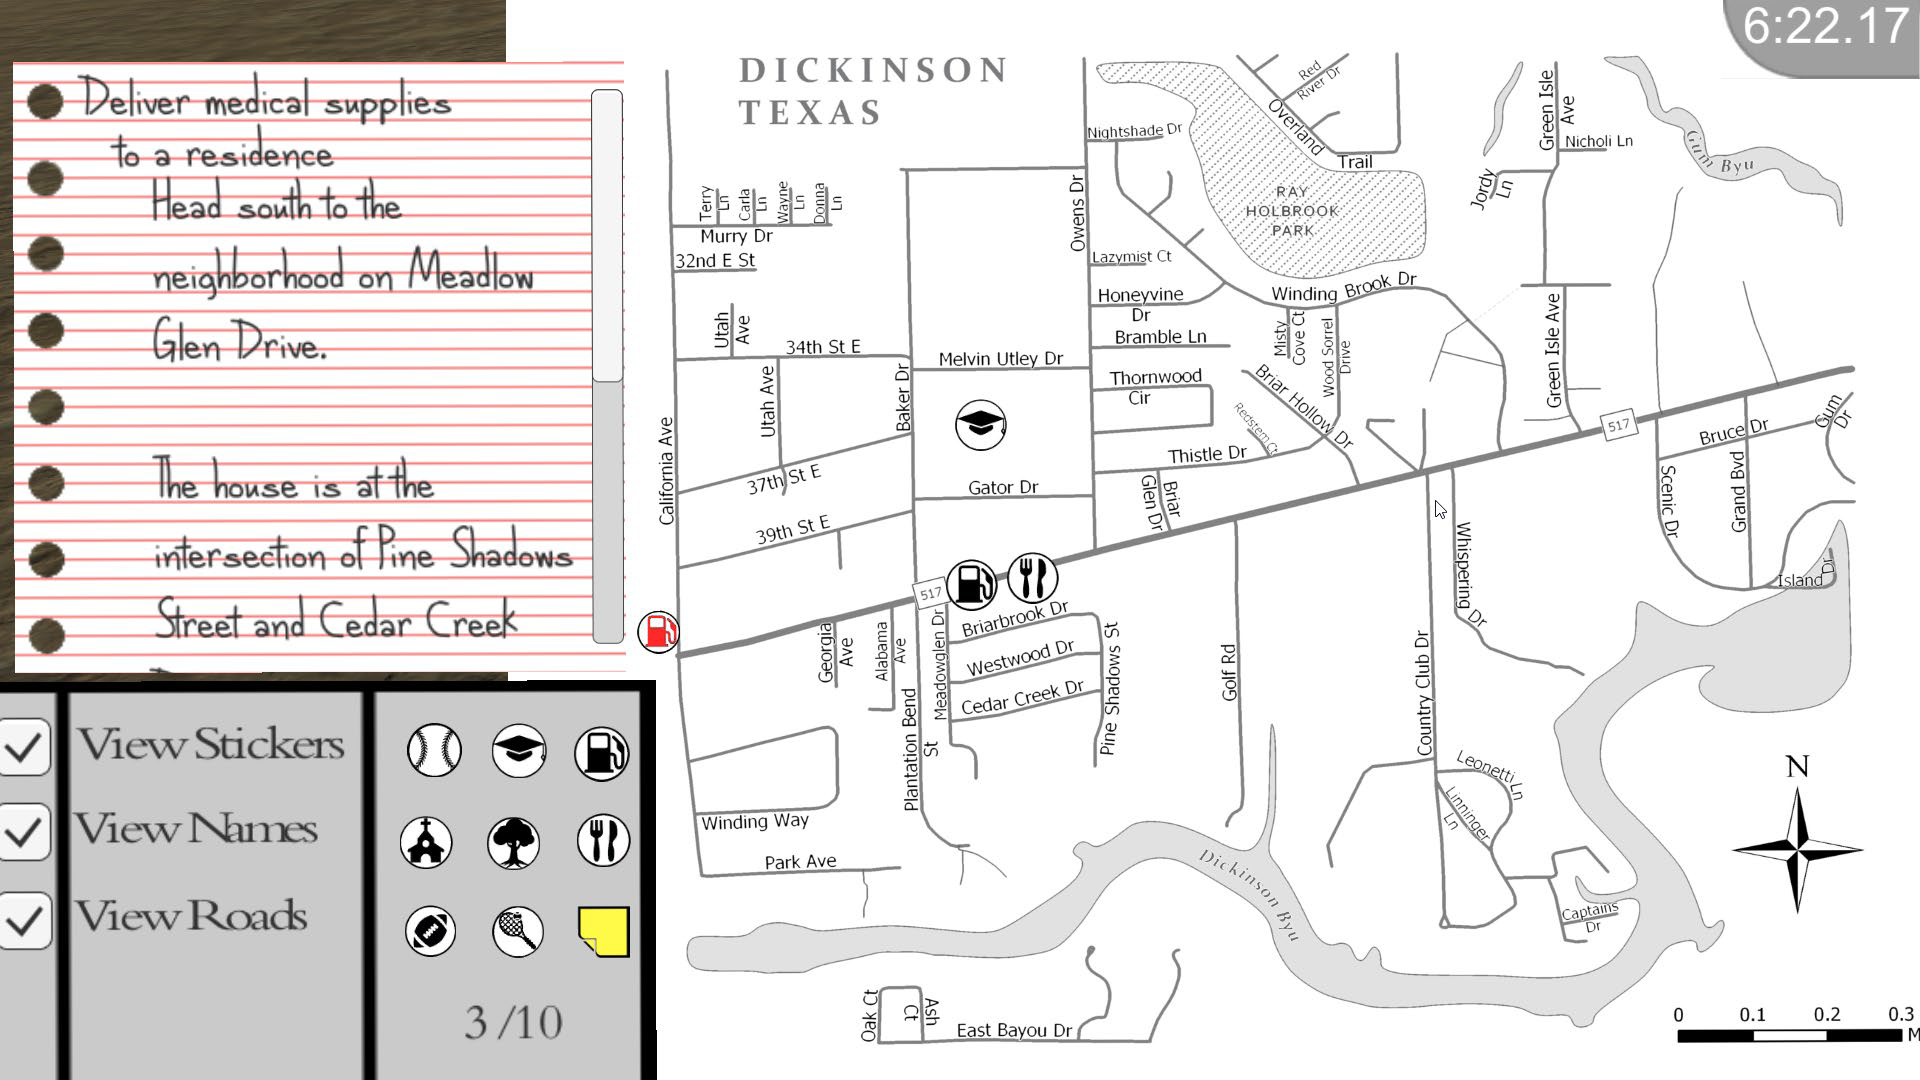
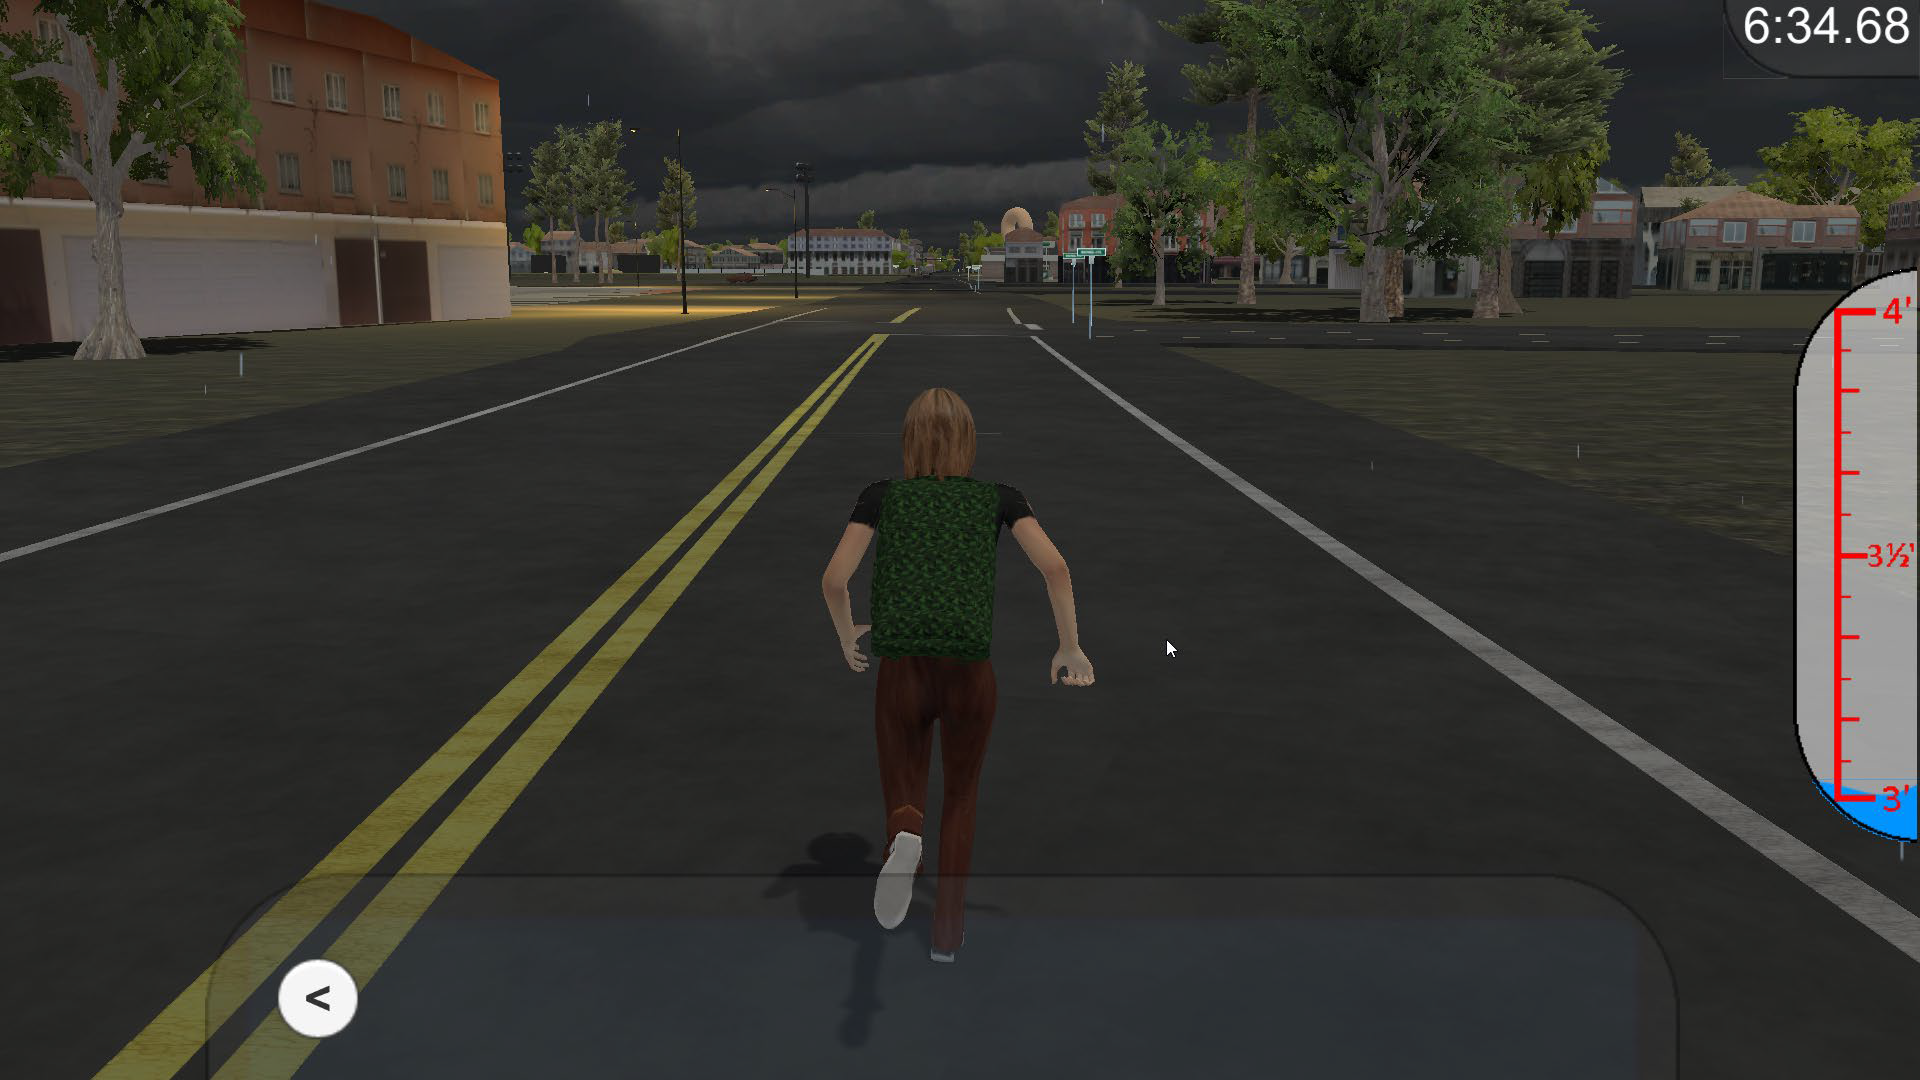
The above images are screenshots from the game. The main character has to navigate Dickinson using a “paper” map and notepad. Playing the game repeated helps the player to develop spatial reasoning of the actual town.

Summary

While the concept has been around for a while (ArcNews Summer 2017), the convergence of geospatial technologies and the game world is only now beginning to take hold in the Empire State.  We are fortunate to have work and research being done in this space at a university, which has strong and established geospatial/GIS and game development credentials. The School of Interactive Games and Media has recently hired tenure-track faculty with research interests in geogames, and so, we look forward to more from RIT in their continuing work this summer and into the coming years.

Contact: 
David Schwartz, PhD
Rochester Institute of Technology
disvks@rit.edu

Editor’s Note:  The author acknowledges the contribution of David Schwartz towards the development and content of this article.

Geospatial Business Spotlight: EagleHawk One, Inc.

Company Name:                EagleHawk One, Inc

Website:                             www.eaglehawkone.com

Established:                       2016

Employees:                       6 + Nationwide network of certified drone pilots

EagleHawk was founded in 2016 by Willard Schulmeister and Patrick Walsh in Buffalo, NY, and has grown to be one of the most successful drone data and services operations in New York State today. Together they bring years of technological and business expertise to the fast moving startup company. Willard has a Master’s degree in Geographic Data Science and Geography from the University at Buffalo and Patrick holds a Master’s degrees in Aerospace Mechanical Engineering from the Rochester Institute of Technology as well as an MBA from Rollins College. Both are licensed sUAS (drone) pilots with the Federal Aviation Administration. EagleHawk has recently added Jonathan Byrd to its executive team. Jon holds an MBA from Harvard Business School and has over 15 years of experience in strategy, finance, engineering, and operations, and has held leadership roles in a variety of companies and industries. EagleHawk’s professional staff includes engineers, pilots, data scientists and industry experts located at their offices in Buffalo, Syracuse, Charlotte and Orlando, as well as other remote locations in the U.S.

EagleHawk has built a solid reputation within the drone community and has completed work for over 100 customers to date, many of which are repeat clients. EagleHawk is a Launch NY portfolio company and an Esri Emerging Business Partner. They are active in the NYS GIS Association and in both the central and western NYS GIS  communities. EagleHawk recently won $500,000 prize in GENIUSNY, the world’s largest business accelerator program for drone systems and technology based in Syracuse, NY.

Geospatial Products and Services

EagleHawk provides a portfolio of specialized services, but they are most often sought out by corporations, universities, and developers for their expertise in campus-wide aerial infrared roof inspections. To date, EagleHawk has inspected over 800 buildings and has found that nearly 80% of those roofs show signs of leaking.

The company has established a routine inspection program that empowers clients with a means to proactively manage and extend the average lifespan of their roofs, enabling a logical and fiscally responsible approach to capital planning and budgeting for roof maintenance. EagleHawk is currently developing a GIS-based asset management software solution that uses artificial intelligence and machine learning to derive meaningful insights from the data they collect.

EagleHawk specializes in the following areas:

  • Geographic Data Collection and Map/Data Processing
  • University and Corporate Campus Physical Inspections
  • Aerial Infrared Roof and Building Analysis
  • Utility and Infrastructure Inspections
  • Sensor Integration with UAV’s

A more detailed listing of EagleHawk’s services can be found at: www.eaglehawkllc.com/droneservices

University and Corporate Campus Mapping & Inspections

EagleHawk has conducted several large inspections for universities and corporate campuses throughout the Eastern United States.  For these projects, the campuses are carefully mapped in order to generate useful information for the inspection, such as building dimensional information, or roof elevation profiles.  EagleHawk conducts both façade and roof inspections  using advanced thermal imagers to detect issues not visible to the naked eye. EagleHawk certified data analysts conduct a building-by-building evaluation and generate meaningful insights from the data collection.

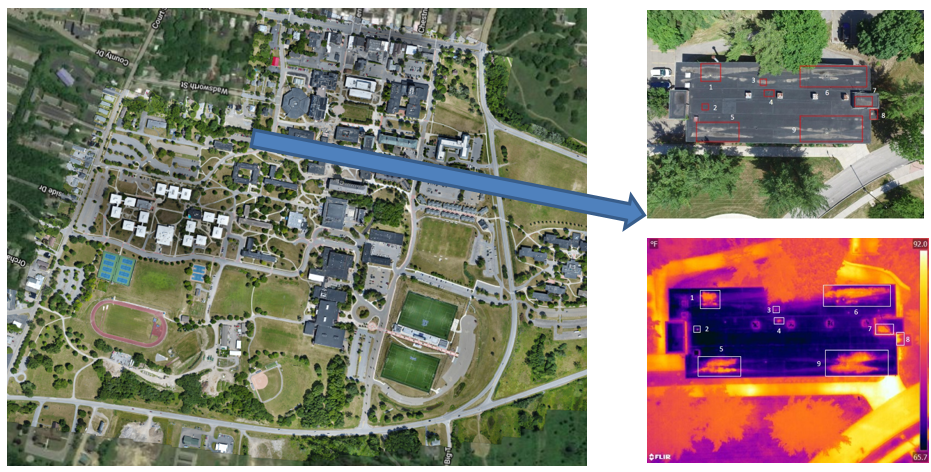
This image, from a SUNY campus, identifies wet and areas of concern within the building roof insulation invisible to the naked eye.  These areas are within the georeferenced “red rectangles” in the upper right image.

Pre-Construction Site Analysis

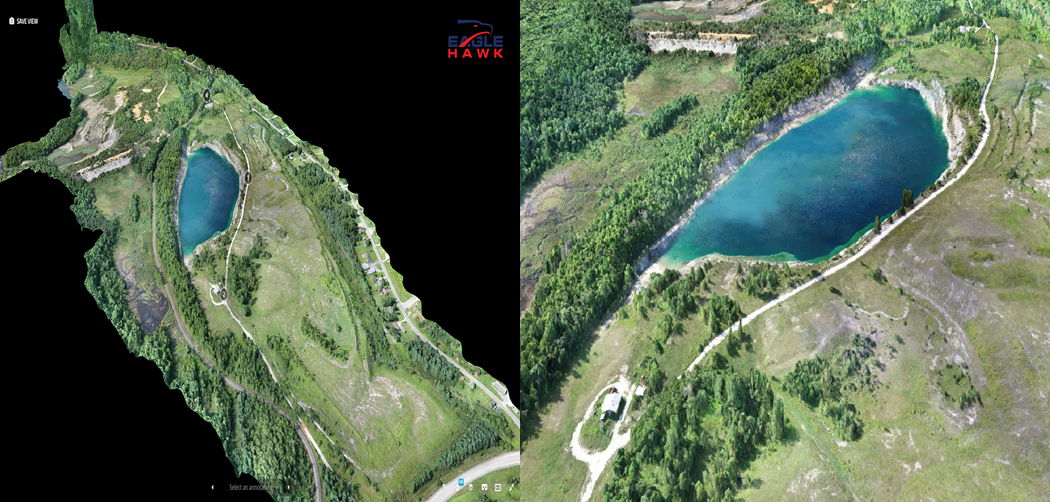
For this project EagleHawk collected approximately 550 acres of map data and imagery over a rural area in upstate New York for a client. Elevation data was needed for a pre-construction site analysis in order to determine if the area was viable for development.  EagleHawk generated an orthomosaic map, elevation contours and a massive 3D point cloud which allowed for critical decision making regarding plans at the site. This project was a great example of the benefits of drones in capturing geographic data for a large site effectively and efficiently.

For this upstate project, EagleHawk used two drones with 20MP cameras to collect imagery in one field day.  Imagery captured was processed to generate orthomosaic and topographic data delivered in common GIS & CAD formats. Clients receive the data as well as access to an interactive GIS with the data.

Buffalo Niagara Waterkeeper

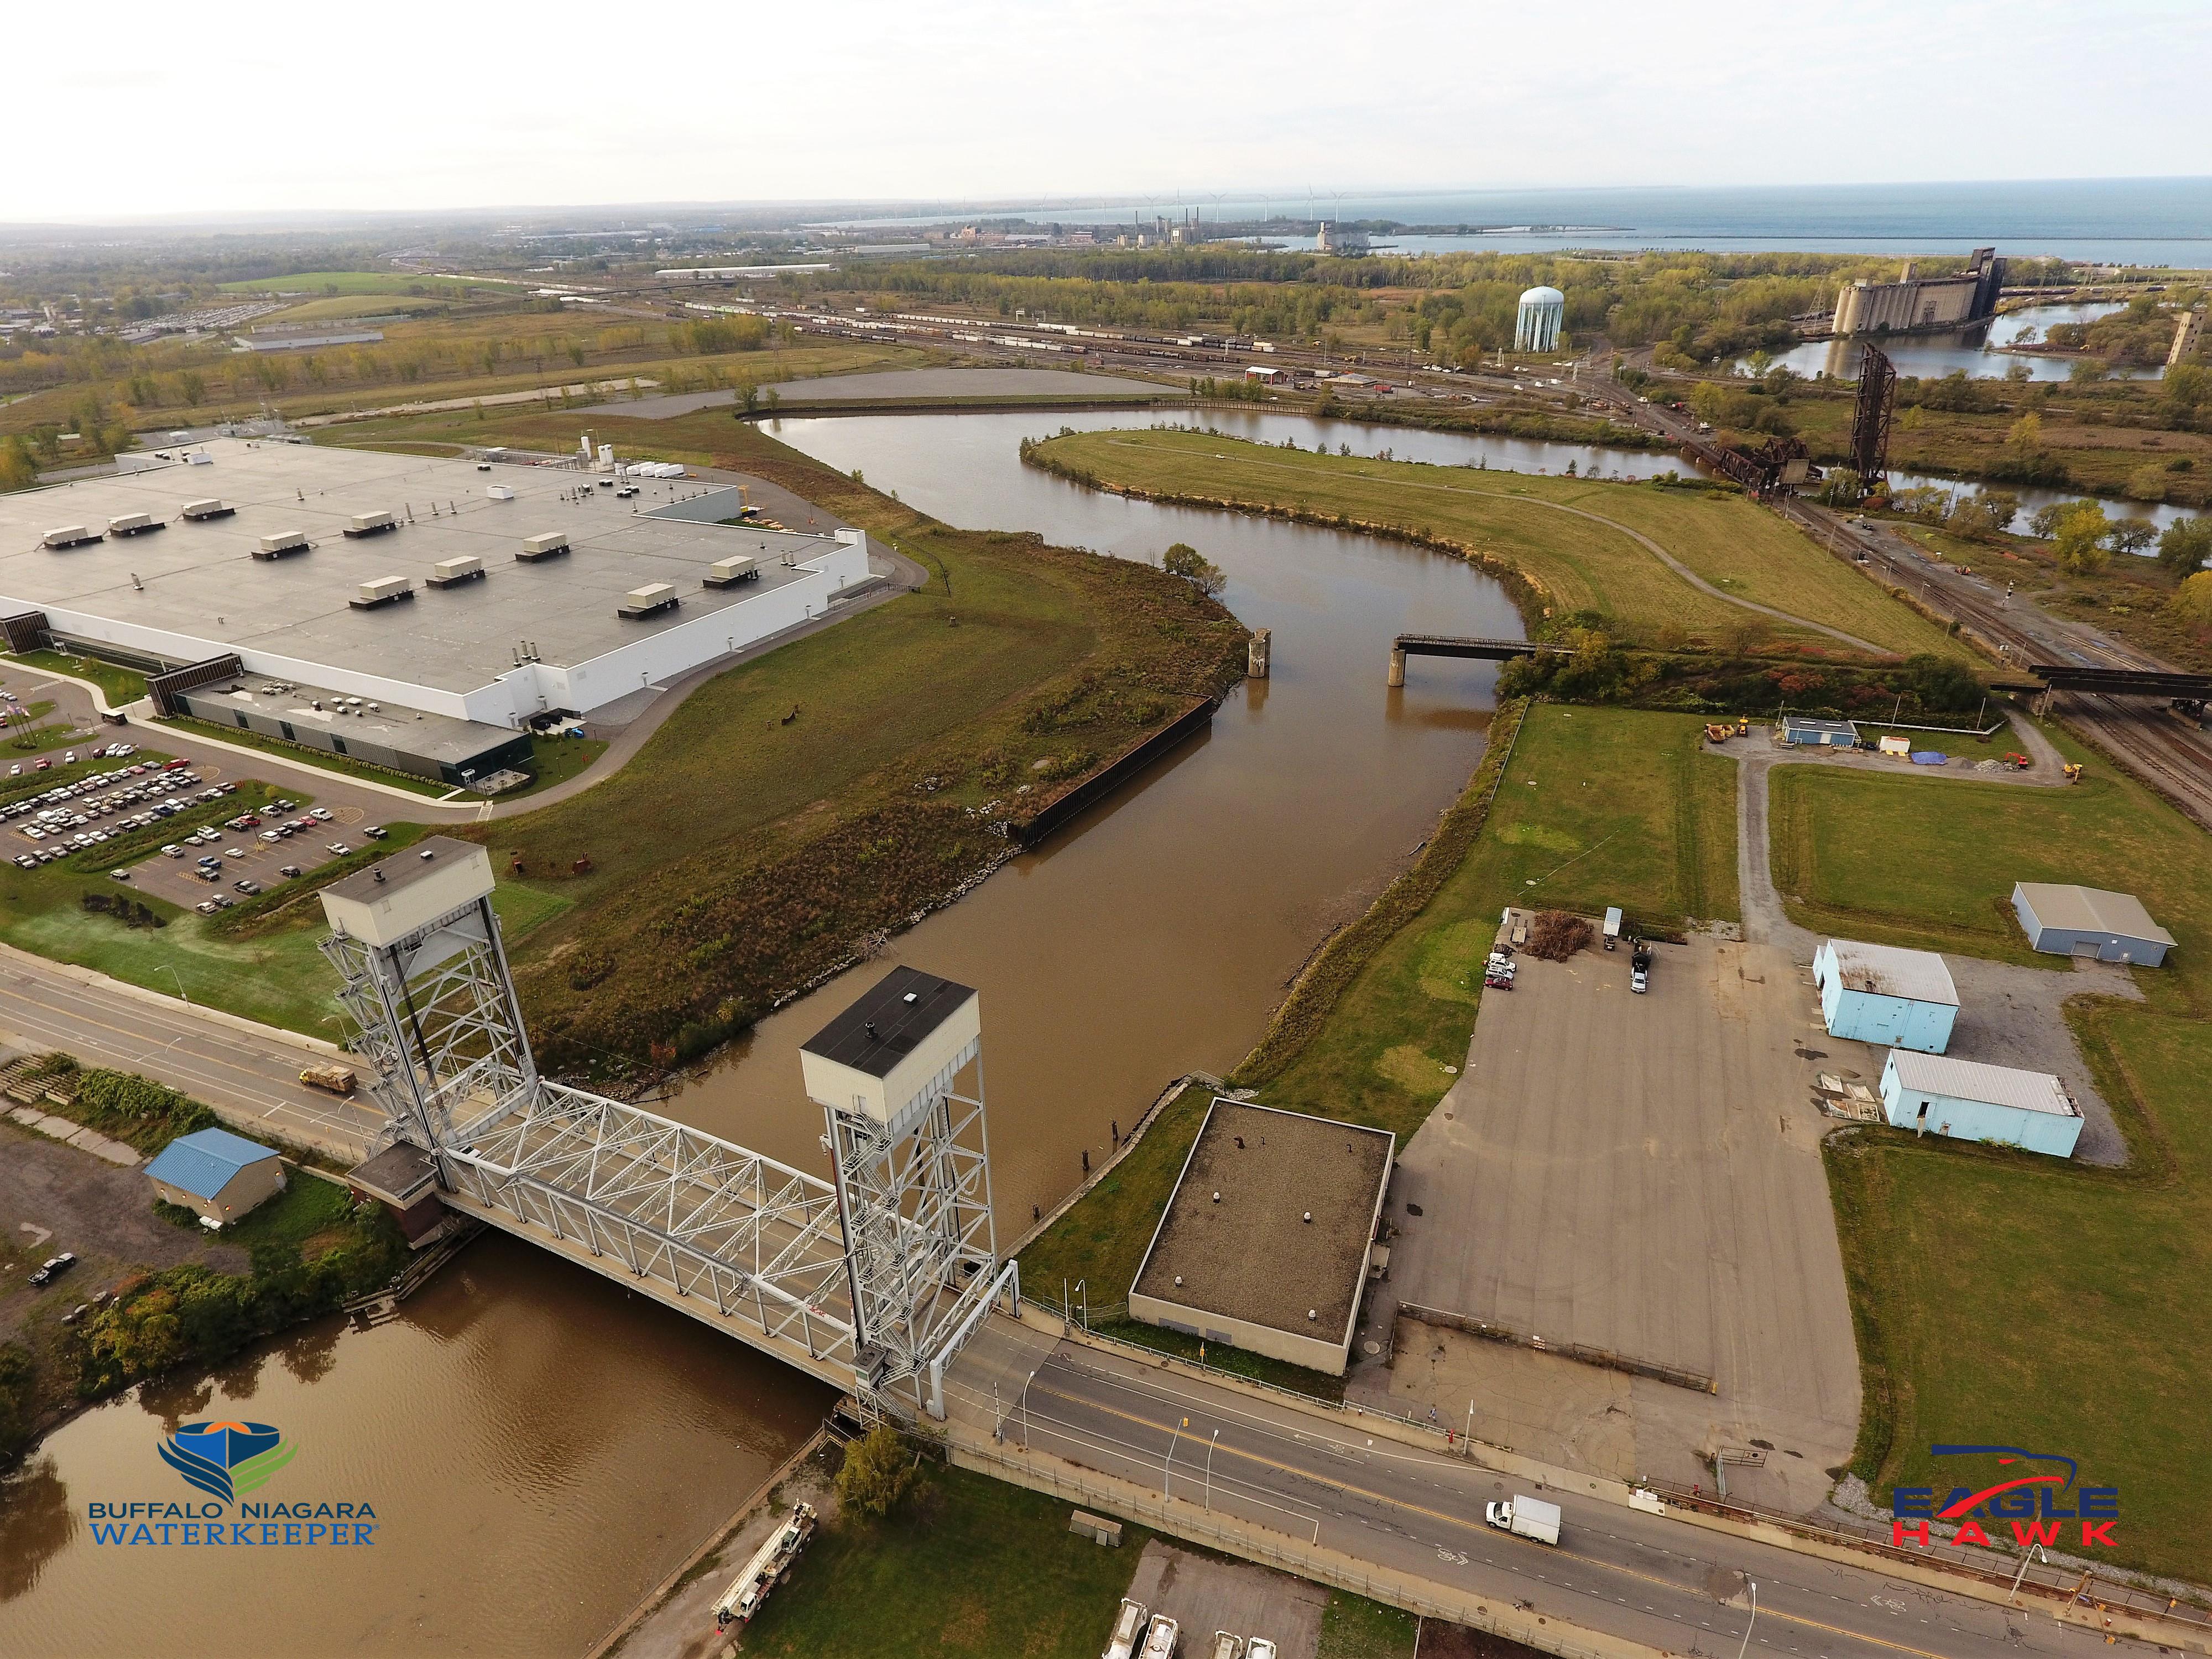
EagleHawk has worked with Buffalo Niagara Waterkeeper on more than a dozen different project sites throughout western New York including the Buffalo River, the Niagara River, Ellicott Creek and at Tifft Nature Preserve. EagleHawk collects aerial imagery and maps project sites to document change and also generates useful geographic data to aid in shoreline enhancements and restoration efforts.

The Buffalo River is one of eight habitat restoration projects in the Buffalo area that EagleHawk  is collecting imagery on.

Contact:

Patrick Walsh CEO – pwalsh@eaglehawkllc.com
Willard Schulmeister COO – wschulmeister@eaglehawkllc.com
Jonathan Byrd CFO – jbyrd@eaglehawkllc.com

EagleHawk One, Inc –  844-4-UAS-DATA  |   716-810-1042  | info@eaglehawkllc.com
FAA Certified Commercial Drone Operations

Social Determinants of Health: How Place Can Affect Health Outcomes

Why does location matter for health?

In 1948, the World Health Organization defined Health as “a state of complete physical, mental and social well-being and not merely the absence of disease or infirmity.” This definition has evolved over time to recognize additional factors that have been found to impact health. Driven in part by improved understanding of socioeconomic influences, technological changes, and increased attention on health policy, there has been a growing effort to more thoroughly elucidate factors that determine health. Genetics, individual behavior, social factors, the physical environment, health services and governmental policies all have been found to play a role in health outcomes. Crafting effective policy depends upon a solid understanding of each of these factors, as well as their complex interactions.

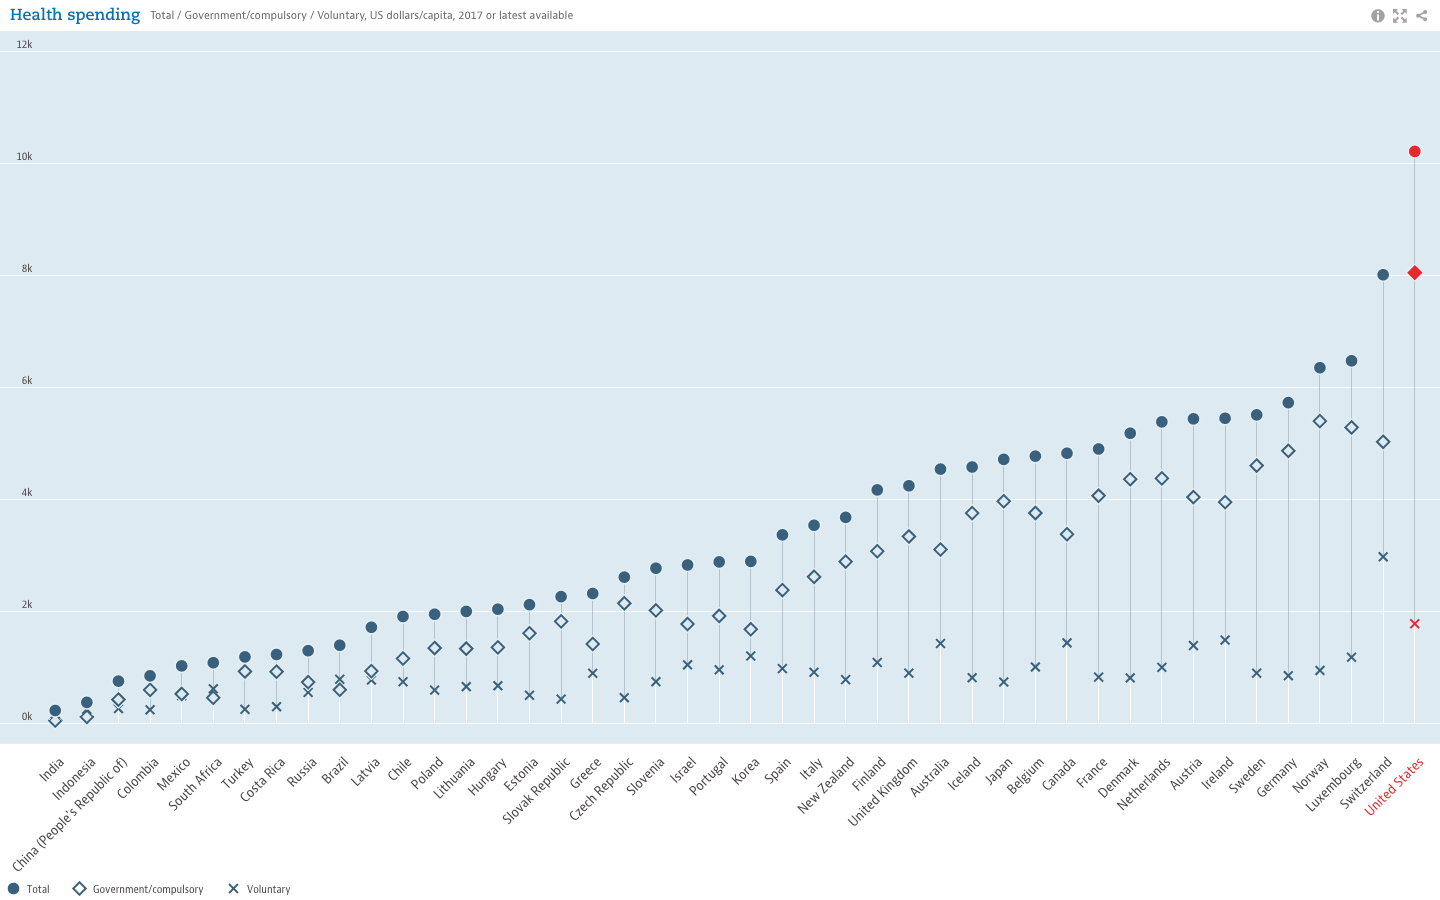
Social determinants of health—as distinct from medical care—are increasingly recognized as influencing a broad range of health matters, from access to outcome. According to America’s Health Rankings, when compared with other developed and many developing nations, the U.S. ranks at or near the bottom for health outcomes related to life expectancy. However, data from the Organisation for Economic Co-operation and Development (OECD), which seeks to understand what drives economic, social and environmental change across governments, show that the U.S. continues to exceed other countries in healthcare spending.

While the United States trails other developed countries in life expectancy (years), it still leads all others in healthcare spending.

Moreover, evidence illustrating the powerful role of social factors in determining health suggests “the effects of medical care may be more limited than commonly thought, particularly in determining who becomes sick or injured in the first place.” Studies have shown that states with a higher ratio of social to health spending had significantly better health outcomes for adult obesity, asthma, mentally unhealthy days, days with activity limitations, and mortality rates for lung cancer, acute myocardial infarction, and type 2 diabetes. Some studies have estimated that medical care is only responsible for 10-15% of preventable mortality in the U.S., indicating that social factors can lead to—or help prevent—poor health outcomes and inequalities.

To address this, the World Health Organization created the Commission on Social Determinants of Health in 2005. By 2008, the Commission concluded in their final report that “inequities are killing people on a grand scale”. Recommendations included improvement of daily living conditions, addressing the inequitable distribution of power, money and resources, measuring and understanding the problem, and assessing impact of action. Growing awareness also led to U.S. Centers for Disease Control (CDC) research, and implementation of a program to advance health equity called Healthy People 2020 which advocates for the creation of “social and physical environments that promote good health for all”, one of their four overreaching goals for the decade.

The Role of GIS

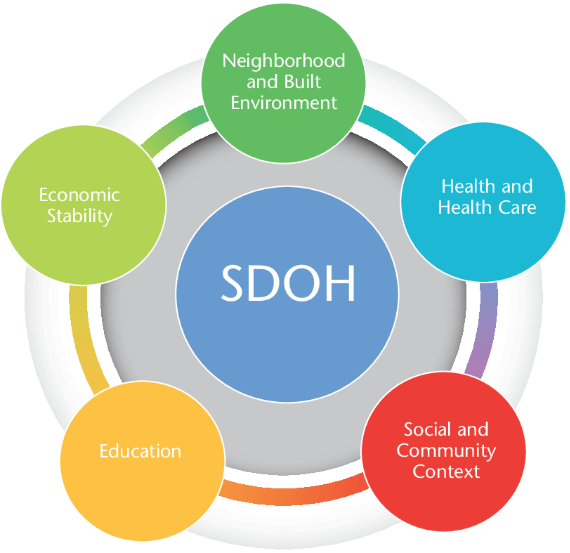
Location affects health. We see dramatic differences in life expectancy between countries, as well as between zip codes. Socioeconomic differences between countries are tied to disparities in health outcomes. Within the U.S., poverty and transportation affects access to healthcare. At a smaller scale, we know that safer neighborhoods, healthy and secure housing, and access to healthy food and open space are associated with healthier populations. U.S. Census data, American Community Survey data, and other sources can help tie such social factors to geography, allowing for better understanding, measurement and tracking of social determinants of health. Universities, governmental and non-profit organizations now routinely collect such data and utilize GIS to help inform analysis and better decision-making, leading to stronger policies. The Healthy People 2020 Approach to Social Determinants of Health employs a “place-based” organizing framework, organized around Economic Stability, Education, Social and Community Context, Health and Healthcare, and the Neighborhood and Built Environment.  Many factors reflecting economic stability, such as poverty and employment, can be mapped within a GIS framework. Mapping education levels, literacy and language, quality of housing, environmental contaminants and areas with high concentrations of chronic disease can help to identify vulnerable populations, reallocate resources and better plan interventions and public education and awareness campaigns. Much of this data is readily available and free of charge. Furthermore, GIS lends itself well to Disparities Analytics, the development of analysis and visualization methods to monitor and report health disparities.
The Westchester Community Foundation and the Westchester Index

For 40 years, the Westchester Community Foundation, a division of the New York Community Trust, has worked to improve local and regional quality of life in Westchester County, NY by addressing community issues, promoting responsible philanthropy, and connecting donors to critical, local needs. In this capacity, the Foundation, together with the Community Healthcare Association of New York State (CHCANYS) and Westchester County GIS recently developed and released the Westchester Index, a tool developed to help understand social determinants of health in Westchester County.  The collaboration relied on data from American Community Survey, the U.S. Census survey, the New York State Department of Health as well as school districts for select health outcomes and socioeconomic indicators. The CDC Social Vulnerability Index (SVI), created by the Geospatial Research, Analysis, and Services Program (GRASP) of the CDC, was also included in the Westchester County Index. The SVI uses 15 U.S. census variables at the census tract level grouped into 4 themes (Socioeconomic Status, Household Composition, Race/Ethnicity/Language, and Housing/Transportation) to help identify communities that may need support in preparing for hazards or recovering from disaster.  Westchester County GIS provided detailed data on public transportation, land use

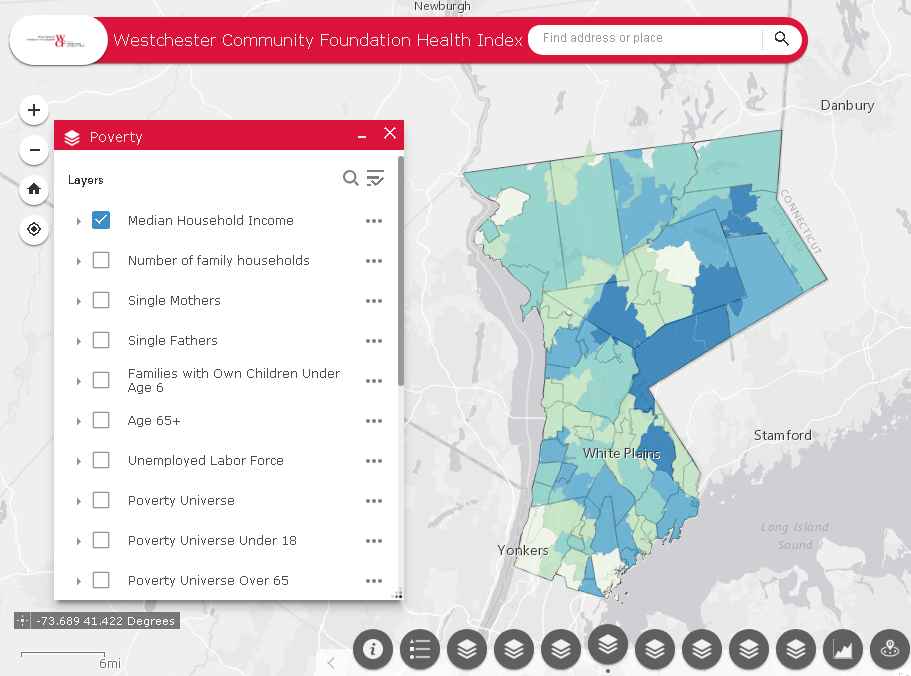
A collaborative effort between Westchester County GIS and the Westchester Community Foundation, the Westchester Index contains data on over 200 indicators reflecting social determinants of health.

categories, as well as locations of environmental hazards. In addition, zip code, census tract and block, school district, municipality, County Legislative district, New York State Senate and Assembly district, and U.S. Congressional district boundaries were provided by Westchester County GIS, allowing for a user to further tailor an analysis. Overall, the Westchester Index contains data on over 200 indicators reflecting social determinants of health. The interactive tool is expected to be used by planning officials, community healthcare networks, school districts, non-profit organizations and others to explore the data and better understand the factors that drive health outcomes in Westchester County, leading to more informed decision-making for greater health equity.  View the Westchester Index Story Map here.

Editor’s Note:  This article was prepared by Anjali Sauthoff.  Ms. Sauthoff is an environmental health scientist currently working with Westchester County GIS to develop integrated approaches that address climate adaptation and community resilience. Her previous research at the Energy Institute at the University of Wisconsin at Madison focused on potential mitigation strategies for reducing transportation-related climate emissions. She received her PhD from Columbia University, where she developed an air pollution exposure model and received training in the health effects of environmental exposures. Her Master’s degree is in Neurobiology from SUNY Stony Brook. She can be reached at ap768@columbia.edu.


10 Questions: Rochelle Harris, President, New York State Assessors Association

Rochelle Harris, IAO, is the current President of the 900-member New York State Assessors Association which represents government assessors and industry representatives across the Empire State.  She currently serves as an assessor in both Madison and Chenango Counties.

eSpatiallyNewYork: You work in both Madison (Hamilton) and Chenango (Sherburne and North Norwich) Counties.  When did you begin to see computer mapping and technology changes in your offices?

 Harris:  I began to notice changes in 2009 – particularly in Chenango County – when a new County Real Property Tax Director was hired.  It was the first time that we were able to overlay aerial photography on top of the digital tax maps.

eSpatiallyNewYork: New York State Assessment Community Enterprise System (ACES) looks like a big deal – aka RPSV5.  How is this program moving along and the discussion within the Association?

Harris:  We are waiting for direction and an updated timetable from ORPTS.  There are also many pilot counties and municipalities which provide updates on progress and any issues. We will be holding training classes when the time comes.

eSpatiallyNewYork:  Do you feel there would be a benefit for more “GIS/computer mapping” training for the statewide assessor community?  Could better engagement with the GIS community improve this in anyway?

Harris: More education can never be a bad thing. Absolutely anything we can do to work together with another agency or organization makes all our lives more efficient. Our current training opportunities can be found on our website which is updated often.

eSpatiallyNewYork: Are you familiar with the New York State GIS Association?

 Harris: I actually am.  Keith Ducette, who is a GIS Technician with Onondaga County, introduced me to the organization and its programs.

eSpatiallyNewYork: Does the Assessors’ Association have anything like a GIS Work Group or GIS Committee?

Harris:  Currently, we do not, but if there is ever an overhaul or a reason to have one, we can create a special committee, or ask for volunteers for temporary projects such as ACES.

eSpatiallyNewYork: Has the Association ever approached the State to support/fund statewide capture of oblique (i.e., Pictometry/Eagleview) imagery?

Harris: No we have not, although it’s a great idea. There is a state senator trying to pass legislation for a cycle bill in which she suggests updating imagery and access to it.  We currently have access to oblique imagery in both Chenango and Madison Counties.

eSpatiallyNewYork:  With regard to data sharing – the conflict of “giving” digital assessment/tax parcel data away vs. “selling it” continues.  A mix across the state.   Does the Association have a position on this?

Harris:  My personal position, I have no problem giving the information for personal use but anyone who wants it for commercial and financial gain should pay for it.  We as an association do not have a position on this.  Chenango County offers a subscription service for the data while Madison County sells tax parcel data in file format.

eSpatiallyNewYork:  Do you anticipate any RPSV5 or any mapping items to be part of the Association’s 2019 Legislative Agenda? Revisions to 9NYCRR Part 189?

Harris:  We are working on our agenda and so far nothing on either issue though revising Part 189 would be a great idea.  The maps are cumbersome and in all three of my offices I am running out of places to store them.  I could mention this to our legislative chair and see if it is something we may be able to add to the agenda or suggest to one of the Senators we work with.

eSpatiallyNewYork: How are assessor’s “automating” in-field assessment work? What are some of the new technology tools?

Harris: I think when we get ACES  there will be much more opportunity to work with the program in the field as it will be mobile friendly and able to incorporate oblique imagery.  There are also digital tools to measure and draw new construction.  I know quite a few Assessor who solely use pictometry and the measuring tool on there.

eSpatiallyNewYork:  I see that you reference Josette Polzella on the President’s Page.  She was an early and vocal advocate of GIS in Westchester County going back to the late 1990s.     Tell me about your relationship with her.

Harris: Josette, was one of my very first mentors.  She was a wonderful person always willing to help and go the extra mile to help. We moved away from the Hudson Valley in 1988 and we lost touch.  We found each other on Facebook in around 2009 or so and picked right up where we left off. She sponsored me to take the IAO exam in 2010 and was there when I was installed – it meant the world to me. The world is a lot less bright without her in it.


NYSAPLS 60th Annual Conference January 28-30 Saratoga Springs

eSpatiallyNewYork had the opportunity to participate in the recent New York State Association of Professional Land Surveyors (NYSAPLS) annual conference in Saratoga Springs in late January.  In doing so, I was able to meet with numerous NYSAPLS members, including briefly with current NYSAPLS President Greg de Bruin, as well as several vendors in the exhibit hall.  Having run almost exclusively in the statewide GIS circle for the past 25+ years, and having really no reference point what to expect at the show – I was not disappointed.

The three-day conference brought together 704 registered attendees with the overall total reaching 775 when including 31 exhibitor representatives.  While I was almost certain to see components of the traditional surveying profession (i.e.,  leveling rods, measuring tapes, tripods, safety equipment/clothing, nails and spikes, monuments,  flagging and marking paints – the customary surveying equipment fare), I was pleasantly surprised to see in both the exhibit hall and throughout individual presentations evidence of the statewide surveying community investing in a variety of developing technologies such as laser scanning, drones, 3D, advanced GPS and photogrammetry, and an abundant number of emerging mobile and field programs.   Quite noticeably, surveying firms offering a broader range of geospatial products and services.   It was clear on the exhibit hall alone how the Empire State surveying community is embracing state-of-the-art geospatial technologies in 2019.

The exhibit hall at this year’s NYSAPLS conference offered an impressive line-up of vendors. The daily Strolling Lunch with Exhibitors engages attendees with the exhibitors.

The conference offered a very diverse range of presentations, classes and workshops.  Of particular interest was to see presentations focusing on Building Information Modeling (BIM), 3D Building Rights and Air Rights, and several focusing on the drone/UAV.  Given the surveying profession’s important role in the development and maintenance of statewide tax maps, there were a number of sessions dedicated to the issues associated with land ownership including easements and right-of-ways, tying into and using historical documentation, tides and tidal datums, highway law, and even canal boundary retracement.  Though I was unable to attend, a class on stone walls focusing on their importance in land records and property boundary definition  was held.  Even a class on “Dendrology for Surveyors” class was included on the agenda. Of course there was a very visible presence of the field of photogrammetry which remains a staple throughout the profession, while new capabilities in the field of underground and subsurface mapping were also on display.  Making reference to the range of content at the conference, Ben Houston, Professional Engineer, Associate Member of NYSAPLS and NYS GIS Association Board Member commented  “This year’s NYSAPLS Conference offered a nice mix of training and social/networking opportunities. I was particularly impressed at the number and variety of professional services and geospatial data vendors in the exhibit hall.”

Of course there was ample time for mixers and social events at this year’s NYSAPLS conference. One of the Special Events at the show was the Field Olympics. Participants were able to compete against others in three events one of which was Tree Identification. Is that Ginkgo Biloba in #4? And here are the winners of this year’s map contest!

An important takeaway for me from the NYSAPLS conference was the focus on the business of surveying.  A geospatial profession largely dominated by private practice, business and industry, and enabling itself to create a presence in Albany.  As part of this presence, NYAPLS has recently created a Political Action Committee (PAC).  PACs are a type of political committee, once properly registered, which can engage in promoting candidates for election to public office that share the views, interests, and concerns of the land surveying community. This new committee is one of several active NYSAPLS groups working on issues such as standards and strategic planning.  Outreach and communication to the professional engineering communities and the State Board for engineering, land surveying, and geology remain priorities as well. (New York State professional surveyor accreditation and licensing is administered through the NYS Education Department Office of the Professions.)  “This year’s conference was outstanding”, notes current NYSAPLS President Greg de Bruin, “the facility, content, conference coordination were all first rate.”

For those involved in mapping technologies within the Empire State, it’s worth the time to visit the NYSAPLS website to see the many areas and programs this professional organization touches across the geospatial community.  There are a multitude of opportunities for collaboration.

Contact:

Amber Carpenter
amber@nysapls.org
518-432-4046

Greg de Bruin
gdebruin@gayrondebruin.com
516-805-4118

Digital Agriculture Continues to Evolve in New York State

Agriculture is important to New York State’s economy, and takes place in almost every region of the State as nearly one-quarter of New York’s total land area is utilized as farmland. There are a plethora of statistics which document the vastness of the agriculture industry across the Empire State:  An annual economic impact of over $42 billion, over 36,000 farms, 1.5 million head of cattle, 40,000 acres of apple trees, $25 million worth of maple syrup and 14.9 billion pounds of milk.  And #1 in the nation in the production of over 700 million pounds of yogurt.  The list goes on.

It’s refreshing to see this important statewide industry begin to intersect with geospatial in a more expanded and robust means.  The movement began to see traction a little over three years ago with the New York Precision Agriculture Workshop held in Geneva, NY in December 2015.    The goal of the workshop was to help assess the use and development of precision agriculture in New York State and was held after a directive from the New York State Legislature instructing the Commissioner of Agriculture and Markets to “issue a report assessing the use and development of precision agriculture in the state with recommendations pertaining to rural broadband accessibility, use and support for the farmer, as well as cost savings and higher crop yield.”   Over 50 individuals from the New York agricultural community were in attendance representing higher education, research, agronomic business, farmers, technology, government and more.

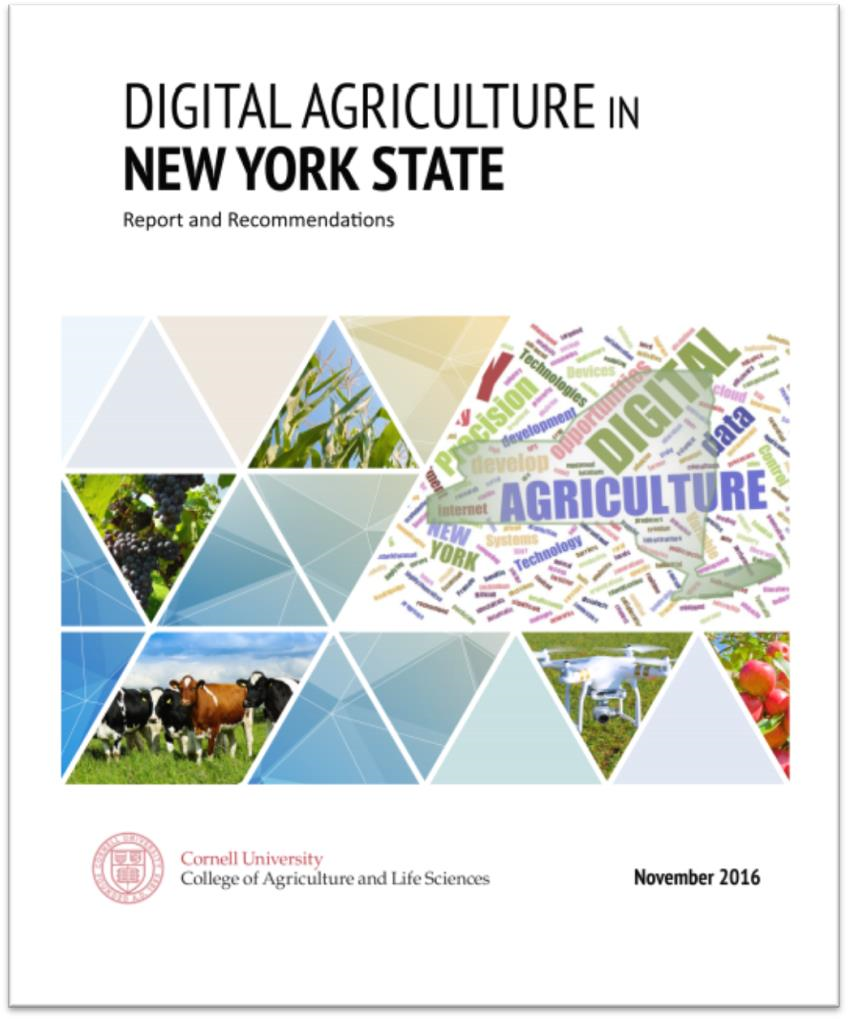
Nearly a year later in November 2016, the 151-page Digital Agriculture in New York State:  Report and Recommendations was published through Cornell University College of Agriculture and Life Sciences.  One of the primary recommendations which was ultimately established was the Cornell Initiative for Digital Agriculture  (CIDA).  Recently, CIDA hosted its inaugural Digital Ag Workshop October 9, 2018 on the Cornell University campus. The event was titled “Transforming Agriculture and Food Systems” and was attended by 200 individuals.  The Workshop included a wide range of presentations and resulted in the establishment of four interdisciplinary Digital Agriculture (DA) Working Groups:  Rapid Phenotyping, Socioeconomic Analysis for Digital Agriculture, Weather, Climate and Agriculture, and The Software-defined Farm.  It will be interesting to see how CIDA evolves in its outreach, research, and building partnerships with government and industry.  Cornell University was rated one of the Top 25 Best Colleges for Precision Agriculture in the United States.   For those interested in following the program, upcoming events and webinars, sign-up for updates and e-News from this CIDA webpage.

Other signs of growth in the statewide Digital Agriculture (also often referred to as “Precision Agriculture”) space augmenting CIDA’s mission includes a recent  ESRI press release announcing Ag-Analytics which is part of their Emerging Partner Startup Program.   Ag-Analytics offers a platform with tools that make utilizing farm data easier than ever. Built around the Software-as-a-Solution (SaaS) framework, Ag-Analytics offers farmers the ability to better manage and visualize their production records to make informed decisions when it comes to understanding risk.  As farm equipment manufacturers become larger and prominent players in the Digital/Precision Agriculture development, it is no surprise that the Ag-Analytics program is integrated with the John Deere Operations Center.  Faculty from the Charles H. Dyson School of Applied Economics and Management at Cornell University are involved with the Ag-Analytics program.  We also saw in 2018, DropCopter, an agricultural technology startup funded through the GeniusNY drone incubator in Syracuse, which managed to pollinate apple orchards in Lafayette, New York using their hexacopter drone. The recent decline of bee populations has raised pollination prices significantly, creating a market for alternative technologies such as Dropcopter.   Evolving in other areas, we would anticipate seeing government program areas such New York State Agriculture and Markets and/or the  New York office of the USDA Natural Resources Conservation Service (NRCS) begin to build some level of digital/precision agriculture capacity as well.

On a related note at the federal level is the passage of the Precision Agriculture Connectivity Act of 2018.  With the focus of the bill  to “identify and measure current gaps in the availability of broadband Internet access service on agricultural land”, the bill assigns responsibility to the USDA and FCC to “develop policy recommendations to promote the rapid, expanded deployment of fixed and mobile broadband Internet access service on unserved agricultural land, with a goal of achieving reliable capabilities on 95% of agricultural land in the United States by 2025”.  Kudos to the National Society of Professional Surveyors (NSPS) working to successfully amend language in the original bill to ensure that members of the task force assembled to make recommendations include “representatives with relevant expertise in broadband network data collection, geospatial analysis, and coverage mapping”.

No doubt, exciting developments for the agriculture industry across the Empire State and great opportunities for the geospatial community to contribute and be part of.

The Geography of Homelessness

Background

The Institute for Children, Poverty, and Homelessness (ICPH) is a New York City-based policy research organization focused on family homelessness in New York City and throughout the United States.

Formerly known as the Institute for Children and Poverty, ICPH was founded in 1990 as federal and state governments looked for ways to address growing rates of family homelessness. Through the examination of empirical, quantifiable data, ICPH seeks to inform and enhance public policy related to homeless families, with an emphasis on the impact on children.  The New York City numbers are staggering with over 12,000 families—including 25,000 children—calling a city shelter their home.  A small city in itself.

And unfortunately, the experience of housing instability and homelessness in New York City’s neighborhoods goes far beyond what shelter numbers alone show. In school year (SY) 2015–16, City schools identified four times as many homeless students as there were children living in shelter, and the current structure of the City’s shelter system is ill-equipped to meet the long-term stability needs of homeless children and families living both in and outside of the City’s family shelters.

ICPH examines the demographics of this growing population, the challenges these families face in becoming self-sufficient, and the programs that are most effective in helping them transition out of homelessness in their reports, research-based books, and policy research commentary.   ICPH’s publications inform government officials, policymakers, other research organizations, advocates, academics, and service providers from across the metropolitan region to promote a robust, evidence-based dialogue.  Central to ICPH’s core work is the intersection of statistical analysis, data visualization, and mapping technologies resulting in a wide range of geospatial-related products and applications.

ICPH Geospatial

ICPH utilizes several mapping, desktop publishing, and statistical software packages in support of publishing online and hardcopy products.  While ICPH actively promotes the use of traditional interactive maps, the increasing use of hybrid products i.e.  maps/charts/tables/graphics (a.k.a. Inforgraphics) are widely used as part of delivering the organization’s message.   Inforgraphics are increasingly being used across the GIS community to provide graphic visual representations of information, data or knowledge intended to present information quickly and clearly.

Managing geospatial applications and development at ICPH is Bronx-native Kristen MacFarlane.  She arrived at ICPH in December 2016 after a stop at the New York Botanical Gardens.   She received her undergraduate degree in Natural Resources from Cornell University and her masters in Geographic Information Science (GISc) from CUNY Lehman College in the Bronx.  Kristen oversees an organizational geospatial tool box which includes a several software packages including Tableau and ESRI.  While most ICPH projects are NYC focused, the reach of the organization’s research and work covers other areas of the country as well.  Projects are funded by foundations, grants, and other contributions and initiated by ICPH professional staff and industry colleagues.  MacFarlane notes that data used in the studies is mostly gathered from open data portals or through Freedom of Information Law (FOIL) requests.  As a primer on her involvement with ICPH, see her November 17, 2017 GIS Day blog post GIS Day: Discovering Family Homelessness Through GIS.

ICPH Geospatial and Data Visualization Applications

Suspension Hubs Interactive Map

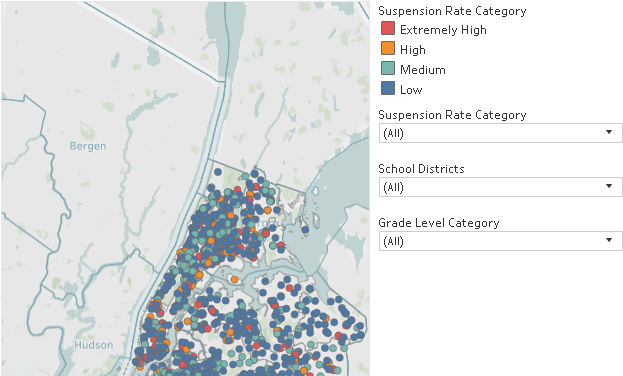
In New York City, there are 102 Suspension Hub schools serving nearly 3,500 homeless middle schoolers. These schools suspended more than 6.6% of their students overall in SY 2015–16—nearly three times the city’s rate of 2.5%—and their rate of suspension among homeless middle school students actually increased during the years since SY 2010–11. Understanding where Suspension Hubs are located represents an opportunity to offer these schools more support and resources so that they, too, can turn the tide like the 83% of other schools with declining suspension rates. The Suspension Hubs Interactive Map was developed in Tableau using data generated and analyzed with Stata.  Project data is from NYC Department of Education for SY 2015-2016.

In New York City, there are 102 suspension hub middle schools where students are disciplined at extremely high rates.

Interactive Map and Atlas of Student Homelessness

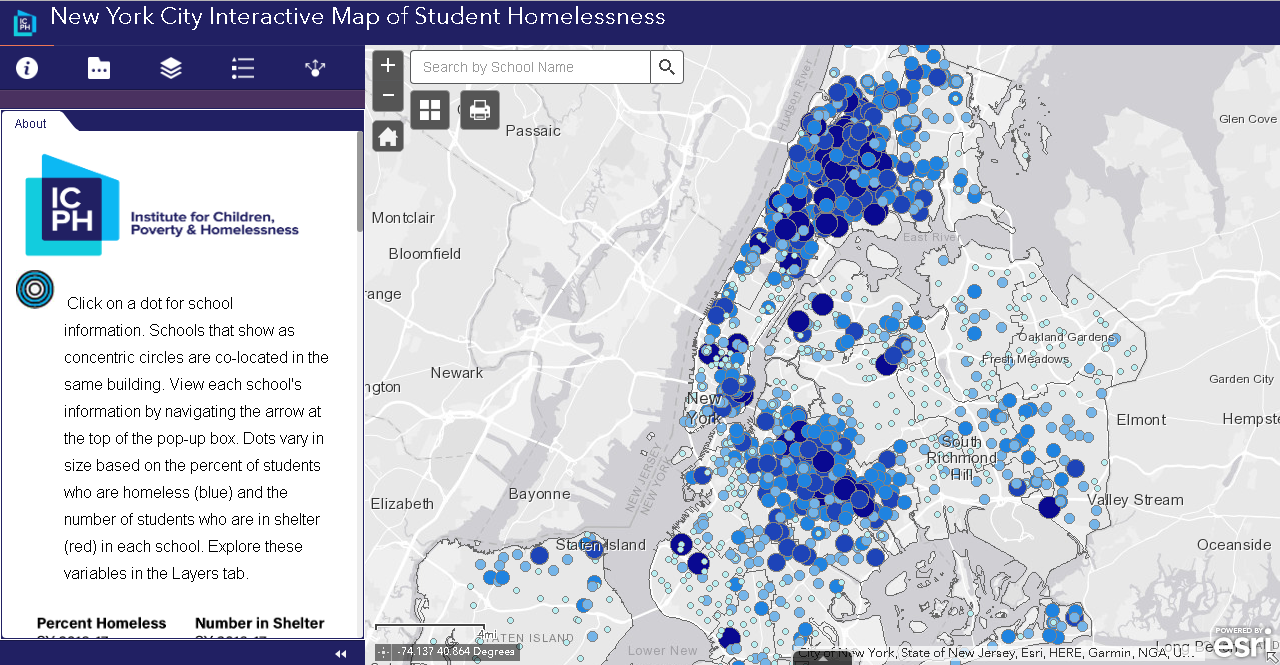
Unless current trends change, one in seven New York City public school students will be homeless during elementary school. More than 140,000 children attending New York City public schools have experienced homelessness within the past six years.  Visualizing the magnitude of this issue is the updated ICPH application New York City Interactive Map of Student Homelessness as well as On the Map:  The Atlas of Student Homelessness in New York City 2018.  Both products provide a wide range of  data to allow people from different fields to tailor and engage with data on student homelessness in a way that is meaningful to them and the unique needs of their organizations and locales in the city. The Atlas documentation is from Section 1 only of the report which is available for download from this link.  The August 2018 update is more similar to ones that ICPH presents as static publications.  The full report contains maps generated with the ArcGIS client which are exported for inclusion in online and hardcopy publications.  On a larger scale, ICPH created a similar interactive nationwide map – The United States of Homelessness – scale using data from the U.S. Department of Education.

This interactive map provides users with the ability to see what student homelessness looks like in every NYC neighborhood.

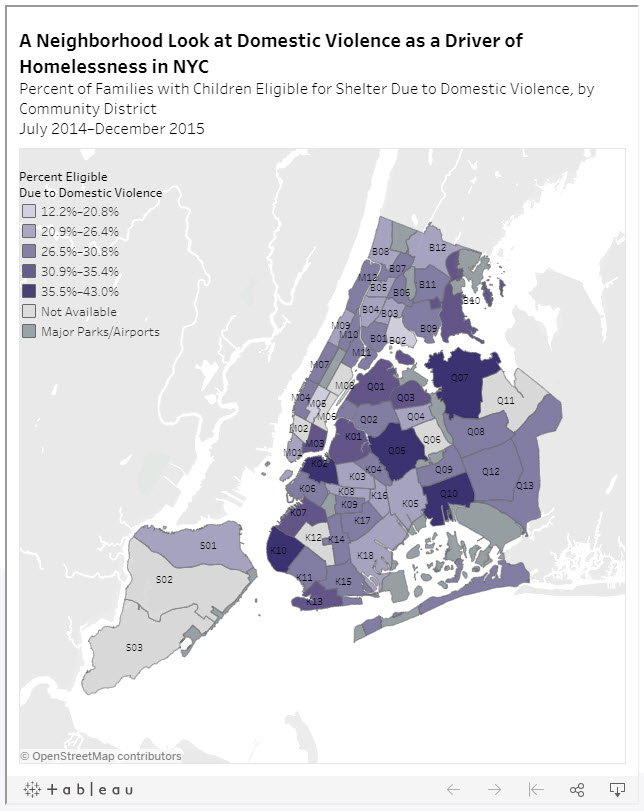
Neighborhood Look at Domestic Violence as a Driver of Homelessness in NYC

Family homelessness has many different causes and drivers. One of the more common drivers in NYC are families being pushed into homelessness because of experience with domestic violence. This map demonstrates the rates at which domestic violence is driving family homelessness in neighborhoods across NYC.

Percent of families with children eligible for shelter due to domestic violence by Community District July 2014 – December 2015. Data source: NYC Department of Homeless Services.

Food Insecurity & NYC’s Homeless Children

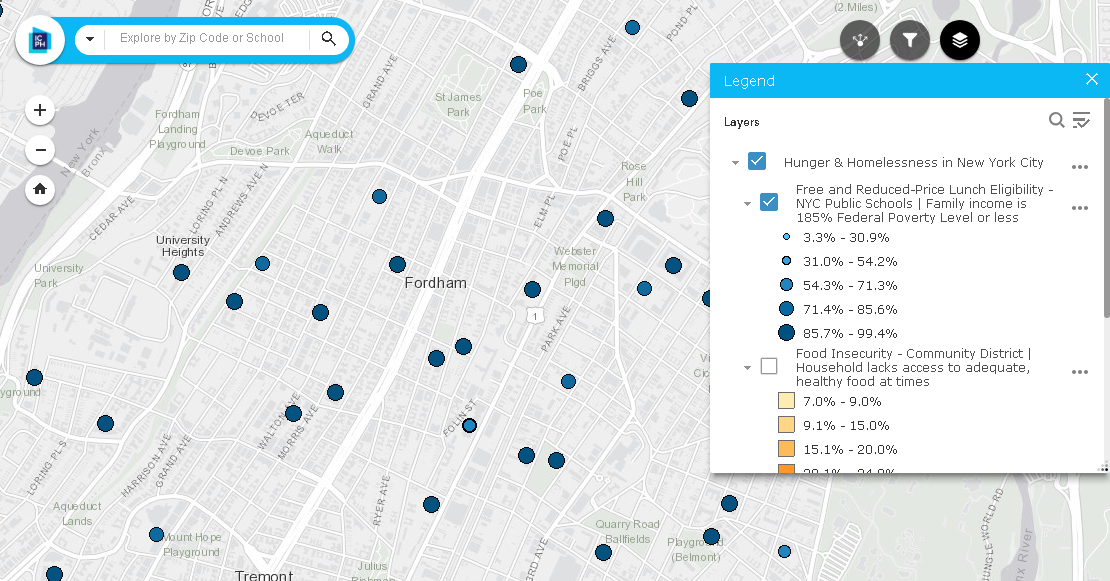
A household is considered food insecure if there is a lack of access to adequate, healthy food for all household members.    In NYC, students are eligible for free or reduced-price lunches  if their family income is 185% of the Federal Poverty Level or less. Other programs such as the federal Supplemental Nutrition Assistance Program (SNAP) provides food stamps or SNAP benefits to households with incomes 130% of the Federal Poverty Level or less, in addition to employment requirements.  This ICPH interactive map enables users to access localized data on school lunch programs, food insecurity by community district and SNAP benefits.  An excellent User Manual is provided as well.

Data sources for this interactive map include NYC Dept. of Education, Food Bank for NYC, Feeding American, Data2Go.nyc, and U.S. Census Bureau, 2012-2016 American Community Survey estimates.

Summary

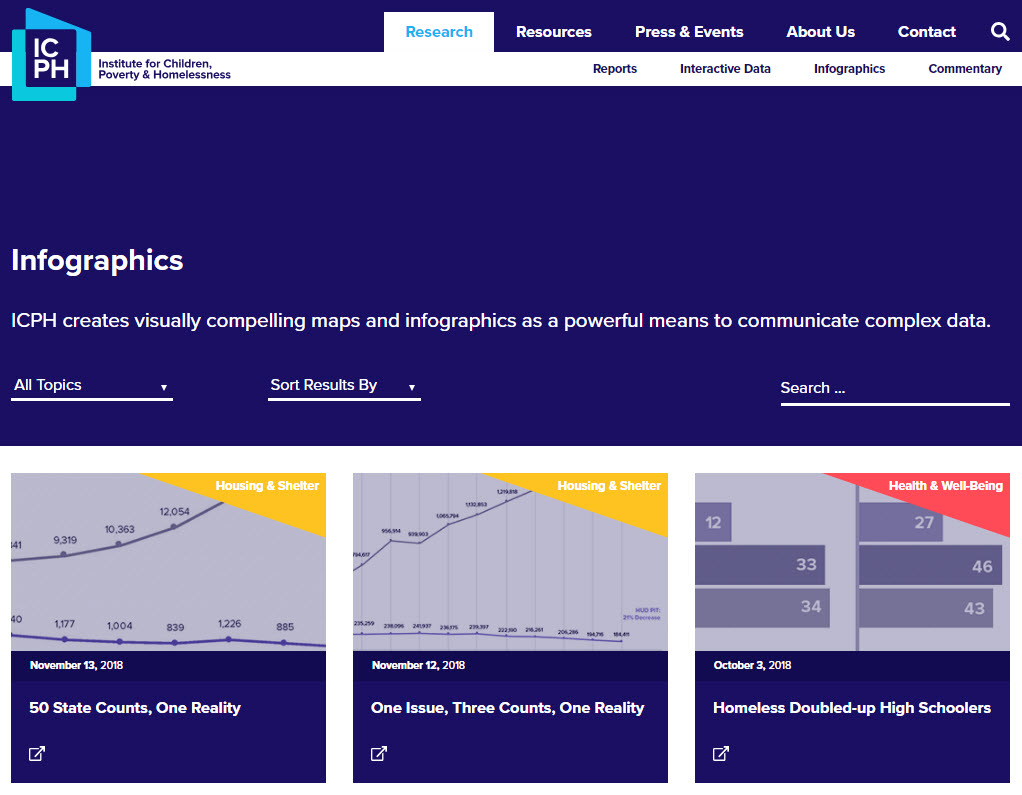
While the core focus of ICPH’s research and advocacy continues to be in the New York City region, its work covers the entire United States.  Detailed homelessness related studies have been done in specific metropolitan areas.  Similar the nationwide scope of the United States of Homelessness study referenced above, ICPH released the Student Homelessness and Food Deserts interactive map during Hunger and Homelessness Awareness Week, November 12-16, 2018. Other student-focused homelessness studies have been conducted in California, Georgia, Seattle, and New Jersey.  A wide range of publications and reports compiled by ICPH staff and collaborating organizations focusing on homelessness-related topics such as education, health and well being, housing, and community issues can be accessed  by clicking on the image below and then using the Research tab to browse Reports and Interactive Data.

“Geospatial tools are essential for our organization as we work to give the public a clearer, more informed picture of what child and family homelessness looks like in their community and across the country,” said Kristen MacFarlane, Senior GIS Analyst at ICPH. “Homelessness is a national crisis but a local issue and the specific ways that homelessness varies between localities and even neighborhoods are important to understand in order to develop policy solutions for those experiencing it. GIS software helps ICPH convey the complexities and the scope of this growing crisis.”

Contact:

Kristen MacFarlane
Senior GIS Analyst
Institute for Children, Poverty, and Homelessness
36 Cooper Square, 2nd Floor
New York, New York  10003
KMacFarlane@icphusa.org

URBAN-X: Supporting New York Geospatial Startups

Curious to know about technology accelerators in New York State which are supporting  geospatial startups?  Look no further than Brooklyn-based URBAN-X built by MINI and Urban Us and operating since 2016 offering customer development, product development, and fundraising support to get selected startups off the ground into production and operation.   Geospatial is not the only type of startup  URBAN–X supports  (its actually much more)  with an existing resume of 37 firms in its portfolio covering technology solutions in the areas of real estate, transportation, energy, infrastructure, public health, and government among others.  The URBAN-X startup focuses on the urban tech environment developing hardware and software solutions which address key needs of city systems, as well as businesses and individuals.   The accelerator’s current cohort consists of seven  startups which each received $100,000 and five months of immersive mentorship.  This cohort was selected from over 500  applications this past November.

Every six months Urban-X selects up to 10 startups and invest $100,000 per company. The 20-week accelerator program also includes six on-site “experts-in-residence”.

Illustrative of the geospatial startups which have come through the accelerator is Citiesense.

Citiesense creates data-driven maps and dashboards that layers information about new permits, recent sales and property changes in urban areas, guiding real estate investors and other local stakeholders to support more informed business decisions.  Using interactive mapping and data visualization techniques, the company continues to focus on helping business districts better understand market demand and dynamics.   Citiesense uses Carto software to support their mapping applications and leverages data available in the NYC Open Data Portal.  Examples of their mapping apps are at the Downtown Brooklyn website and the Long Island City Partnership.  Citiesense is also referenced in a 816 New York article “3 map-based tech tools perfect for neighborhoods and housing authorities”.

I quickly developed an account on the Citiesense website and immediately started mapping various features around 347 East 105th Street. Out-of-the-box the application provides access to dozens of variables and features. This image shows recent 311 Reports, the NYC Street Tree Inventory, and the Commercial Overlay Districts layer.

Starting a tech company is never easy” notes Citiesense CEO Starling Childs. “I think this is particularly true of ‘Urban Tech’ startups. Joining URBAN-X was like adding the perfect final cofounder to our team right when we needed to begin testing our idea in the market. The people behind URBAN-X know the challenges urban tech companies face when thinking about solutions that consider some level of government and private sector collaboration. They understand the value of things like open data; how it supports public private sector collaboration and accelerates innovation in cities.”

Other URBAN-X supported startups in the location and navigation space include Revmax, Rentlogic, WearWorks and Swiftera.

Revmax:  Revmax develops fleet management and routing software for ride-hail vehicles. Its technology maximizes vehicle utilization by proactively forecasting rider demand based on historical data and future events. Revmax ensures that vehicles are in the optimal location to find rides quickly — increasing fleet revenue while reducing pollution and congestion.  According to  CEO Jonathan Weekley and chief operating officer Briggs Fraser,  cabs and Uber cars are empty some 50 percent of the time — highly inefficient for drivers trying to make the most of their time on the road. But the real target market for Revmax, Weekley says, is auto manufacturers such as GM and Ford, who are looking to get into ride-hailing. “They see declining car ownership, and they need to figure out a way to keep building cars and use that fleet more efficiently,” he said. Those manufacturers will have extra incentive to optimize routes, since they, not the drivers, will own the cars that are out on the road.

Rentlogic:  Rentlogic is a standards organization that measures and letter-grade rates the quality of multi-family residential buildings. Rentlogic ratings recognize building owners that invest time and energy in to operating great buildings, and helps connect them with residents trying to navigate a difficult marketplace.  Data underneath the application is harvested from the city’s 311 system.    Every week, roughly 4,000 complaints are initiated by renters about their landlords via calls to the #311 system. These complaints can include mold, heat and hot water issues, infestations, structural problems and more – all of which are used in the application.  It is Rentlogic’s aim to bring transparency and standardization to the residential real estate market.

WearWorks:  WearWorks is a New York-based haptics design company using sensory feedback systems to communicate information entirely via touch. Using vibration-based language, their product augments the senses of blind and visually impaired users through a non-visual interface, helping them to easily and effectively navigate to any destination.  Btw – WearWorks technology was worn/used by Simon Wheatcroft, a blind runner, in the 2017 New York City Marathon.

Swiftera: Swiftera’s business plan is to support citizens, businesses and municipalities in mobility, leisure and urban planning decisions. By providing access to fresh and actionable geospatial data at a competitive cost, the company leverages its novel urban-imagery technology to help customers analyze the past, explore the present and be the first to see the future.  While still in development, Swiftera anticipates delivering unprecedented urban imagery: available all-the-time, in real time.  For more information visit their website or contact them at info@swiftera.co. 

Summary:

URBAN-X provides an excellent opportunity for startups – including those in the geospatial space – to get started in a way which would otherwise be financially and logistically very difficult.    URBAN-X is itemized in a 2017 Dreamit article as one of the leading voices in the New York City “nascent urban tech movement”.  In the broader statewide context, the Empire State Development corporation supports several regional certified business incubators.  The New York State geospatial community is fortunate to have both the access and ability to work with companies such as URBAN-X.

Contact:

Micah Kotch
Managing Director
URBAN-X
Micah.Kotch@urban-x.com
Mobile: +1.646.645.0459
www.urban-x.com

Wayfinding: Geospatial Goes Indoors with Connexient

As GIS and mapping technologies evolved through the later part of the 20th century focusing mainly on the physical(outdoor)  landscape, the digital mapping of the  built/interior environment continued to focus on the use of AutoCAD/Revit and related CAD technologies.  With exceptions, there were two definitive geographic mapping camps:  Geographic Information Systems (GIS) software vs. Computer Aided Design (CAD) software.   One or the other.  And with little integration of both.

As both technologies matured, integration between the two computing environments became more common and the lines of division blurred.  New technologies including, but not limited to Global Positioning Systems (GPS), Laser Scanning, Building Information Modeling (BIM), and drones, as well as advancements in 3D modeling and increased desktop and internet capacity aided to the continued integration of the software platforms. GIS and BIM Integration Will Transform Infrastructure Design and Construction is a very recent and quick read from Autodesk charting the path of this flourishing market.

Fast forward to 2018 and the evolution of indoor wayfinding which leverages many of the components of these same outdoor and indoor mapping concepts.   Based on a similar spatial data model, Wayfinding applications are now found in a wide range of public spaces, educational and industrial campuses, entertainment and athletic venues, buildings, and healthcare facilities.  Offering indoor maps for handheld mobile devices is becoming more and more common, as are digital information kiosk systems in office complex lobbies, and as part of web mapping applications. (It is often recognized that The Americans with Disabilities Act of 1990 (ADA) represented a milestone and was instrumental in helping to make spaces universally accessible and improving wayfinding for all individuals.)

Connexient

New York City-based Connexient was formed in June 2012 with the vision that indoor GPS and navigation will become as widespread inside as it is outside.

With over 60 licensed hospital client sites and a total square footage over 70 million square feet mapped, Connexient is a market leader in healthcare in providing  smart phone based turn-by-turn indoor navigation and all screens digital wayfinding solutions.   Leveraging significant breakthroughs in the ability to implement low cost, navigation quality indoor positioning, users can now expect the same kind of functionality –  intuitive, reliable and accurate maps, directions and turn-by-turn navigation which is commonly available from outdoor world mapping and navigational companies such as Google, Apple and Waze.    The same user experience can be available via a mobile app for any large, complex indoor facility or campus that they enter.  Today, these capabilities are highlighted in Connexient’s flagship product MediNavTM.

Selected MediNav functions include:

  • Multiple levels of zoom and detail
  • 5D visualization and 360 degrees of freedom of camera control
  • Detailed routing network and intelligent routing
  • Turn-by-turn instructions
  • Visual landmarks (signage) to provide locational reference
  • Visual and audio turn prompts
  • Off-route notification & route recalculation
  • “Balcony view” route visualization – what is coming next
  • 1 to 2 meter accuracy
  • Dynamic refresh of user position
  • Parking Planner, Find my Car and Meet Me
    Continue reading

Shared Services: Opportunities for Local Government GIS

More than a couple years ago, Linda Rockwood, who at the time was running Mohawk Valley GIS, mentioned to the NYS GIS community that she was at a local meet and greet with regional elected officials and mentioned the “GIS” word to one of NYS’s congressional representatives in attendance.  To her amazement – and dismay –  she found out the representative had a very limited awareness or understanding of GIS.

Linda’s encounter certainly wasn’t the first of its kind and I’m sure there have been numerous similar incidents in our respective corners of the state since then.  GISers gingerly starting a conversation on the broad benefits and applications of geospatial technology to government and elected officials – only to see the focus wander quickly. Maybe two or three minutes into the discussion when comparisons to Google Maps normally kick-in and/or there is eye contact with the next constituent and thinking moves to that conversation.

Unfortunately, the message – and the collective mission – seems to continue to get lost and there is recent anecdotal evidence to suggest there is still a long way to go in context of recognizing and embracing geospatial technology in NYS local governments (county, city, town, and village) as part of an increasingly important government program area:  Shared Services.

New York State Shared Services Program

Those working throughout the local government ranks should be on some level familiar with the shared services buzzword.  It’s the talk among government officials and for legitimately good reasons.  Look no further than Governor Cuomo’s commitment of $225 million in the FY 2019 Executive Budget to continue the County-Wide Shared Services Initiatives (CWSSI). The $225 serves as matching funds for a one-time match for actual and demonstrable first-year savings achieved by the Shared Services Panels through new actions implemented during calendar year 2018.  School districts, boards of cooperative services (BOCES), fire districts, fire protection districts, and special improvement districts have the option to participate as well.    The current shared services initiative augments the existing NYS Department of State Local Government Efficiency (LGe) Program – which by the way formerly known as the Shared Municipal Services Incentives program –  “provides technical assistance and competitive grants to local governments for the development of projects that will achieve savings and improve municipal efficiency through shared services, cooperative agreements, mergers, consolidations and dissolutions.”

New York State Shared Services Initiative web page

There are many recognized barriers to implementing shared services across NYS governments though as the concept evolves, governments continue to try and find ways to consolidate services in specific areas such as municipal justices, zoning and code enforcement, construction/building/maintenance inspections, and in the establishment of health care consortiums to name only a few.   That said, it’s worthy to note the limited number of GIS-centric shared services proposals submitted by both the New York State Association of Counties (NYSAC) and  New York Council of Mayors (NYCOM). Specifically:
Continue reading