Mapping a New Economy for Equality and Sustainability

New York City nonprofit uses GIS to help support cooperative and community-led development projects as well as advocacy campaigns

Introduction

Nonprofits are one of my favorite areas to cover in the geospatial space.  More than not their geospatial efforts operating on a shoestring budget, relying mostly on filtering through open data portals and mashing everything together to create visual products with open source software or via discounted vendor supported nonprofit software licensing agreements. Its not uncommon to find the person(s) doing spatial analysis and map making having been self-taught.  A lot gets done with a little.

One such organization is the New Economy Project (NEP) located in New York City.  NEP works with community groups to build a new economy that works for all, based on principles of cooperation, democracy, equity, racial justice, and ecological sustainability.  Their focused campaigns are carried out in concert with community, labor, civil rights and social justice groups on initiatives such as:

  • Public Bank NYC, a municipal public bank campaign rooted in economic and racial justice. Through public banking, NYC can divest from Wall Street banks, reinvest public deposits to support equitable and cooperative development.  
  • Advancing Community Land Trusts, through co-leadership of the NYC Community Land Initiative (NYCCLI) and one-on-one work with community groups seeking to organize community land trusts. 
  • Advancing NYS Community Equity Agenda, calling for transformation of the fundamentally unjust social, political and economic systems. The Equity Agenda puts racial and economic justice front and center and addresses long-standing inequities that play out at neighborhood and regional levels. 
  • Growing NYC’s Cooperative Economy through coalition-building and policy change that supports and brings together community land trusts; worker, housing, financial and food co-ops; and other models of cooperative, community-led development.

GIS and Mapping

Behind all of the mapping at the New Economy Project is Ben Hagen who currently serves as Senior Research and Communications Associate.  “As much of our work focuses financial services, a considerable amount of our data comes from the Federal Deposit Insurance Corporation (FDIC)” Ben notes, “and more specifically from the Summary of Deposits section.”   Ben does all of his mapping and data analysis with ArcMap having learned the craft as part of his graduate work in Urban Planning at New York University.  Other data sources frequently used by NEP include the U.S.Census Bureau, New York State Department of Financial ServicesNew York State Office of Court Administration, and NYC OpenData. 

NEP uses use ESRI’s World Geocoding Service to support most of its address mapping though in the past had also used the city’s LION file. In addition to ArcGIS, the main other data-related software NEP uses is open source software R for cleaning data, especially when preparinfor for mapping. Hagen likes R software because it runs on text-based code and is great for replicating processes with minimal opportunities for introducing errors, as well as for easily sharing with others for a second look at methodology.  

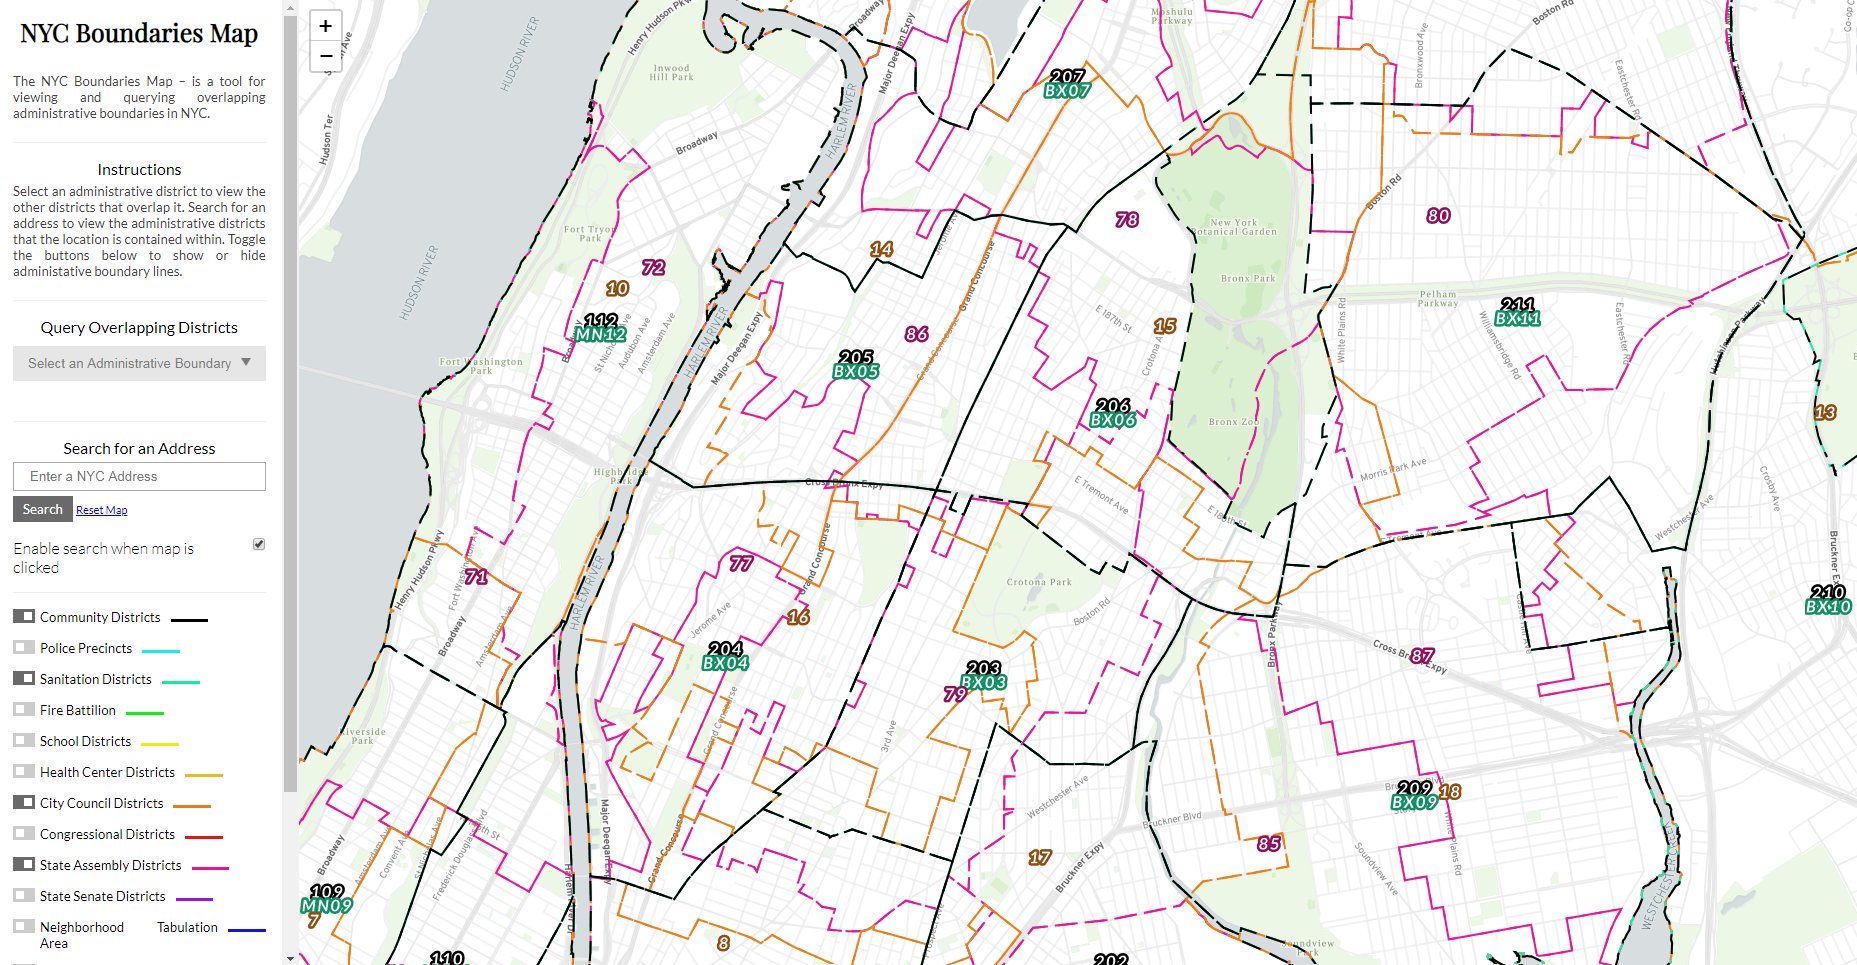
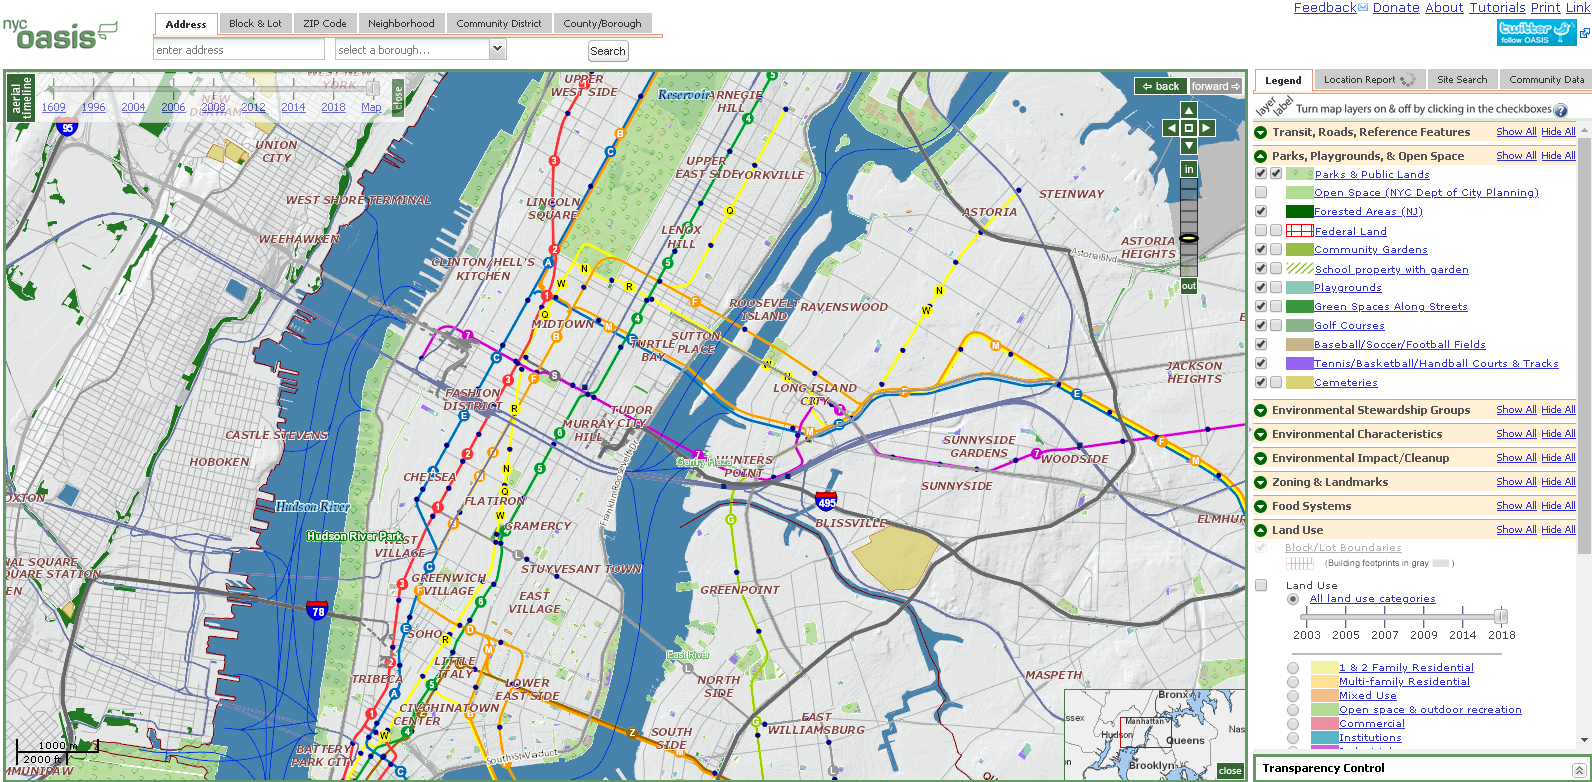
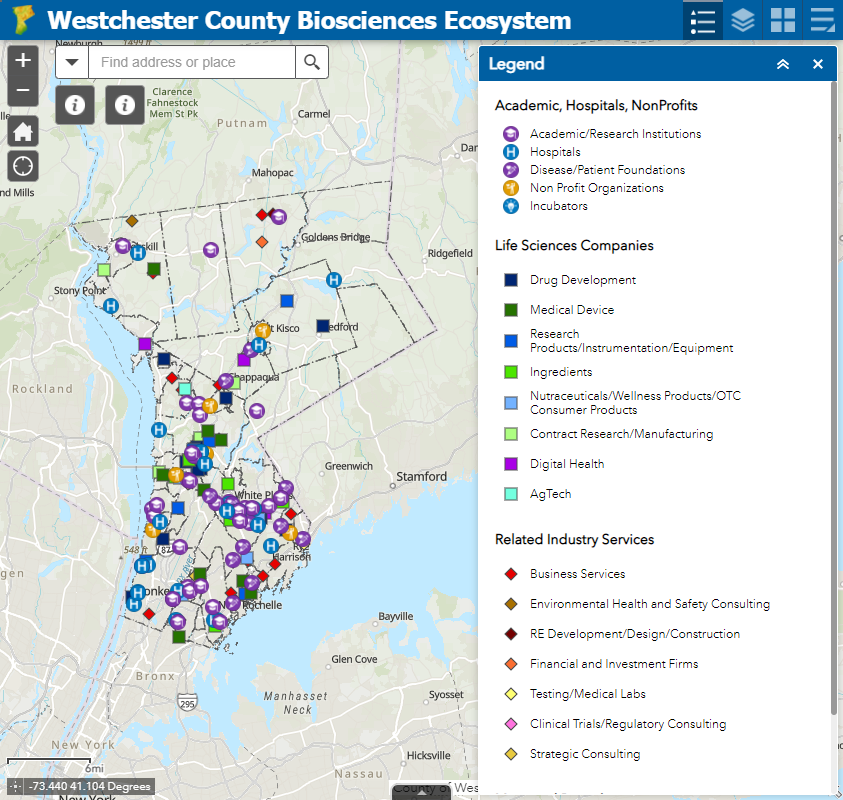
Samples of NEP mapping products include (click image for map download).

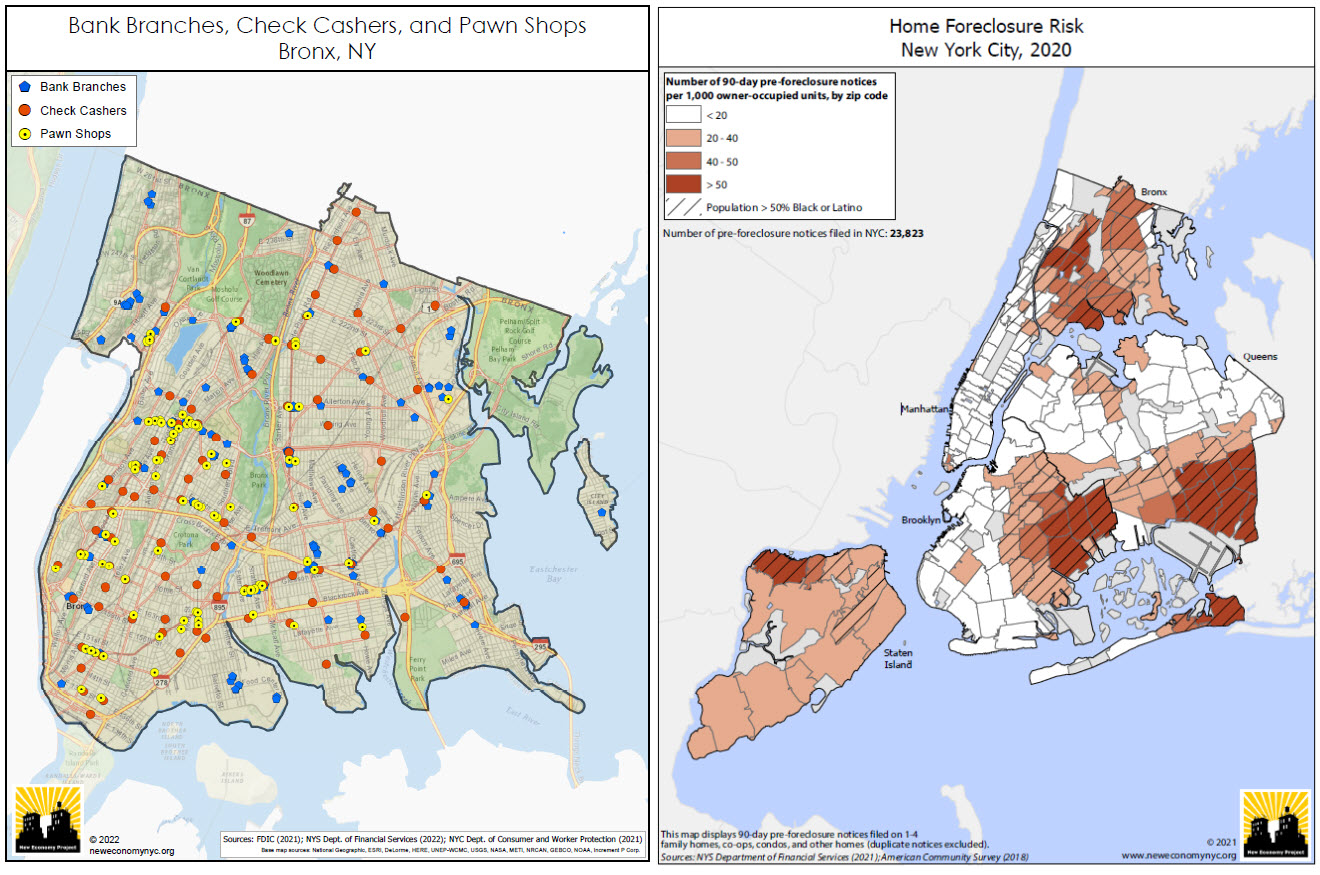
(Left Image): Bank branches are not distributed and made accessible evenly across the city.  This map depict the relative absence of bank branches in  the Bronx, and the resulting concentration of high-cost alternatives such as check cashers and pawn shops. This is a series of maps that NEP updates every year covering most (if not all) of the city’s neighborhoods.  (Right Image): NEP creates maps showing the concentration of residential foreclosure risk in NYC communities of color. This uses data from the NYS Dept. of Financial Services, based on notices that mortgage servicers are required to send to delinquent borrowers 90 days before initiating a foreclosure action. While not all of these notices result in an eventual foreclosure, it provides a good indication of where the risk of home foreclosure is highest in the city.

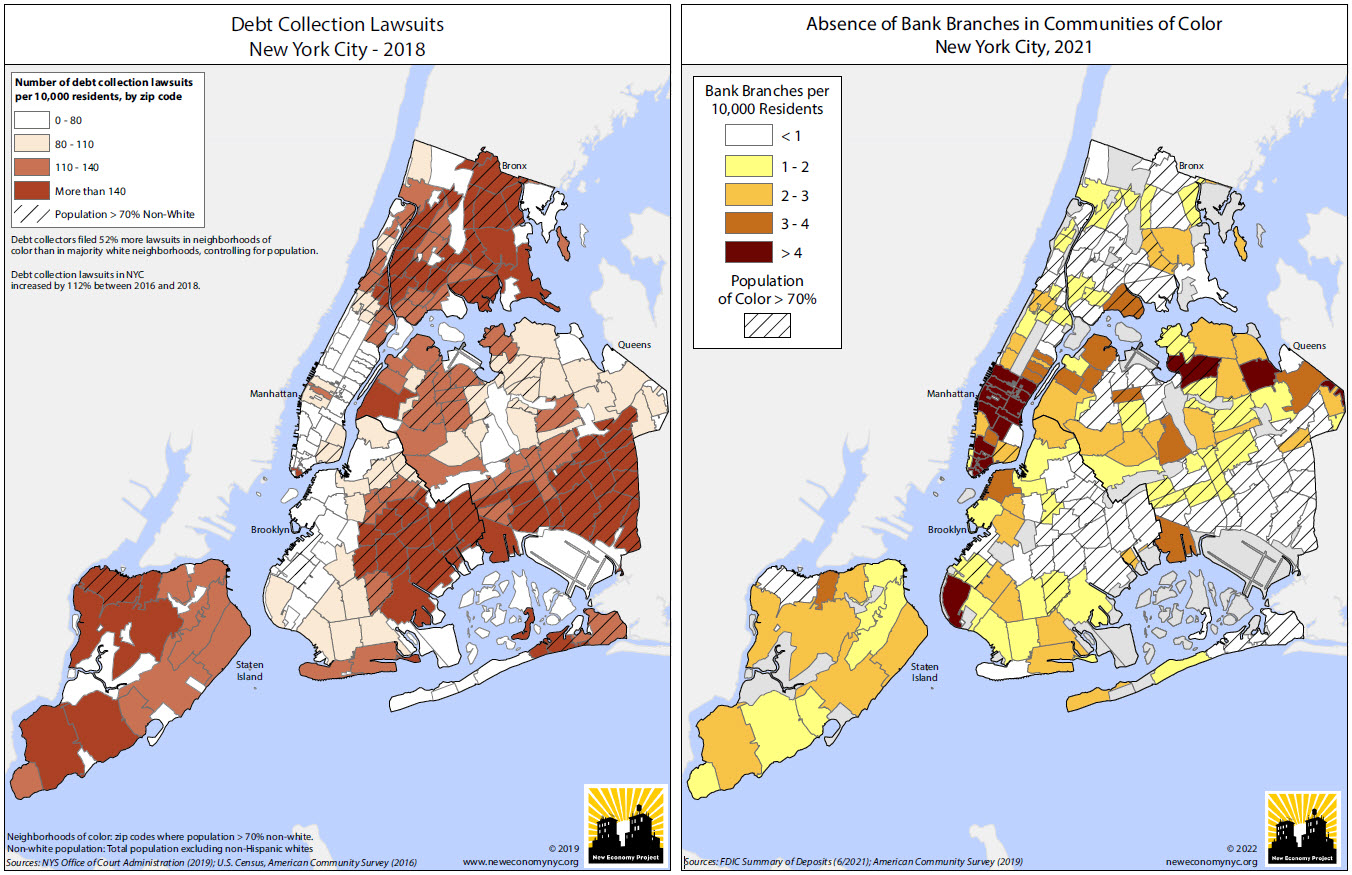
(Left Image): Using data from the NYS Office of Court Administration, this NEP map highlights the concentration of debt collection lawsuits in communities of color and is included in this report prepared for AARP New York.  For additional maps, graphics and YouTube videos on this project visit this web page.  (Right Image):  Another map showing the relative absence of bank branches in NYC’s communities of color. Looking at this annually, one can see changes as gentrifying neighborhoods gain branches, but the overall pattern is a long-standing and remarkably stable one. There are actually six zip codes in the city, ranging in population from about 20,000 to 94,000 and all in communities of color, that have no bank branches at all.

Other examples of NEP research and mapping products can be viewed here.

Summary:

The concept of “place” has always been at the core of how we approach our work” notes Hagen.  “In NYC, people feel very connected to their neighborhoods, and are acutely aware of how much the communities they call home shape their day-to-day lives. There’s no better way than maps to relate to people’s experience of their physical environment, and to help contextualize those environments within the larger, systemic frameworks that we are so often fighting to change.

Clearly, GIS is both an important business and commuication tool for NEP.

Contact:

Ben Hagen
Senior Research and Communications Associate
New Economy Project
121 W. 27th Street #804 | NY, NY 10001
212.680.5100, ext. 221 | neweconomynyc.org


Campus Planning and Geospatial Technologies at UAlbany

GIS used in many areas alongside engineering and architectural applications

College and university campuses are the home for a vast amount of geospatial data covering both the natural and built environments.  Whereas at the beginning of geospatial era there was a clear and defined digital divide – GIS vs. CAD –  today these technologies have evolved to be used and managed together almost seamlessly.  In this space since the early 2000’s we’ve seen the evolution of the Building Information Model (BIM) in along with drone, GPS, and laser scanning technologies serving as a means to capture and generate additional types of geospatial data both indoor and outdoor.  GIS concepts are also important elements integrated into Enterprise Asset Management (EAM), Computer-Aided Facilities Management (CAFM) and Computerized Maintenance Management System (CMMS) solutions.

Built around the geospatial framework which also includes standards for both data collection and data management, GIS applications in campus settings are leveraged by both GIS specialists and engineers alike.  Common program areas include covering areas such as master plan support, space programming, work order management, asset management, emergency management, real estate and portfolio management, environmental and regulatory compliance, and site selection studies among others.

While traditional GIS and engineering software applications such as ArcGIS and AutoCAD support much of the outdoor mapping, facility managers increasingly use a more indoor specific software programs such as Revit, Autodesk BIM 360 Ops, Cartegraph, and ESRI’s relatively new entry into this space ArcGIS Indoors, among others.   In reality, automated systems at large facilities involve a combination of the programs noted above and often also integrate other monitoring and SCADA systems.   If you are new to GIS and geospatial applications to the campus setting, here is a good overview presentation.

Campus Planning at UAlbany

Many of these geospatial-related disciplines intersect directly – and indirectly-  in the Office of Campus Planning at UAlbany which is charged with the overall planning of physical space on campus (indoor and outdoor), capital and operating funding, and supporting the strategic plan of the University.   The office currently has a team of eight which includes Jessie Pellerin who serves as GIS and Signage and Wayfinding Manager.

Jessie is involved with several elements of GIS data collection and cartographic products associated with the UAlbany facilities for the uptown, downtown, and Alumni Quad campuses – including the production of hardcopy maps which are still an important communications and outreach component for visitors and students new to campus.   Nearly all of her day-to-day work is done with ArcGIS Pro.  Field data collection is normally supported with Collector for ArcGIS on an iPad and for offline viewing.

Jessie produces all of the UAlbany maps using just ArcGIS Pro without the use or addition of any desktop publishing software

With regard to above and underground features on, the 500-acre uptown camps, she helps manage a GIS database which includes 122 emergency blue light phone locations, 16.5 miles of storm sewer pipes and 760 catch basin, 6.4 miles of sanitary sewer pipes, 1500 light poles and 12 miles of roads among dozens of other features. Jessie also oversees individual data collection projects conducted by vendors such as the campus wide light poles and irrigation system.   She serves as the ArcGIS Online Administrator for the Office supporting and maintaining several customized viewers for 50 staff across campus in specific work program areas.

One of internal AGOL viewers Ms. Pellerin supports focuses on the locations of accessibility features on the Uptown and Downtown Campus. Pop-ups include more information for each feature. Data was developed from a campus-wide accessibility study.

Another viewer shows the location of the exterior wayfinding and regulatory signage and banners on campus. With over 500 exterior wayfinding signs, 750 regulatory signs, and 550 banners, GIS has been essential in keeping track of sign content and condition for aiding in preventative maintenance, site planning, and branding initiatives. Both of the above viewers were built with Web App Builder.

An example of how space planning is supported using GIS at UAlbany. This graphic shows a 3D visualization of assignable space on the Downtown Campus

As part of supporting the university’s COVID-19 response, Jessie assisted with others by using combining mapped sewer line and manhole data with the occupancy count of each of the residential dorms, to determine the optimal locations for the waste water testing sites in 2020. There ended up being six manholes selected (out of the 282 on campus). Maps were shared with other stakeholders in the project.    

As it relates to campus settings, GIS use is growing and being used more often in buildings and facilities planning by campus staff” notes Stu Rich, Director, Buildings and Infrastructure at Cartegraph.  Initially, as outdoor GIS concepts and technology were beginning to be applied to the indoor environments, cost was often a barrier to get started in building BIM and interior models for many organizations.  “Those barriers are beginning to change” Rich further adds, “While precision indoor mapping will always require higher-end instrumentation, recent products such as MagicPlan and IndoorVu, as well as falling software prices, are making interior mapping and data capture more affordable for large facilities management programs.   All of these products and technologies are now broadly used in facilities management and integrated with GIS applications.”

Recognizing the importance and growth of using digital data both in-house and with the numerous engineering companies performing work on campus, both the Office of Campus Planning and the Office of Architecture, Engineering, & Construction Management (AECM) have developed digital data standards for BIM, GIS, and AutoCAD.

Summary

Large campus facilities such as SUNY Albany bring together the intersection of several geospatial technologies.  Individually each seemingly used or applied for one specific purpose (and often at varying levels of spatial accuracy) but when mashed together in a just web viewer, provide easy access to a wide range of authoritative digital content for decision-makers. Sure signs of the growing maturity and acceptance of geospatial technologies.

Contact:

Ms. Jessie L. Pellerin
GIS and Signage and Wayfinding Manager
Office of Campus Planning
University at Albany, State University of New York
jpellerin@albany.edu

Geospatial Business Spotlight: Maine Technical Source

NY Locations:     787 Old Sergeant Palmateer Way, Wappingers Falls NY
                              2634 James Street, Syracuse NY

Website:               www.mainetechnical.com 

Employees:          18

Established:         1973


The Company:

Maine Technical Source (MTS) sells, services, and supports high-end instrumentation for the geospatial industry as well as the surveying, engineering, and construction sectors throughout New England.  New York State offices are located at 787 Old Sergeant Palmateer Way in Wappingers Falls, & 2634 James Street in Syracuse. 

Gus MacDonald started the company over 45 years ago and more than half of the MTS employees have been with the company for more than fifteen years.  In June 2017, Stuart MacDonald purchased the company with a commitment to continuing the legacy of meeting customer needs.   Maine Technical Source employees are singularly focused on providing exemplary customer service.

MTS is a member of the New York State Association of Professional Land Surveyors (NYSAPLS).  

Products and Technology:

MTS provides a wide range of traditional industry products as well as state-of-the-art components now available in emerging and laser scanning technologies.  A complete listing of products can be found as part of the MTS online catalog.  

Illustrative products common to the geospatial, BIM and AEC applications include:

Field Mapping

Leica Zeno Mobile is a complete tool for high accuracy field data capture with the simplicity of an Android app.  Managing assets has never been easier via it’s intuitive user interface and functionality.  Users can export collected data to the PC as shape files, ASCII or KMZ, either in classic way via cable, USB or using the cloud with Dropbox. The app also comes pre-loaded with aerial imagery.  Learn more about Leica Zeno GIS technology via online training videos here.

UAV Solutions

MTS offers complete UAV solutions for the surveying, mapping and construction industries enabling fast and flexible data collection.  Systems capture, process and analyze millions of data points depicting highly accurate spatial information of the natural and built environment.   One of MTS’s more popular drone solutions is the DJI Phantom 4 RTK which is one the most compact and accurate low altitude mapping UAV devices. 

The Leica Aibot SX focuses on UAV data capture in the surveying geomapping, and asset  disciplines enabling users to create orthophotos, point clouds, and 3D models for cadastral survey and data collection. Leica Aibot CX focuses on UAV data capture in the construction industry providing up-to-date views over construction projects and earthmovings.  It also opens opportunities for daily progress documentation, stockpile monitoring and resource tracking to increase efficiency.

WingtraOne Gen II is a vertical take-off and landing (VTOL) sUAS for mapping of small and large areas.  It utilizes a high resolution Sony DSLR camera platform and post-processing kinematic(PPK) to provide precise geotagging of the images.  As a VTOL drone it can take off and land like a quad-copter and then transition into level flight as a fixed wing.  With the high-resolution camera it can fly missions higher and faster than a quadcopter with outstanding ground sampling distance (GSD) results.

MTS is a Pix4Dmapper reseller which is the the leading photogrammetry software for professional drone mapping.  Users can capture RGB, thermal, or multispectral images with any camera.  Pix4Dmapper’s photogrammetry algorithms transform  ground or aerial images in digital maps and 3D models. 


Field Tablets

Leica CS30 Data Collector is the best of both worlds – light weight (1.67 lbs) and compact yet with a screen size (7”) big enough for use all day long.  Equipped with an LCD IPS screen to provide an optimal color clarity, as well as a much improved and increased viewing angle. The unit also has an ambient light sensor for improved visibility in all lighting conditions.  Portable to fit into a field bag or typical pickup truck glove box.  Other similar devices MTS offers include the Carlson RT4 and the Sokkia SHC6000

Laser Scanners

MTS focuses on providing and supporting Leica Systems laser scanning technology including the new highly portable RTC360.  Intuitive and designed for maximum productivity, this unit efficiently combines the RTC360 high-performance 3D laser scanner, a Leica Cyclone FIELD 360 mobile-device app or automatically registering scans in real time, and the Leica Cyclone REGISTER 360 office software.  Depending on the specific application area of use, MTS also offers HDS software for integration into the AutoCAD, Revit, and MicroStation platforms among others.  Here is a RTC360 video

For a complete listing of all MTS products, visit their website.  

Contact:

Stuart MacDonald, President smacdonald@mainetechnical.com
Bill Treadwell, GIS Sales btreadwell@mainetechnical.com
Brad Beeler, Wappingers Falls brad.beeler@mainetechnical.com
David Filipski, Syracuse dfilipski@mainetechnical.com

Developing and Applying the Geographic Aggregation Tool (GAT) at NYS Department of Health

“R”-based software application is used by public health researchers and data analysts

While often much of the Empire State GIS software discussion evolves around the use of the ESRI platform, there continues to be a steady dose and discussion of alternative geospatial client and web-based products. For example, staff at the New York State Department of Health (NYSDOH) use ArcGIS, but also other GIS programs including MapInfo, Map Marker, SatScan, and QGIS, as well as statistical programs like SAS, SPSS and Tableau for research and surveillance projects.

Supported by funding from the Centers for Disease Control and Prevention (CDC), staff from the NYSDOH Environmental Public Health Tracking (EPHT) Program – also known as “Tracking” – has leveraged the free and open-source software program “R” to develop and maintain the Geographic Aggregation Tool (GAT).  R has grown primarily out of the statistics and data analysis space which is very popular and used extensively in public health research.

GAT is currently maintained by Abigail Stamm at NYSDOH who supports a GAT webpage on GitHub containing an extensive listing of documentation, developer tools, metadata, tutorials and more.  According to Stamm, EPHT staff like using R for a couple of reasons including:

  • R is free,  easily accessible to the public, and enables staff to share the GAT package with agencies that do not have an ArcGIS license or the training and resources to use any of the other geographical software. (Legacy versions of GAT, including a SAS version, are archived on GitHub.)
  • The GAT package automates everything.  This is particularly valuable especially if users include scripting options which bypass the Graphic User Interface (series of pop-up windows) and reduces likelihood of mistakes and makes recording and reproducing workflows and updating much easier.

GAT documentation and content on GitHub.

At its core, GAT aggregates, or dissolves, geographic areas (most commonly used is census tract geography) based on numeric values for each area, such as case or population numbers, as well as other demographic values such as median income.  Health researchers often want subject data at a higher granularity than the county-level, which can conceal or mask variation, especially in counties with a mix of urban and rural populations.  Also, showing data at town level won’t work because many rural towns have very small populations.  Areas with small populations are likely to have few cases, resulting in unstable rates and also putting confidentiality of cases at risk.

To overcome these limitations NYSDOH developed GAT to join neighboring geographic areas together until a user defined population and/or number of cases is reached to support the statistical analysis desired. This allows local health departments and others to use rates to identify hot spots for targeted interventions. GAT can also be used to produce maps at varying geographic resolutions required by the user.

How GAT Works

GAT requests user inputs through a series of dialogs, including menus, checkboxes, and text boxes, so no programming knowledge is necessary.  GAT reads in a polygon shapefile which must contain, at minimum, a character variable that uniquely identifies areas and a numeric variable to sum for aggregation.  A series of dialog boxes allows the user to select:

  1. A variable to uniquely identify areas
  2. One or two aggregation variables
  3. Optionally, a variable of areas within which merging will be preferred (ex. county)
  4. The value (sum) to which the selected aggregation variable(s) should be aggregated
  5. The preferred aggregation method: closest geographic or population-weighted centroid, least value, or ratio of two values

Depending on the specifics of the data and the type of analysis of interest to the user, GAT offers four types of aggregation methods:

  1. Closest geographic centroid
  2. Closest population – weighted centroid
  3. Neighbor with the lowest count
  4. Most similar neighbor

Applying different rules or criteria to the different GAT aggregation results produce contrasting results. These are samples of the GAT aggregation tool when applied to total population numbers in towns in Hamilton and Fulton (NY) Counties. Sample code for producing these maps can be accessed here.

GAT produces two shapefiles, an aggregated file and a crosswalk. GAT also produces a PDF of maps and a log of the entire process, including user settings, any warnings, and a brief data dictionary. (The PDF and log provide much more information than being shown in this article).   These files are designed to help evaluate and report aggregation results and standardize user process.  NYSDOH staff developed GAT to standardize and automate how to aggregate New York’s 4900 census tracts.

Using the different aggregation methods may affect the values of resulting aggregated areas in different ways. For example, it was found when testing GAT that in cases where a small corner of a census tract contained most of its population, aggregating by geographic versus population weighted centroid could provide very different results. Also, when developing aggregated areas for the Tracking portal, it was recognized the portal would be displaying disease rates.  NYSDOH staff felt the most suitable aggregation method for these population-based measures would be to aggregate to the closest population weighted centroid.  To check for areas with smaller populations and unusually large numbers of cases, users have the option to aggregate by case count rather than population (or in addition to population).

While access to health data and resolution of data varies across the NYSDOH (point/address, census tract, zip code, or municipal level), staff in the Tracking program receive hospitalization and emergency room visit data at point level (resident address) from the Statewide Planning and Research Cooperative System (SPARCS). Staff geocode these datasets using multiple programs including MapMarker, SAM in ArcGIS, and NYCGBAT and assign the encompassing census tract to the point data. Methods to assign to tract based on zip code or town and to impute tracts for records that cannot be geocoded due to incomplete address have also been developed.

 Other Applications of GAT

Public Use in New York State

 Working towards NYSDOH’s goal of making sub-county data more accessible, NYS EPHT is developing a platform which will display environmental health outcomes and exposures in an interactive mapping application.  The current EPHT data portal displays county-level indicators but EPHT staff are redesigning it to include subcounty data using the sub-county aggregated areas created by GAT.  This will assist local agencies with targeting interventions while maintaining privacy and confidentiality.

Tracking is also working with Health Data NY (HDNY) to display the sub-county data. The HDNY platform will serve as a data repository displaying data for environmental health outcomes including asthma, chronic obstructive pulmonary disease (COPD), and myocardial infarction (MI; heart attacks), since these are the health outcomes local agencies are most interested in when planning extreme weather-related mitigation and resource allocation. The data will be available for public download along with the shapefile and a brief description of how the shapefile was developed.

The CDC is also using GAT to develop sub-county areas for various health outcome indicators having piloted it for data from other EPHT grantee states for health outcomes including asthma, MI, and COPD.

Sampling Design

 GAT is also being used in the development and selection of sampling areas as part of Biomonitoring NY, a statewide biomonitoring project.  In the first year of sampling this effort has focused on the sampling of households on Long Island. To this end, the group aggregated 2010 census block groups within census tracts so that each aggregated area had at least 440 households. In the next step, remaining tracts that were too small to meet the household minimum were aggregated to neighboring tracts. After completing the final aggregation, study staff randomly selected 25 aggregated areas and mailed postcards and invitation packets soliciting participants in households in the block groups within the selected aggregated areas.  Read more about the project.

Biomonitoring is a way of measuring the amount of environmental chemicals found in the human body. It is an important part of New York statewide epidemiological research that seeks to determine levels of chemical exposure in the human body and help better understand whether chemical exposures are associated with health effects in humans.

Informing Policy

In 2019, NYS passed the nation-leading Climate Leadership and Community Protection Act (CLCPA; aka “Climate Act”) to empower New York residents to fight climate change at home, at work, and in their communities.  NYSDOH, along with several other state agencies, is providing support and assisting in the implementation of the Climate Act. One effort includes identifying disadvantaged communities (DAC) that could benefit from mitigation efforts and allocation of investments. GAT was used to create sub-county areas for several climate-impacted health indicators that will be analyzed with multiple other variables to define DACs.

Learn More About GAT

A variety of documentation is available on the use and development of GAT.  Slides (pdf) from a 2020 and National Association of Health Data Organizations (NAHDO) presentation by NYSDOH staff are available here including a YouTube video.  GAT slides and a video from the 2021 useR Conference are also available.   Most recently staff presented at the 2021 Place and Health Conference in November which included epidemiologists, health geographers, social and behavioral scientists, statisticians, data scientists, and public health professionals from all levels of government.

GAT poster that was presented at the 2021 Place and Health Conference (download here). A lightning talk is also available.

Contact:

Abigail Stamm, Research Scientist
Bureau of Environmental and Occupational Epidemiology
New York State Department of Health
abigail.stamm@health.ny.gov

GAT was written in R-2.9.2 under Windows XP and was revised and converted to a package in R-3.4.3 under Windows 10 using RStudio-1.4.1103 and devtools-2.3.2. The latest version of GAT was compiled in R-3.6.1 and runs in R-3.5.3 through R-4.1.1.

https://github.com/ajstamm/gatpkg

NYC H2O: Advocating Cleaner Water through StoryMaps

NYC-based nonprofit has developed extensive portfolio of educational products for all ages and settings

StoryMaps are such a great communication tool.  Turning geographic and location-based features and concepts into an easy-to-understand medium for the much broader audience which help identify key community resources, assets and experiences that can inform planning and policy-making.  By combining narrative text and other multimedia content with Geographic Information System (GIS) maps and data, story maps serve as an effective means of helping residents and developers visualize and understand projects with greater clarity.  Increasingly becoming an art form unto itself.  Broadly and increasingly used across the geospatial spectrum from the industry-leading ESRI StoryMaps platform  to say the least of the versions being offered by others in the geospatial space including Google Earth, CARTO, or Tableau

I’m sure its not the first time Story Map subject matter has found its way to be included in a more technical oriented conference, but I was nonetheless interested, if not surprised, to see a presentation by NYC H2O at the recent the September 9th New York City Watershed Science and Technical Conference.   A conference historically the home for geospatial-based technical and scientific presentations by engineers, biologists, and others in the water science disciplines, NYC H2O’s presentation was entitled Engaging an Urban Population With Water Engineering Utilizing a Virtual GIS Platform in the Pandemic Era”.

Having received its nonprofit 501(c)(3) designation in May, 2012, such work is not new to NYC H2O as it has built a niche in the environmental education space using the Story Map platform as its primary teaching and outreach tool. Story Maps augment and support their mission to “inspire and educate New Yorkers of all ages to learn about, enjoy and protect their city’s local water ecology.  Since 2009, NYC H2O has offered over 120 educational programs focused on NYC’s water system and ecology to a combined audience of 4,000 people.  Their StoryMaps often incorporate  digitized historic maps, photographs, videos, and social narratives to tell the story of waterrelated  infrastructure.

A couple of NYC H20’s StoryMaps in the water sciences and environmental space include:

Water Systems Overview

I’ve often heard the New York City aqueduct system referred to as the “eight wonder of the world”.   Maybe not as sexy and visible as the Great Pyramid but an incredible engineering marvel nonetheless.  Conceived, designed and built in another era to support the drinking water lifeline of the city

NYC receives 90% of its water from the Delaware and Catskill Watersheds. Aqueducts (red line work) transports the fresh water from a series of reservoirs in the Catskill Mountains over 100-miles from the city.

Fitting that the first StoryMap posted by NYC H2O on their “Hub” website is entitled  Water Systems Overview outlining and showing the many geographies of the system which originates in the Catskills Region.  An interactive StoryMap highlighting the major aqueduct systems (Catskill and Delaware – named for the watersheds where the water is collected), as well as the individual reservoirs both upstate and those in the city.  Household water consumption stats are also included in the StoryMap as well as several interactive learning activities as illustrated in the application toolbar below.  Included in the Site Specific Lessons is a StoryMap just for High Bridge and the Jerome Park Reservoir.

Sewer System and Stormwater Management

This StoryMap, focusing on the relationship between storm water and sanitary sewage, and its overall impact on water quality in the metropolitan region has lots more maps and associated data.

Beginning in 1850, NYC laid 70 miles of sewers, or underground pipes that carried away wastewater.   Today the city has over 7,400 miles of sewer pipes. These pipes move wastewater with the help of 95 pumping stations to 14 sewage treatment plants located in all five boroughs.  Each day, NYC wastewater treatment plants process, or “clean”, a total of 1.3 billion gallons of wastewater.   Produceing about 1,400 tons, or 60 truckloads, of biosolids!

The city maintains 14 sewage treatment plants covering the five boroughs. Treated sewage effluent is discharged into the Hudson and East Rivers and Long Island Sound.

About 60% of New York City’s sewer system is a combined sewer system. This means that one single pipe carries both stormwater runoff AND sewage from city buildings.  During heavy rainstorms, combined sewers systems receive more stormwater runoff and sewage. Wastewater Treatment plants have a capacity, or a limit, to how much water they can clean. When there is more water than the capacity, a mix of stormwater and untreated sewage empties directly into the City’s surrounding waterways. These wet weather events are called combined sewer overflows (CSOs).

The presence of combined sewers are still very prevalent in the metropolitan region with the majority emptying into the East River and the east side of the Hudson River.

Also central to the long term management of clean water – are government regulated programs entitled Municipal Separate Storm Sewer System (MS4) programs.  In populated areas many neighborhoods, including in New York city, as well as industrial areas along coasts, have deployed MS4 programs.  A MS4 has one set of pipes that transports sewage to sewage treatment plants and another set of pipes that transports stormwater directly to local waterways.   Unfortunately, many pollutants (like oil, trash, pet waste, pesticides, and fertilizers from lawns) are washed into this system when it rains. MS4 helps solve one problem (CSOs and sewage in the local waterways) but causes a similar, although smaller, problem since trash and pollution can still enter the local waterways when it rains.

Currently, only about 40% of the NYC footprint is covered by an MS4.

As it relates to the collection of data for the purposes of monitoring citywide water quality, this StoryMap also includes interesting map displays of both fecal coliform (1985-2017) and dissolved oxygen (1909-2017) testing.

Summary:

It’s nice to see as part of such advocacy efforts the use of open data sets and geographic content as made available by government agencies and data portals.  Much of which is included in many of the 21 StoryMaps listed on the NYC H2O HUB.

StoryMaps allowed us to keep students engaged in learning about their local water issues throughout the challenges of the pandemic. The tool has been so popular with schools that this year we launched a curriculum introducing GIS and StoryMaps to several environmental science and environmental justice in high school classrooms”, notes Kevin Barrett who guides NYC H2O’s mapping instruction.

With regard to the September 9th New York City Watershed Science and Technical Conference, Stalin Espinal, School Program Manager for NYC H2O adds “The conference gave us the opportunity to share our work and programs to a community of our peers. We were delighted to have received such enthusiasm and interest in our work with GIS and StoryMaps.  Even resulting in a new StoryMap collaboration in partnership with the Watershed Agriculture Council (WAC) which works with local farms on and around the upstate New York City watershed to promote Best-Practices and make improvements that help protect the water quality of our drinking water.”

Contact:

Kevin Barnett
GIS Education/Project Manager
kevin@nych2o.org
www.nych2o.org

10 Questions: Ken Stewart, NUAIR

Northeast UAS Airspace Integration Research Alliance

Ken Stewart is currently Chief Executive Officer of NUAIR (Northeast UAS Airspace Integration Research Alliance, Inc.) located in Syracuse, New York.  NUAIR is a New York based nonprofit organization that provides expertise in unmanned aircraft systems (UAS) operations, aeronautical research, safety management and consulting services.   He joined the organization in late 2020 where he is responsible for setting the overall vision and product strategy for the organization.  Mr. Stewart is an experienced industry veteran in wireless telecommunications and cloud-based software market with a specialization in building Enterprise SaaS, Federated digital marketplaces and platforms.

Prior to joining NUAIR,  Mr. Stewart served as the CEO of AiRXOS, a General Electric aviation company, where he led innovation, development, and commercialization of Unmanned Traffic Management services.  After beginning his career in engineering and management positions at IBM and GTE, Stewart served as an executive with several venture capital and private equity-backed companies commercializing and scaling pre-revenue start-ups and transforming organizations for growth.

He was recently appointed president of the Commercial Drone Alliance (CDA) which is an independent nonprofit that works with all levels of government to collaborate on policies for industry growth and the overall responsible use of commercial drone technology.

I was recently able to catch up with Ken and NUAIR staff to discuss his work in the drone space in New York State.

eSpatiallyNewYork: What is the primary function and purpose of NUAIR?

Stewart:  NUAIR is responsible for the continued development and advancement of New York’s AAM Proving Grounds and 50-mile UAS corridor between Syracuse and Rome, facilitating beyond visual line of sight testing, commercial operations, and the safe integration of UAS and eVTOLS into the national airspace.  Here’s a link to some of the history of how everything got started: https://esd.ny.gov/central-ny-rising-uri

NUAIR also manages operations of the New York UAS Test Site at Griffiss International Airport in Rome, NY, one of just seven FAA-designated UAS test sites in the United States and is responsible to the Federal Aviation Administration (FAA) and National Aeronautics and Space Administration (NASA) to conduct operations for UAS and advanced air mobility (AAM) eVTOL (electric vertical takeoff and landing testing).

eSpatiallyNewYork:  NUAIR seems to be mostly New York State-based.  How does its function and purpose differ from CDA? 

Stewart:  We continue to conduct meaningful projects and tests in New York for the FAA, NASA, and industry to advance both the UAS and advanced air mobility (AAM) industries. These projects provide the needed data to prove the safety and reliability cases to help shape policy and regulation to unlock the true potential of commercial drone operations. I am taking my professional expertise, coupled with the knowledge of the 3,600+ UAS test flights NUAIR has conducted at the New York UAS Test Site to help generate the needed policies and regulations to make national commercial drone operations both scalable and economically viable. I also represent NUAIR on the FAA beyond visual line of sight (BVLOS) advisory and rulemaking committee (ARC), actively working with the FAA and fellow industry leaders to solve the issues around safely flying BVLOS. Being a part of both of these initiatives gives NUAIR the ability to directly influence and shape the future of aviation.

eSpatiallyNewYork:  Can you share some examples of NUAIR  providing outreach and consulting to governments in New York State on drone use and/or technology?

Stewart:  NUAIR has helped over 20 state agencies implement their drone programs including law enforcement, fire departments, environmental conservation and more. Selected examples are highlighted in this YouTube video.

We’ve also just started working with the New York State Thruway Authority, helping them integrate drones into their daily operations for routine bridge and infrastructure inspections. Flying a drone to scan a bridge is a lot safer than the traditional means of using a snooper truck, both for the crew inspecting the bridge and for motorists. Couple that with faster, more cost-effective inspections, it’s a win-win for the crew, the local economy and New York State as a whole.

eSpatiallyNewYork:  Would appear a lot of this work is in the public safety community.  Are there other areas of government?   

Stewart:  The healthcare industry is beginning to realize the benefits of utilizing drones as well, especially the ability of contactless delivery of materials. You can read here about one of our recent collaborations with SUNY Upstate Medical where we helped deliver unused COVID-19 Test Kits.

eSpatiallyNewYork:  Explain NUAIR’s relationship with the start-up incubators Genius NY and The Tech Garden. 

Stewart:  GENIUS NY and The Tech Garden are key partners and organizations for the Central New York UAS and high-tech ecosystem. We work directly with many of the companies in the Tech Garden and actively promote the resources both organizations provide to tech startups, actively contributing to the economic development of the region. Our COO Tony Basile is also on the board of directors for GENIUS NY, actively reviewing applicants and voting on the winners.

eSpatiallyNewYork:  The NUAIR Alliance is impressive.   How do these categories stack up in New York State? 

The NUAIR Alliance continues to grow on a global scale and includes organizations from all aspects involved with UAS and technology including policy & standards, spectrum, test sites, components, government and more. Visit https://nuair.org/alliance/ to see all of our active Alliance members.

NUAIR and the New York UAS Test Site has brought over 330 different companies from across the world and thousands of people to Central New York throughout the years and continue to bring in companies to test and setup shop.

eSpatiallyNewYork:  FAA, NASA Aviation, and state/local drone regulations – how does NUAIR stay on top of all the changes?  It all seems so fluid, dynamic, constantly changing.

Stewart:  This is what we do all-day, every-day. NUAIR employees are talking with, working with and/or conducting meaningful projects the FAA, NASA and industry every day of the week.

eSpatiallyNewYork:  How’s the industry dealing with all of the security concerns over Chinese made drone products such as the DJIs?  How are US-based companies responding in this regard?  

Stewart:  The concern with Chinese/foreign made drone and components continues to grow, including the recent regulations from the United States government stating that federal funds cannot be used to purchase Chinese (or other specific foreign countries) drone components. A lot of the public safety officials we work with are now looking into one of our partners, Skydio, an American drone manufacturer, who was a major hit at the New York Public Safety UAS Summit we just held. We’ve also validated a drone parachute on the WorkHorse, an American-made UAV built for deliveries.

eSpatiallyNewYork:  Any involvement / business development with the any GIS companies?

Stewart:  We have quite an active program with Cardinal Geospatial, trying to define an analysis tool that could be used to determine whether an operator was using a DEM with enough granularity for their mission and the terrain over which they are flying.

eSpatiallyNewYork:  Looking into the crystal ball, what’s the next big thing for the upstate drone/NUAIR community? 

Stewart:  5G. MITRE Engenuity Open Generation Consortium has determined New York’s 50-mile corridor is a prime location to launch the nation’s first 5G UAS testing range, a designation that will greatly enhance New York’s position as a global leader in this emerging technology sector.

The work we continue with the FAA, NASA, and industry both on the standards/regulations side and the physical data collection/testing side are helping shape the future of aviation. This work will unlock the true potential of drones for commercial operations that are both scalable and economically viable. The drone and overall high-tech Central New York ecosystem has everything a company needs to land and expand their UAS operations.

Contact:

Tim Lawton
Director of Marketing & Public Relations
tlawton@nuair.org
www.nuair.org

LAMP: The Authoritative Liquor License Mapping Application for New York State

Its not too often one bumps into New York State Liquor Authority (SLA) GIS staff along the geospatial trail across the Empire State, but over there on the sidelines, agency staff continue to maintain an admirable web mapping application entitled  New York State Liquor Authority Mapping Project (LAMP).  I was able to catch up with William Cowley, Public Information Officer for the State Liquor Authority (SLA), to find out more about the 2021 release of LAMP.

Current LAMP Application

With the current version of the application finalized in March of this year, LAMP features an impressive tool kit to explore the vast statewide SLA database containing locational data on active, pending, and inactive permit data for beer, wine, and liquor establishments.  The data can be filtered even more specifically to show those locations which are categorized by:

  • On Premise Liquor
  • On Premise Wine
  • On Premise Beer
  • Off Premise Liquor
  • Off Premise Wine
  • Off Premise Beer
  • There are also permits for manufacturing and wholesale

In addition to serving as a great public information outreach tool, the application also serves as a useful utility and reference tool for applicants seeking a liquor license anywhere in the state.  The user online HELP documentation is excellent and available for download as well.

A 750-foot default search around 148 Martine Ave. in White Plains identifies 23 locations with active NYS liquor licenses, two pending, and 21 former or inactive licenses. Icons are colored coded to match active, pending, or inactive licenses keyed to the Legend box in the lower right-hand corner of the viewing screen (which can be expanded on the live online version).

Nearing almost ten years old, LAMP was originally launched in February 2012.  SLA staff assisted in the original development and launch of LAMP with consultant support from Fountains Spatial.  The 2021 LAMP update was completed with the assistance from Troy-based Cogent Technologies.  The viewing application is built on top of a customized version of ArcGIS Online (AGOL) and utilizes a SQL database to store SLA master data.  Updated daily, the application contains approximately 54,000 active and pending licenses.  The database is built on top of the application process which starts here.  The site makes use of the New York State Geocoding Service with the Google geocoding service as a backup.  LAMP is hosted by New York State Office for Information Technology Services.

Mapping Tools

The viewer includes an impressive user toolbox with several functions being AGOL defaults (i.e. scale dependency of map features, identify tools, .  Others have been customized to provide increased functionality and use of the data.  While changing base maps, scale dependency rendering of data, searching by address or user placed pin, or exporting search results to a CVS file are standard AGOL fare, LAMP offers some cool extended functions including, but not limited to:

    • Query results displayed as a new layer in map legend
    • Customized symbology for all feature types
    • A “measuring” tool which creates both a list of the closet (8) licensed facilities as well as within the 200’ and 500’ regulatory buffer areas (see below). A sample of a proximity report can be downloaded here.
    • An uber robust printing tool with advanced functions to create hardcopy maps
    • Easily include and attribute table view – below the main map window – of a particular layer

There are many other functions well documented and available in the application as well.

Image above highlights customized features in the LAMP application including expanded printing functions and creating new layers which are shown in the layer legend.

While the permitting process does not require the use of LAMP,  most applicants find it useful to identify prior licenses at their chosen location.  The locations of Public/Private Schools and Places of Worship are also included in the application because under the Alcoholic Beverage Control Law, SLA may not issue full liquor licenses (for bars/restaurants or for liquor stores) if the location is within 200-feet of a school or place of worship.  There is also a “500-foot law” which the agency must consider if there are already three or more active liquor licenses within 500 feet of the proposed location.

Integration with SLAM

In an interesting use and application of the SLA database, reference is made to BetaNYC’s SLAM viewer.  Used by community boards when reviewing liquor license applications and sidewalk cafe applications, the public facing tool aggregates information about active liquor licenses, sidewalk cafe licenses, 311 complaints about bars/restaurants/clubs, and restaurant health inspections in NYC onto a single map.   Statewide liquor licensing data can be downloaded from Open Data NY here.

SLAM effectively integrates numerous open data datasets including those from New York City and SLA. Users can zoom to particular addresses and click on relevant features to collect information that may be needed to review a license application. The tool is rendered through Carto – a Web mapping service

Contact:

William Crowley
Public Information Officer
New York State Liquor Authority
William.Crowley@sla.ny.gov

Hub2Hub: Sharing and Promoting the Geospatial Message

Publishing spatial data content has proven to be great outreach in terms of providing transparency and exposure for many government GIS programs – including here at Westchester County.  Increasingly much easier for geospatial organizations to do courtesy of powerful server technology allowing these same agencies to easily spin together data services based on common thematic features such as environmental, planimetric, business, demographics, cultural, parcels, and aerial photography to name only a few.  Though the data service environment is better understood and leveraged by a specific user community knowing what type of spatial content to look for, there remains even a larger community of geospatial users which navigate data portals to download just individual data sets.  Looking for that individual shapefile, KML, or .dwg file for their own individual project.

And even with all of this good geospatial content available, many publishing organizations – particularly government – struggle with building educational outreach programs for the larger GIS user community.  Tailored programs for users in community and advocacy groups, nonprofits, and even the business sector instructing how to effectively use and leverage our data.  Government GIS programs often do not have the resources or the business model to deliver these types of services outside of their organization.

Enter the emerging roll of “service” Hubs which specialize in leveraging government open data  in ways government programs normally cannot offer. Some are nonprofit in nature or affiliated with academic institutions.  Others, like OpenHub based in the lower Hudson Valley, is a for-profit venture.  The common theme among them is a window offering a wide range of engaging programs increasingly based on government data sets featuring hackathons, workshops and training programs,  application tools, and offering  business tech “round table-type” discussions.  While open source software such as OpenStreetMap, QGIS, Python, and R are commonly used to support their missions (and thus, the easy and affordable entry point for new users), one can see the use of ArcGIS Online and CARTO being offered as well.  Effectively expanding the use and understanding of geospatial concepts and bringing technology to the people.

Third Party “Hubs”

I’ve referenced and written before on the great work of BetaNYC serving in this space.  Particularly with regard to extending content of NYC OpenData  through their numerous programs including the flagship NYC School of Data conference.  While New York City does an incredible job in promoting and maintaining city government’s open data catalog itself, BetaNYC extends the effort by building an entire framework of putting the data into the hands of residents on the streets.

This BetaNYC viewing applications enables user to navigate the numerous political, administrative, and operational districts across New York City

Early in this space in the metro NYC area was the work of Steve Romalewski who started providing mapping services to the nonprofit sector as part of the Community Mapping Assistance Project (CMAP) which at the time was affiliated with New York Public Interest Research Group (NYPIRG).  Since 2006 he has been affiliated with the CUNY Mapping Service as part of the Center for Urban Research, Graduate Center at City University of New York (CUNY).

The Long Island Index was an early and very visible project that the CUNY Mapping helped create.  Another effort affiliated with the Center is the NYC Labor Market Information Service uses federal business and labor data sets.  Be sure to check out their Career Maps infographics and reports.  Similar academic efforts in the city exist at the Spatial Analysis and Visualization Initiative (SAVI) at Pratt Institute and the Center for Spatial Research at Columbia University.

Though originally developed at CMAP, the CUNY Mapping Service now hosts OASIS which is one of the most comprehensive mapping and viewing application covering the New York City footprint. Dozens of government generated datasets are made available in the viewer.

While the OpenHub is only beginning to jump into the geospatial space, its Founder Yulia Ovchinnikova will be highlighting the Westchester County GeoHub as part of the 2021 HV TechFest Conference as an example of open government and open-source data sharing to promote building communities. OpenHub will also be using content from the county’s GeoHub as part of a course project during a current online Data Analytics Bootcamp.  As regional technology and economic development is an important focus to OpenHub’s mission and purpose, our discussion started by focusing on a new web map being published which highlights the emerging BioSciences Ecosystem community in Westchester County.  The County is home to the largest biosciences cluster in New York State, boasting 8,000 jobs and 20 percent of the State’s total biosciences employment. The cluster comprises academic institutes doing basic research, R&D and clinical stage startups, large manufacturers and supply chain participants. OpenHub offers a mixture of both free and fee-based online programs including coding clubs, meetups, programming, and specific events for small businesses and startups. OpenHub is an open ecosystem resource center committed to building a tech-sector in the Hudson Valley and beyond

Government open data and economic development. BioScience business location X,Ys are available for download via ArcGIS Online.

MANY organizations leverage government generated geospatial data to support their own business needs and/or to champion a host of civic needs and issues.  In just one area, such as environmental justice (EJ), a Google search located a document published by the SeaGrant program at SUNY Stony Brook which identifies the numerous individual agencies (largely government and nonprofit) engaged in providing “Environmental Justice Mapping Tools for New York State Communities”.   Child care, social services, public safety, public transportation, sustainability, climate change, and civic issues only scratch the surface of the spaces where advocacy groups are involved in using government geospatial content for the larger public good.

Summary

What differentiates the groups itemized above are that they are more full service, a la carte organizations offering a wider range of products and services.  Staffing and resources to turn government data content into meaningful deliverables such as workshops (online and in-person), hackathon-type events, community events,  training courses, and even bringing the data to civic leaders and administrators in ways which is simply not possible by government publishing agencies.  Such outreach is often very targeted making the data more meaningful and ending up in the hands of those who understand its content the most.  Viewing and using the data at the “micro” as opposed to the “macro” or a larger geographic footprint.  Local is better.

While technically not all “hubs” in name, these groups continue to illustrate the growing benefit of how organizations are adding value and exposure to the government data assets.  In many scenarios, building partnerships with these types of service organizations can be of great value to government publishing agencies.


Geospatial Business Spotlight: Woodard & Curran

Location:                      Rye Brook, New York (Other Locations Nationwide)

Website:                       Rye Brook & Corporate

Employees:                 30 Rye Brook Office / 1,200 Nationwide

Established:                1979

The Company

Woodard & Curran is a privately held, national integrated engineering, science, and operations company. It was founded in 1979 by  Frank Woodard and Al Curran with a mission to provide a safe and enjoyable place to work with opportunity, integrity, and commitment, and to attract talented people. Woodard & Curran experts are devoted to their work which is reflected in exemplary project and program results for both public and private clients. Through a multidisciplinary approach, Woodard & Curran strives to solve clients’ technical and business problems, routinely finding unique and cost effective solutions for their clients.

Geospatial Software and Technologies:

A registered ESRI Business Partner, Woodard and Curran’s geospatial team offers the following services:

  • Needs Assessment & Implementation Planning
  • ArcGIS Online (AGOL) Configuration & Management
  • ArcGIS Enterprise Planning & Implementation
  • Paper to Digital Conversion
  • Data Standards Development
  • Field Data Collection
  • Data Integration
  • Database Design & Administration
  • Map Production
  • Web GIS Development
  • Mobile Application Development
  • Asset Management Planning and Implementation
  • Computerized Maintenance Management System (CMMS) Integration
  • GIS and GPS Training

Geospatial Products and Services:

Woodard & Curran’s geographic information system (GIS) experts leverage the latest technologies to transform outdated data management processes into practical, efficient, and effective solutions for public and private clients. As a registered ESRI Business Partner, Woodard & Curran uses ArcGIS Online’s powerful platform to optimize spatial data through web maps and workflow specific applications for internal or public use. Woodard & Curran customized ESRI’s ArcGIS Online and Portal environments  provide clients with secure permission-based access for individual users to view, edit, or analyze data. Specific geospatial programs supported include:

ArcGIS Online Jumpstart Program

Focusing on the ArcGIS Online framework, Woodard & Curran provides customized, certified GIS professional assistance to organizations getting started with AGOL by offering:

    • Initial setup and configuration of an ArcGIS Online environment;
    • Prioritizing web maps and applications;
    • Instructions on setup, configuration, and use of web maps and applications;
    • Ongoing training for those responsible for managing AGOL environment

 GIS Enterprise Solutions

Woodard & Curran offers professional services for the full suite of ESRI ArcGIS products including ArcGIS Desktop, ArcGIS Enterprise, and ArcGIS Online along with extensions and add-ons. Such client services are offered on premise or remotely depending on the nature of the GIS professional services being provided. This work includes support for GIS needs assessments, data conversion & migration, and design & implementation of new GIS environments for clients just starting out with GIS. For clients with more mature GIS environments, Woodard & Curran professional staff also provide advanced GIS Strategy and Planning, System Integrations, or Advanced System Architecture and Design Services.

Field Data Collection Solutions

Woodard & Curran’s geospatial experts help clients identify, configure, and implement a variety of field and mobile data collection solutions.  Field data collection can include the inventory or field verification of assets using mobile technologies including smart phones, tablets, and Global Positioning System (GPS) devices. Depending on the needs of the project, information can be collected with varying degrees of location accuracy ranging from sub-meter to centimeter. Mobile data collection applications, such as ESRI Field Maps and Survey 123, and GPS solutions allow for accurate updates to be made in the field for real-time data management.

Mobile data collection is a “must-have” app for the engineering disciplines. Woodard & Curran designs and deploys a wide variety across many platforms.

Woodard & Curran’s GIS experts also offer drone services to access terrain or infrastructure that may be too vast or pose safety concerns with numerous FAA certified small unmanned aircraft system (sUAS) and drone pilots.  Drones produce high resolution orthoimages, elevation contours, three-dimensional and land use analysis, volume measurements, planimetric maps, and vertical or horizontal visual measurements.

Woodard & Curran has FAA licensed UAS operators which help support many types of field data collection projects. Drones are increasingly being used to access sites which are either inaccessible or unsafe for field workers to get to.

Asset Management Technology

While asset management (AM) plans operate on a long-term vision, these plans rely on hundreds of daily dynamic inputs. And keeping track of these data points and life-cycle strategies requires a comprehensive AM technology program.

AM technology applications must be chosen carefully because they will store critical asset information, administer aspects of maintenance process and provide critical information to users when needed. These applications should fit both current and future needs, while providing the functionality necessary to maintain critical assets effectively. In supporting geospatial applications in this space, Woodard & Curran leverages business intelligence (BI) software, such as Microsoft PowerBI and ArcGIS Dashboards, to connect, integrate, analyze, and present business key performance indicator (KPI) data.

Woodard and Curran’s geospatial asset management strategy is integrated with organizational business programs such as Business Intelligence (BI) and Data Analytics and Enterprise Asset Management Systems (EAMS).

Testing Public Water Fountains for NYC Parks

New York City Department of Parks and Recreation (NYC Parks) retained Woodard & Curran to test for sources of lead in approximately 3,500 interior and exterior public drinking water fountains. While the initial proposal estimated eight weeks, the city wanted to fast-track the project with sampling beginning the first week of May 2019 and wrapping within five weeks. With the help of robust existing GIS data for the exterior fountains, Woodard & Curran’s field teams were able to meet this expedited timeline.

GIS data was analyzed to create groupings of fountain sites, organize workflow, and improve efficiency as six teams were deployed six days a week to reach nearly 900 public parks across the city’s five boroughs. Field staff were equipped with mobile devices to use GIS-compatible applications ArcGIS Collector and Survey 123 for real-time recording of sampling progress, asset information, and results reporting. The technology helped managed the need to cordon off each fountain for 8 to 18 hours, return to collect a sample after stagnation, and then a 30-second to one-minute flush sample. This also enabled field staff to build out GIS data for the approximately 500 interior fountains that were not previously listed in the client’s GIS. As the sampling progressed, the real-time collection of information on mobile devices fed into a public interactive map on the NYC Parks website.

Woodard & Curran mapped and took water samples at over 3,500 water fountains across the five boroughs in New York City in 2019.  The effort added many new features which where previously not included in the drinking fountain inventory.

Workflow & Data Accessibility for Town of Cortlandt, New York

To improve efficiency across municipal departments that relied on information about physical assets, the town of Cortlandt sought to enhance its GIS program. Woodard & Curran worked with the town to identify specific ways to strengthen their GIS program, targeting data quality and work order management as areas of significant opportunity. By focusing on the quality and integrity of data, GIS experts helped develop a public web GIS platform. To further leverage the technology, a work order management system with mapping interface was developed for staff, which allows them to generate and close out work orders while still in the field. All data from the work order system is available to managers, enabling them to see emerging trends and improve planning efficiency.

The Town of Cortlandt (NY) Work Order Management System (WOMS) provides town staff easy access to important municipal work orders (previous, current and pending) covering several operational programs and departments.

Contact:

Anthony Catalano, Senior Principal acatalano@woodardcurran.com
Jake Needle, GIS Program Manager jneedle@woodardcurran.com

Cash Savings: Affordable Geospatial Bachelor Degrees in New York State

While putting together my last article (GeoSpatial Student Spotlight), I came across a related article that’s worth a quick mention.  In the same academic space, it is an article by the online site Affordable Schools which is essentially a clearinghouse of sorts, inventorying and ranking schools  on a wide range of academic programs and professional fields on three core metrics:   Cost (affordability), class size (student-to-faculty ratio) and student success (graduation rate).  The report is entitled: “30 Best Affordable Geographic Information Science and Cartography Degree Programs (Bachelor’s) 2020”.

Albeit not in the same conversation as the more esteemed college ranking reports by Forbes, U.S. News and Word Report, or Niche, the Affordable Schools evaluation approach is relatively simple in how data is collected/evaluated and from what sources.  And yes, the bottom line focusing on affordability.  Best yet, it paints an outstanding picture of affordable traditional geographic information science/system (GIS) bachelor degrees in New York State when compared against the field across the United States.  Interesting results with four New York State schools in the top thirty with three in the top ten.  All are SUNY schools which speaks volumes to the affordability of higher education opportunities in this space across the Empire State.

Points for ranking the schools and their affiliated geographic information science/system programs were allocated in the following manner:

Those schools in New York State identified in the “30 Best Affordable Geographic Information Science and Cartography Degree Programs” (2020) include:

#30      Farmingdale State College
Farmingdale, NY 11735
Points:  6
#6        SUNY Cortland
Cortland, NY  13045
Points:  7
#3        University of Buffalo
Buffalo, NY  14260
Points:  8
#2        SUNY College at Potsdam
Potsdam, NY  13676
Points:  8

Potsdam and Buffalo ending up with the same point total but Potsdam most likely getting the slight higher ranking due to a slightly lower in-state tuition fee and Buffalo having a much higher out-of-state tuition price tag.  While University of Buffalo has been a mainstay on the Empire State higher education geographic information science/system stage for over three decades – the Farmingdale, Cortland and Potsdam programs are of more recent development. The University of Buffalo is one of the three original universities associated with the The National Center for Geographic Information and Analysis (NCGIA) formed in 1988.

Again, the caveat here is that this is 2020 data and for traditional, on-campus bachelor degree programs – which almost seems like an oxymoron in July 2021.  So while there may be some resemblance to a “return to campus” in the years ahead, the COVID pandemic has most probably changed the delivery of higher education classes and programs to some extent for good.  And with it, creating more educational opportunities, all levels,  in the online environment.  For 2020 affordable online bachelor geospatial programs, there is the OnlineU website though only with ten schools identified and none within New York State.  Though the good news with online opportunities is that there is a growing acceptance and presence across the Empire State in certificate programs and perhaps even the availability of an online Associate Degree in the future.  Such discussion will be the subject of a future eSpatiallyNewYork blog post.

Of course the programs itemized above are not the only schools in the state which offer bachelor programs in geography information science/systems, geography, and  related technologies. Four-year, masters and PhD programs are available at universities in the New York City as well as other SUNY campuses which can be identified by using the SUNY “Find Your Major” search widget here.

Spread the news.