Trained and certified operators work closely with state and local agencies in a myriad of data collection and inspection programs
Over the past three years, the New York State Thruway Authority‘s Unmanned Aircraft System (UAS) program has been expanding the application of drone technology across multiple areas of state governments. With support and encouragement from executive leadership coupled with dedicated staff in operations, the program has grown quickly and the benefits continue to be realized. The program is based on a commitment to safety, innovations, and increased government efficiencies.
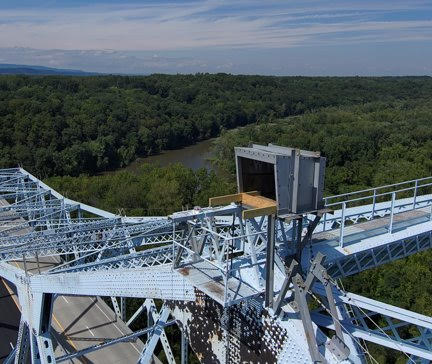
The use of drones reduces the cost and time of bridge inspections significantly. This image shows the Skydio S2+. Here is a great/short Skydio video on bridge inspections.
From Bridge Inspection to Bird Boxes: A Diverse Program
While the program began by exploring applications for UAS in bridge inspections, opportunities to apply the technology have grown agency-wide. Efforts by the UAS team in 2023 lead to a $1.5 million Strengthening Mobility and Revolutionizing
Transportation (SMART) Grant U.S. Department of Transportation as part of the Bipartisan Infrastructure Law, to update workflows and inspection procedures, and develop exciting capabilities like structural monitoring and digital 3D modeling.
Done missions in the last year has included the UAS team traversing the State of New York to inspect bridge mounted falcon boxes, searching for the presence of beaver in flooded areas, verifying the condition of rock in drill holes more than 40 feet deep for bridge piles, gathering data for corridor mapping along the right-of-ways, and covering commemorative events for media relations.
The drones offer a fast and safe way to survey locations of bird boxes located on Thruway bridges across the state. The process can be done without disrupting the birds versus having an inspector do the work. Using drones for the inspections is much more efficient and cost effective. This bird box is on the Castleton on Hudson Bridge outside of Albany.
Building a Skilled Team: Rigorous Training and Certification
The Thruway’s UAS team of FAA licensed, Part 107 pilots, which now exceeds a dozen, originate from a wide array of professional backgrounds including Land Survey, Environmental Planning, Traffic Management, and Highway Design. The program is currently refining the agency training program, while adhering to Federal, State, and local regulations, offering in-house practice opportunities, and live flight training across the system. Additionally, the program benefits from the exceptional training programs supplied to state agencies by the NYS Department of Homeland Security. This includes equipping the team with advanced skills and knowledge from Part 107 Test Prep, Basic Flight Operations, Night-Flight Operations, Drone Thermography, and certification classes for Remote Pilot Proficiency Evaluation. With some of the T-pilots certified as Level 1 Thermographers, staff can utilize infrared cameras to analyze concrete and pavement as well as provide support for emergency services for search and rescue and Haz-Mat detection. The Thruway trains along with NYS Department of Environmental Conservation, NYS Troopers, County Sheriffs, and other first responders at the NYS Division of Homeland Security & Emergency Services mostly at the State Preparedness Training Center (SPTC) in Oriskany.
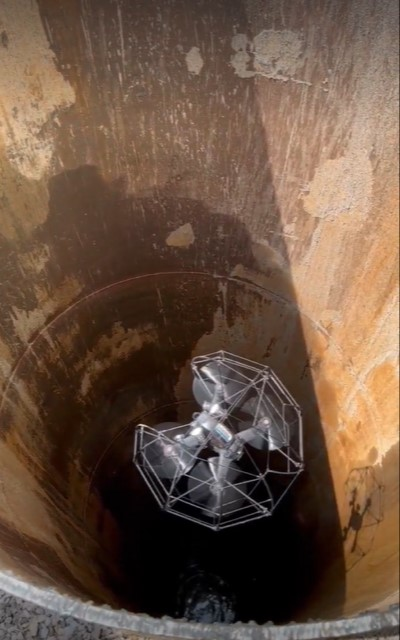
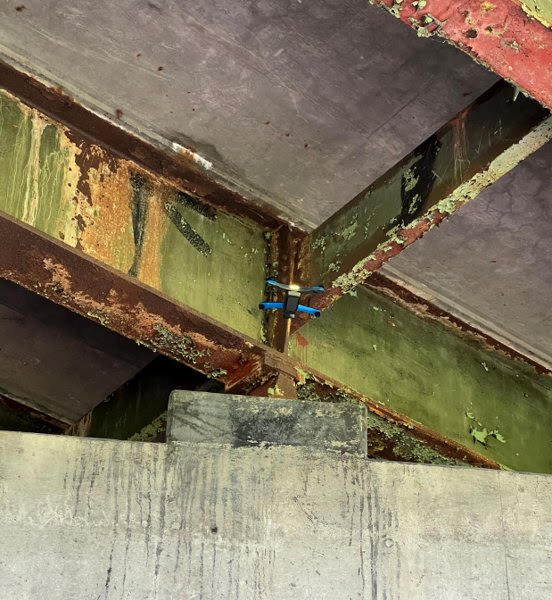
Drone cages have evolved to help protect device propellers in confined spaces, particularly inside structures and infrastructure systems. Here, the Thruway is using drones as part of the inspection process during the construction of bridge footings.
The team also works closely with representatives from Northeast UAS Airspace Integration Research Alliance (NUAIR). The not-for-profit drone research coalition provides subject matter experts as consultants to ensure that the program keeps up with evolving regulation, as well as testing and showcasing for new drone technologies.
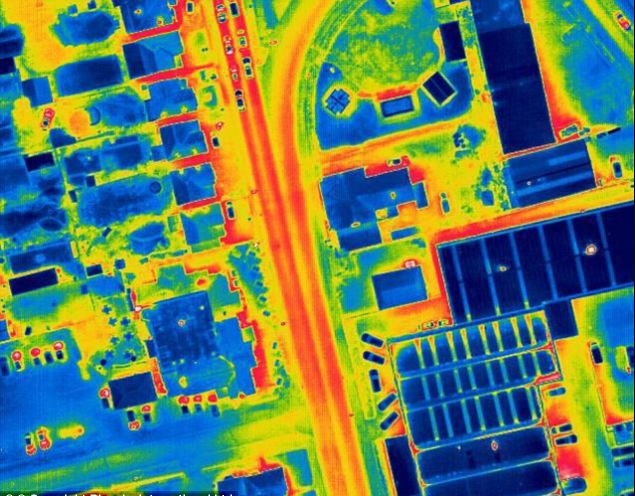
Drone thermal imaging can also be used in a myriad of public safety applications including search and rescue operations.
Tech Exploration: Choosing the Right Tools for the Job
With more and more manufacturers entering the market, hardware options are becoming more specialized for individual tasks. And with the greater availability of hardware and technology options comes the increased scrutiny required to select the right tool for drone-related work. Much of the Thruway drone fleet consists of domestically produced, National Defense Authorization Act (NDAA) compliant aircraft, in conformance with the Buy American Act. The program also have a specialized drone designed for confined spaces with fully caged rotors and supplemental lighting added. Training drones are inexpensive, durable, in-door only drones that have no flight stability assistance or GPS which new pilots use to develop “stick skills” before progressing to live outdoor flights. The Thruway UAS pilots are always on the look out for the next aircraft which will improve efficiencies in data collection and continue to promote user safety.
Data Acquisition and Processing: After the Landing
While flight time in the field remains the most exciting draw to the program – it’s the data processing portion of the job where the real work is done. Just as hardware options expand, so does the software. As such, Thruway drone staff continue to explore various software platforms for mapping and modeling. Packages like Bentley’s iTwin, and Pix4D are currently in use while the team looks to expand knowledge of other options provided by companies like ESRI’s Site Scan for ArcGIS. The UAS team also continues to collaborate with the Thruway’s internal IT department and the GIS team to create effective data handling solutions for the large datasets created and associated with drone technology.
Summary
Upon creation of the program, the NYS Thruway Authority discovered a coalition of state agencies in New York and beyond which routinely gather and communicate to share experiences and knowledge about the UAS industry. All state agencies operating drone programs meet to train together and explore different aircraft and software platforms. Along the way building a team of drone experts which will promote safe and efficient inter-agency operations. NY State Fire, NY State Police, NYSDEC, NYSDOT, several county sheriffs, Metropolitan Transportation Authority (MTA), and many other agencies all work together to provide drone support state-wide. In doing so, benefiting from the collective experience and shortening the learning curve. “In addition to reducing costs in data collection and mapping efforts, drones offer new efficiencies and safety benefits to our organization”, notes UAS Department Director and Senior Surveyor, Andrew Kosiba, “Thruway staff continues to identify new uses and applications of the technology as our program branches out wider than we originally thought possible.”
Contact:
Joel Kayser, PLS
Land Surveyor & UAS Remote Pilot
NYS Thruway Authority HQ
200 Southern Boulevard
Albany, NY, 12209
Joel.Kayser@thruway.ny.gov


 Woodard & Curran is a privately held, national integrated engineering, science, and operations company. It was founded in 1979 by Frank Woodard and Al Curran with a mission to provide a safe and enjoyable place to work with opportunity, integrity, and commitment, and to attract talented people. Woodard & Curran experts are devoted to their work which is reflected in exemplary project and program results for both public and private clients. Through a multidisciplinary approach, Woodard & Curran strives to solve clients’ technical and business problems, routinely finding unique and cost effective solutions for their clients.


 VHB
VHB