URBAN-X: Supporting New York Geospatial Startups

Curious to know about technology accelerators in New York State which are supporting  geospatial startups?  Look no further than Brooklyn-based URBAN-X built by MINI and Urban Us and operating since 2016 offering customer development, product development, and fundraising support to get selected startups off the ground into production and operation.   Geospatial is not the only type of startup  URBAN–X supports  (its actually much more)  with an existing resume of 37 firms in its portfolio covering technology solutions in the areas of real estate, transportation, energy, infrastructure, public health, and government among others.  The URBAN-X startup focuses on the urban tech environment developing hardware and software solutions which address key needs of city systems, as well as businesses and individuals.   The accelerator’s current cohort consists of seven  startups which each received $100,000 and five months of immersive mentorship.  This cohort was selected from over 500  applications this past November.

Every six months Urban-X selects up to 10 startups and invest $100,000 per company. The 20-week accelerator program also includes six on-site “experts-in-residence”.

Illustrative of the geospatial startups which have come through the accelerator is Citiesense.

Citiesense creates data-driven maps and dashboards that layers information about new permits, recent sales and property changes in urban areas, guiding real estate investors and other local stakeholders to support more informed business decisions.  Using interactive mapping and data visualization techniques, the company continues to focus on helping business districts better understand market demand and dynamics.   Citiesense uses Carto software to support their mapping applications and leverages data available in the NYC Open Data Portal.  Examples of their mapping apps are at the Downtown Brooklyn website and the Long Island City Partnership.  Citiesense is also referenced in a 816 New York article “3 map-based tech tools perfect for neighborhoods and housing authorities”.

I quickly developed an account on the Citiesense website and immediately started mapping various features around 347 East 105th Street. Out-of-the-box the application provides access to dozens of variables and features. This image shows recent 311 Reports, the NYC Street Tree Inventory, and the Commercial Overlay Districts layer.

Starting a tech company is never easy” notes Citiesense CEO Starling Childs. “I think this is particularly true of ‘Urban Tech’ startups. Joining URBAN-X was like adding the perfect final cofounder to our team right when we needed to begin testing our idea in the market. The people behind URBAN-X know the challenges urban tech companies face when thinking about solutions that consider some level of government and private sector collaboration. They understand the value of things like open data; how it supports public private sector collaboration and accelerates innovation in cities.”

Other URBAN-X supported startups in the location and navigation space include Revmax, Rentlogic, WearWorks and Swiftera.

Revmax:  Revmax develops fleet management and routing software for ride-hail vehicles. Its technology maximizes vehicle utilization by proactively forecasting rider demand based on historical data and future events. Revmax ensures that vehicles are in the optimal location to find rides quickly — increasing fleet revenue while reducing pollution and congestion.  According to  CEO Jonathan Weekley and chief operating officer Briggs Fraser,  cabs and Uber cars are empty some 50 percent of the time — highly inefficient for drivers trying to make the most of their time on the road. But the real target market for Revmax, Weekley says, is auto manufacturers such as GM and Ford, who are looking to get into ride-hailing. “They see declining car ownership, and they need to figure out a way to keep building cars and use that fleet more efficiently,” he said. Those manufacturers will have extra incentive to optimize routes, since they, not the drivers, will own the cars that are out on the road.

Rentlogic:  Rentlogic is a standards organization that measures and letter-grade rates the quality of multi-family residential buildings. Rentlogic ratings recognize building owners that invest time and energy in to operating great buildings, and helps connect them with residents trying to navigate a difficult marketplace.  Data underneath the application is harvested from the city’s 311 system.    Every week, roughly 4,000 complaints are initiated by renters about their landlords via calls to the #311 system. These complaints can include mold, heat and hot water issues, infestations, structural problems and more – all of which are used in the application.  It is Rentlogic’s aim to bring transparency and standardization to the residential real estate market.

WearWorks:  WearWorks is a New York-based haptics design company using sensory feedback systems to communicate information entirely via touch. Using vibration-based language, their product augments the senses of blind and visually impaired users through a non-visual interface, helping them to easily and effectively navigate to any destination.  Btw – WearWorks technology was worn/used by Simon Wheatcroft, a blind runner, in the 2017 New York City Marathon.

Swiftera: Swiftera’s business plan is to support citizens, businesses and municipalities in mobility, leisure and urban planning decisions. By providing access to fresh and actionable geospatial data at a competitive cost, the company leverages its novel urban-imagery technology to help customers analyze the past, explore the present and be the first to see the future.  While still in development, Swiftera anticipates delivering unprecedented urban imagery: available all-the-time, in real time.  For more information visit their website or contact them at info@swiftera.co. 

Summary:

URBAN-X provides an excellent opportunity for startups – including those in the geospatial space – to get started in a way which would otherwise be financially and logistically very difficult.    URBAN-X is itemized in a 2017 Dreamit article as one of the leading voices in the New York City “nascent urban tech movement”.  In the broader statewide context, the Empire State Development corporation supports several regional certified business incubators.  The New York State geospatial community is fortunate to have both the access and ability to work with companies such as URBAN-X.

Contact:

Micah Kotch
Managing Director
URBAN-X
Micah.Kotch@urban-x.com
Mobile: +1.646.645.0459
www.urban-x.com

Geospatial Business Spotlight: Ecology and Environment, Inc.

Company Name:                  Ecology and Environment, Inc.

Location:                               Lancaster, New York

Website:                                www.ene.com

Established:                         1970

Ecology and Environment, Inc., (E & E) is a global network of innovators and problem solvers, dedicated professionals, and industry leaders in scientific, engineering, and planning disciplines working together with our clients to develop technically sound, science-based solutions to the leading environmental challenges of our time. Founded in 1970 in Lancaster, NY, E & E also has offices in New York City and Albany, as well as locations across the national and internationally. E & E is a fully integrated environmental and engineering company delivering expertise across energy, site assessment and remediation, and restoration and resilience practice areas.

Geospatial Products and Services:

In October 2018, E & E’s IT/GIS group was rebranded as the Data Intelligence Group (DIG) to better reflect the capabilities and services of the department, and how that translates into identifying and integrating opportunities for innovation and streamlined data management into client projects. DIG includes experienced professional application developers and geospatial analysts who collaborate to add value for clients by providing tailored tools to collect and manage data efficiently, collate information quickly to meet aggressive schedules, accurately visualize project data, and support community engagement and project collaboration. E & E has worked on thousands of IT and GIS projects, and has built an extensive library of code that can be efficiently leveraged to complete successful new applications for clients quickly.

Specific E & E geospatial services include:

  • Custom Application development (public and private websites)
  • Needs Assessment, System Design, Development, Implementation and Maintenance
  • Database Development and Data Management
  • Data Visualizations (e.g., Tableau, ArcGIS Insights)
  • Field Data Collection and Management (GPS, Mobile Mapping)
  • GPS/GNSS Support
  • Mobile map viewers and custom mobile application development
  • 3D Visualization and Modeling
  • Photo Simulations
  • Software and system integration
  • Website design, hosting, and maintenance
  • Document Management
  • Satellite Image Processing
  • Database design, interpretation, and migration
  • Training and Technology transfer
  • Web-integrated Monitoring of Telemetered Data Feeds
  • Unmanned Aerial System (UAS) Site Survey
  • Augmented and Virtual Reality
  • GIS Process and Workflow Analysis
  • GIS Training
  • Desktop Geospatial Services (e.g., Cartography/Report quality mapping, Geospatial Analysis, Spatial interpolation and Modeling)
  • Process Automation

Mapping Offshore Wind for NYSERDA

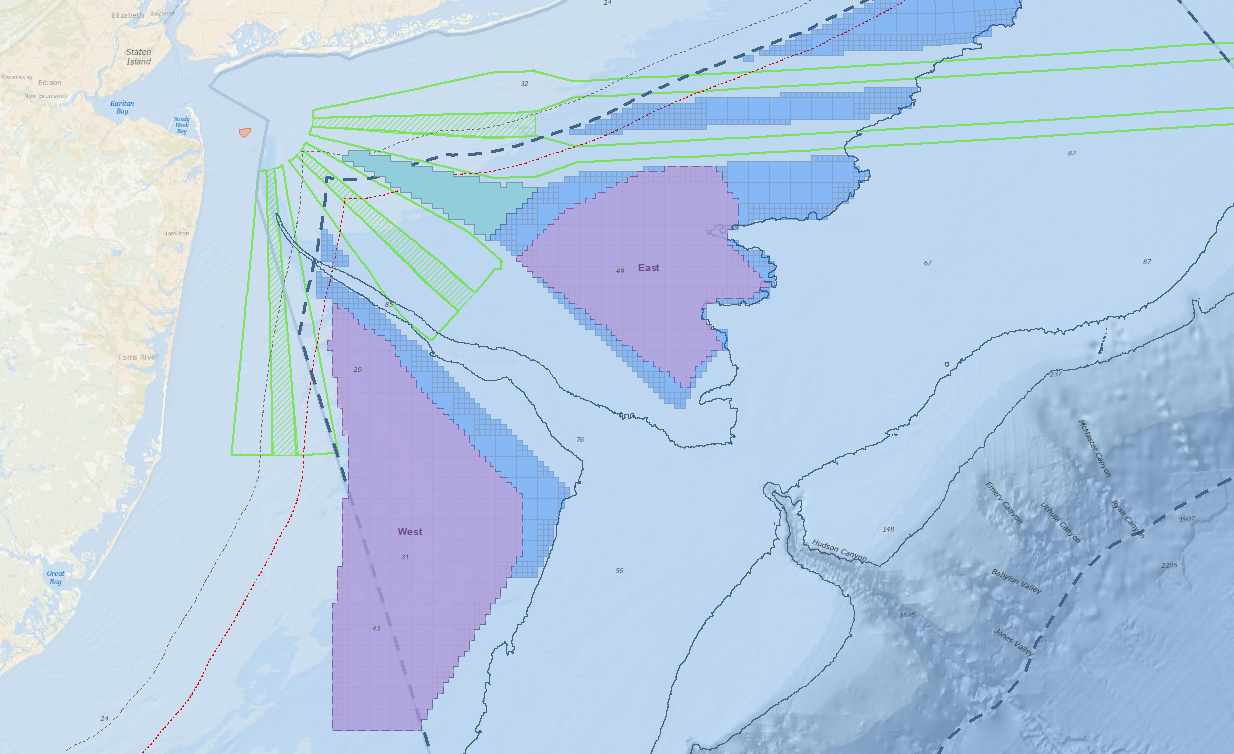
To support New York State’s commitment under the Clean Energy Standard, which requires that 50 percent of the State’s electricity come from renewable energy sources, E & E worked closely with the New York State Energy and Research Development Authority (NYSERDA) to contribute to the first-of-its-kind New York State Offshore Wind Master Plan. The plan lays out a path for development of 2.4 gigawatts of offshore wind – enough to power 1.2 million homes. Geospatial tasks associated with this project included:

  • Development of an interactive web mapping portal for team and public engagement
  • Offshore and near-shore data acquisition
  • Geostatistics of potential offshore wind development areas
  • Development of detailed map figures for published reports

Areas for consideration and indicative wind energy areas were one result of the GIS analysis performed with NYSERDA.   NYSERDA’s findings were presented to the Bureau of Ocean Energy Management to assist in designating official wind energy lease areas.

E & E also developed GIS modeling that ranked sensitivity of various offshore species receptor groups to the stressors of building and operating a wind farm over different times of the year. Geospatial data and analysis results were used to facilitate identification of areas for consideration for offshore wind development and will inform future developers, potentially reducing the uncertainty and costs of their proposals.  Download a copy of the actual Offshore Wind Master Plan.

Geospatial Services for Erie County Water Authority

E & E is proud to have worked with the Erie County Water Authority (ECWA) since 2003, helping them integrate and leverage increasingly robust geospatial technologies to benefit their customers and their bottom line. E & E’s GIS support has been critical to their day-to-day operations. E & E GIS support has provided:

  • Field crew mobile access to utility information though maps and data,
  • Analysis of water main leaks to target most-effective replacements, facilitating smart capital improvement project planning, and
  • Transportation logistical support by optimizing service calls to save on transportation and labor costs.

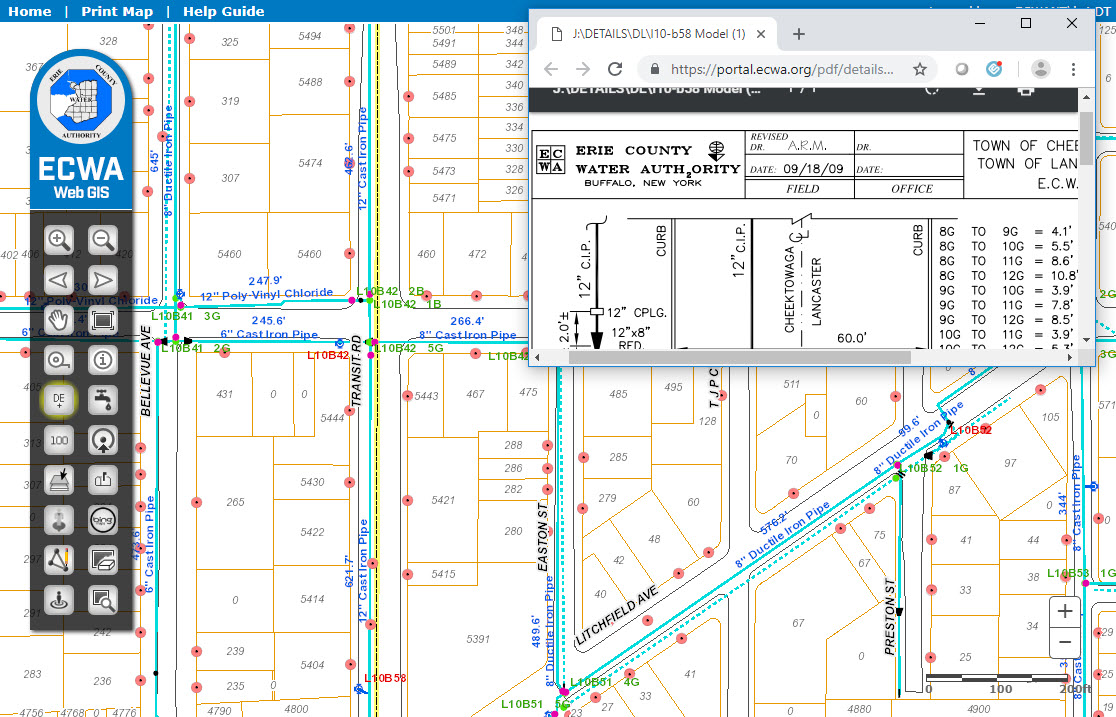
GIS has played a significant role in the location and management of assets at ECWA for the past 25 years. Pictured here is a web mapping application for use in the office, with field laptops, and mobile devices, that assists with locating and identifying assets and related information.

Geospatial Flows for Energy Infrastructure Developers

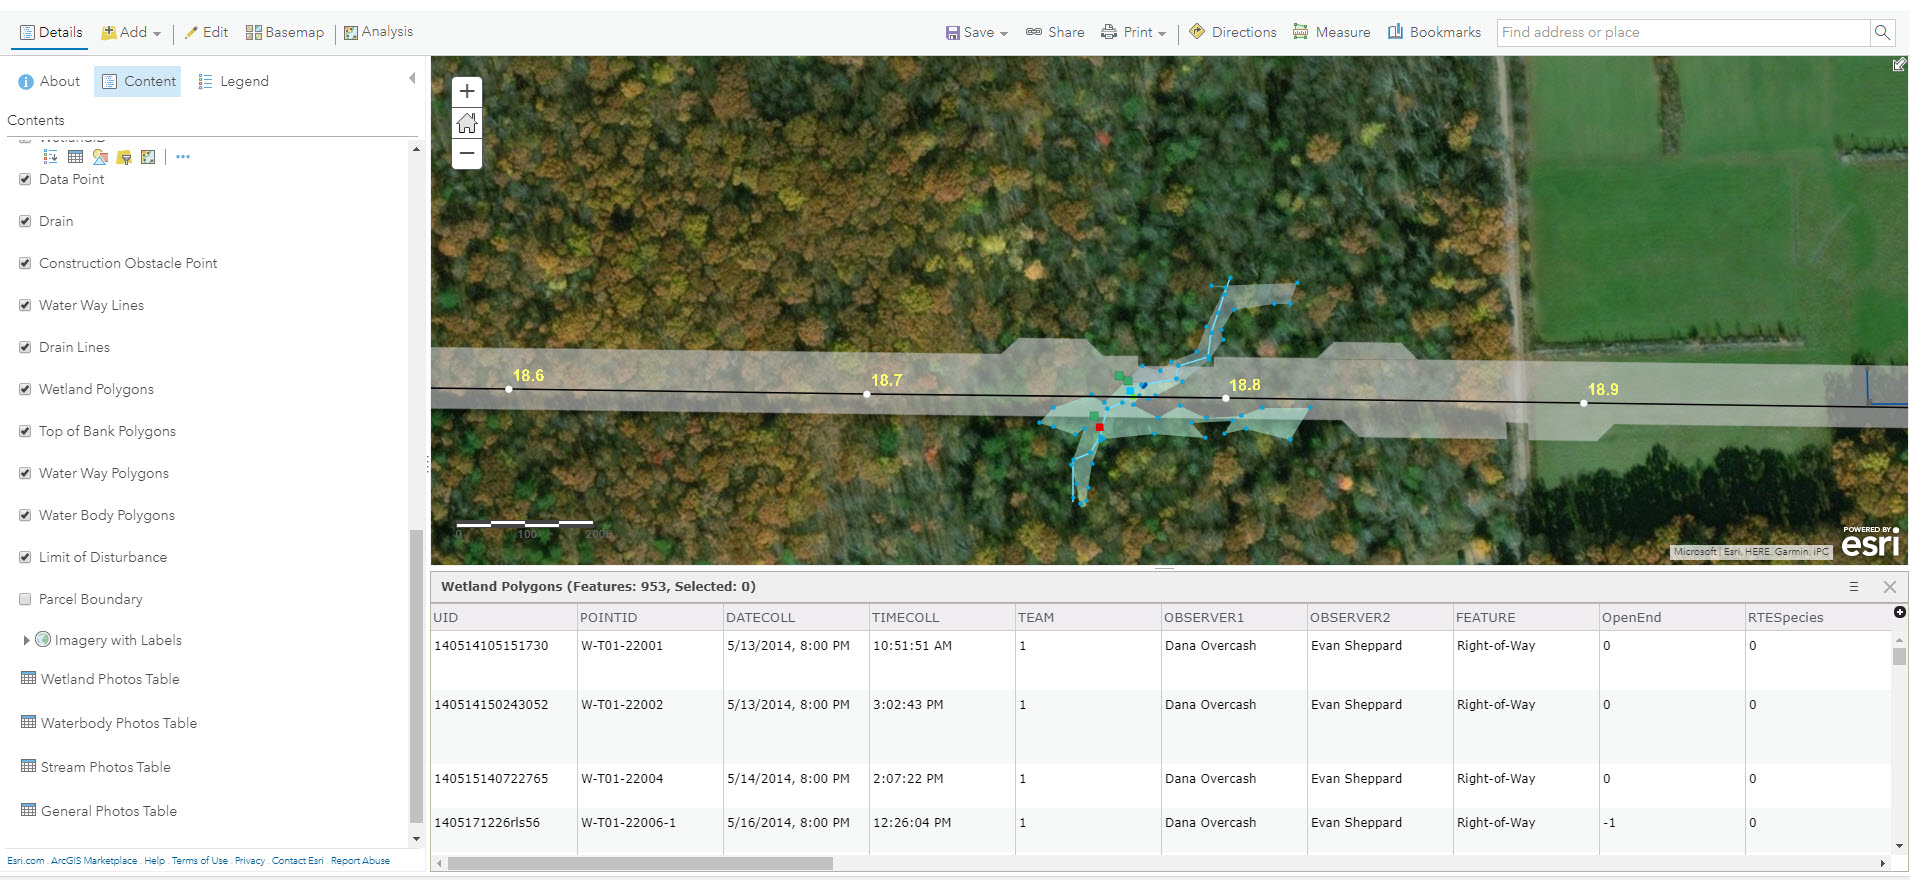
For the Williams Transco 197-mile Atlantic Sunrise project, E & E set up field data workflows for a large environmental survey. In communication with E & E biologists, developers, and the client, E & E developed a customized workflow to meet diverse needs. Solutions included development of a customized ArcPad (Trimble) and ESRI Collector Application, web integration, and desktop automation tools.

ESRI Collector and the ArcGIS Online platform played an important role in the Atlantic Sunrise field data collection process. Data was integrated in near real-time and was made immediately available to project managers, engineers, and decision makers.


Working Smarter with E-Datasheets

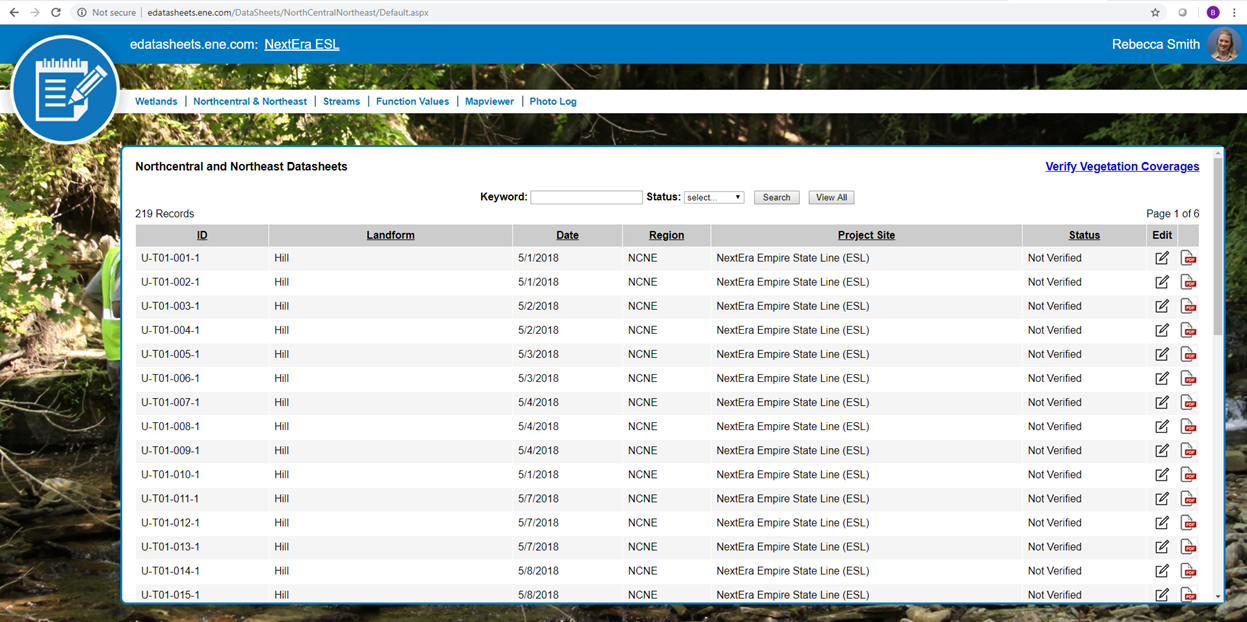
E & E has ditched paper datasheets and is going green! We developed custom “smart forms” that utilize drop-down menus, radio buttons, and behind-the-scenes calculations to speed up the data collection process. These electronic datasheets save time and improve data quality.  Data is stored in an enterprise database and can be queried and exported to PDF format for report submittal.  E-Datasheets have been used with a wide variety of clients.

E & E has developed electronic datasheets to save time, improve data quality, and reduce waste.

Contact:

Greg Coniglio, PMP, GISP
Ecology and Environment
368 Pleasant View Drive
Lancaster, New York 14086
gconiglio@ene.com

Wayfinding: Geospatial Goes Indoors with Connexient

As GIS and mapping technologies evolved through the later part of the 20th century focusing mainly on the physical(outdoor)  landscape, the digital mapping of the  built/interior environment continued to focus on the use of AutoCAD/Revit and related CAD technologies.  With exceptions, there were two definitive geographic mapping camps:  Geographic Information Systems (GIS) software vs. Computer Aided Design (CAD) software.   One or the other.  And with little integration of both.

As both technologies matured, integration between the two computing environments became more common and the lines of division blurred.  New technologies including, but not limited to Global Positioning Systems (GPS), Laser Scanning, Building Information Modeling (BIM), and drones, as well as advancements in 3D modeling and increased desktop and internet capacity aided to the continued integration of the software platforms. GIS and BIM Integration Will Transform Infrastructure Design and Construction is a very recent and quick read from Autodesk charting the path of this flourishing market.

Fast forward to 2018 and the evolution of indoor wayfinding which leverages many of the components of these same outdoor and indoor mapping concepts.   Based on a similar spatial data model, Wayfinding applications are now found in a wide range of public spaces, educational and industrial campuses, entertainment and athletic venues, buildings, and healthcare facilities.  Offering indoor maps for handheld mobile devices is becoming more and more common, as are digital information kiosk systems in office complex lobbies, and as part of web mapping applications. (It is often recognized that The Americans with Disabilities Act of 1990 (ADA) represented a milestone and was instrumental in helping to make spaces universally accessible and improving wayfinding for all individuals.)

Connexient

New York City-based Connexient was formed in June 2012 with the vision that indoor GPS and navigation will become as widespread inside as it is outside.

With over 60 licensed hospital client sites and a total square footage over 70 million square feet mapped, Connexient is a market leader in healthcare in providing  smart phone based turn-by-turn indoor navigation and all screens digital wayfinding solutions.   Leveraging significant breakthroughs in the ability to implement low cost, navigation quality indoor positioning, users can now expect the same kind of functionality –  intuitive, reliable and accurate maps, directions and turn-by-turn navigation which is commonly available from outdoor world mapping and navigational companies such as Google, Apple and Waze.    The same user experience can be available via a mobile app for any large, complex indoor facility or campus that they enter.  Today, these capabilities are highlighted in Connexient’s flagship product MediNavTM.

Selected MediNav functions include:

  • Multiple levels of zoom and detail
  • 5D visualization and 360 degrees of freedom of camera control
  • Detailed routing network and intelligent routing
  • Turn-by-turn instructions
  • Visual landmarks (signage) to provide locational reference
  • Visual and audio turn prompts
  • Off-route notification & route recalculation
  • “Balcony view” route visualization – what is coming next
  • 1 to 2 meter accuracy
  • Dynamic refresh of user position
  • Parking Planner, Find my Car and Meet Me
    Continue reading

10+ Questions: Eileen Allen

Eileen Allen is a familiar and respected face across the New York State GIS landscape.  First a foremost an instructor at SUNY Plattsburgh, she has instructed and mentored hundreds of students who are now part of the statewide geospatial fabric.  And in her spare time she has participated and contributed to numerous statewide GIS advisory committees over the past 20 years.  Always upbeat and a pleasure to work with, she is most certainly a first ballot lock for the GIS wing at the Hall of Fame in Cooperstown.  

eSpatiallyNewYork:  How long have you been at SUNY Plattsburgh?

Allen:  I was an undergraduate student at Plattsburgh State from 1973-1977.  In August 1984, I was hired to help finish a remote sensing research grant mapping historical beaver locations in the Adirondacks.  I’ve been here ever since.

eSpatiallyNewYork:  Where are you originally from and tell us about your journey that led to Plattsburgh.

Allen:  Both my husband and I grew up in Plattsburgh.  Fortunately there were state and federal programs to help me get a college education.  After college at SUNY Plattsburgh, I went to McGill and worked on a Master’s in physical geography.  Everything seemed to go wrong with my advisor and the research.  It was hard but necessary to leave there.   Fortunately, I could use my McGill credits and finish a Master’s program in Natural Resources at SUNY Plattsburgh while I worked on research projects.  I thought about getting my PhD but I just didn’t end up going in that direction.   Besides, I liked the research projects I was working on too much!

eSpatiallyNewYork:  You’ve been associated with the GIS program at Plattsburgh since its origin.  How did it get started?  Who was involved?

Allen:  My involvement with teaching GIS developed out of research projects and the need to train student workers. Dr. Richard Lamb was instrumental in developing the GIS courses and a minor in addition to his planning courses and practice.  He started the GIS course in the late-1990s and by the early-2000s we would take turns teaching the Introduction to GIS class.  I took over all the GIS classes when he retired and the Remote Sensing courses when Dr. Donald Bogucki retired.

But there is more, because so many chance occurrences determine our path.  Also, it has been noted that many more women are in GIS than in other natural sciences.  When taking college classes, I was often one of a very few or the only female.  Many people think that because GIS is so collaborative, women often gravitate towards it.  This is certainly true for me.

As an undergraduate, I was interested in many things but was unsure what I would major in and tried out several paths.  I needed a Social Science course and Physical Geography was on the list, so I took it.  Drs. Donald Bogucki (Geography) and Gerhard Gruendling (Biology) were working on a pilot project mapping wetlands and demonstrated this in their classes.  The grant was to investigate the use of remote sensing to estimate the impact of regulating the Richelieu River (the outflow of Lake Champlain, NY-VT) because of flooding concerns in Quebec.  Dr. Bogucki showed some color infrared imagery of wetlands in Physical Geography class and I was totally flabbergasted!  I absolutely had to be involved with the project!  It took several days for me to get the courage up to ask if I could be part of the research.  It so happened that they needed someone to use a transit to establish ground control.  I had been working with my father, a land surveyor, for many years and was enlisted by Dr. Bogucki to help set out targets and map them.

In the early 1970’s, it was very unusual for an ecologist and a geomorphologist to work together.  That was part of the attraction, though, where many of my interests could be combined. By chance, at about the same time, the Environmental Science Program was started at SUNY Plattsburgh and I had found my academic home.  I continued to be part of the project mapping Lake Champlain wetlands using custom flown 70-mm imagery until my graduation.
Continue reading

Shared Services: Opportunities for Local Government GIS

More than a couple years ago, Linda Rockwood, who at the time was running Mohawk Valley GIS, mentioned to the NYS GIS community that she was at a local meet and greet with regional elected officials and mentioned the “GIS” word to one of NYS’s congressional representatives in attendance.  To her amazement – and dismay –  she found out the representative had a very limited awareness or understanding of GIS.

Linda’s encounter certainly wasn’t the first of its kind and I’m sure there have been numerous similar incidents in our respective corners of the state since then.  GISers gingerly starting a conversation on the broad benefits and applications of geospatial technology to government and elected officials – only to see the focus wander quickly. Maybe two or three minutes into the discussion when comparisons to Google Maps normally kick-in and/or there is eye contact with the next constituent and thinking moves to that conversation.

Unfortunately, the message – and the collective mission – seems to continue to get lost and there is recent anecdotal evidence to suggest there is still a long way to go in context of recognizing and embracing geospatial technology in NYS local governments (county, city, town, and village) as part of an increasingly important government program area:  Shared Services.

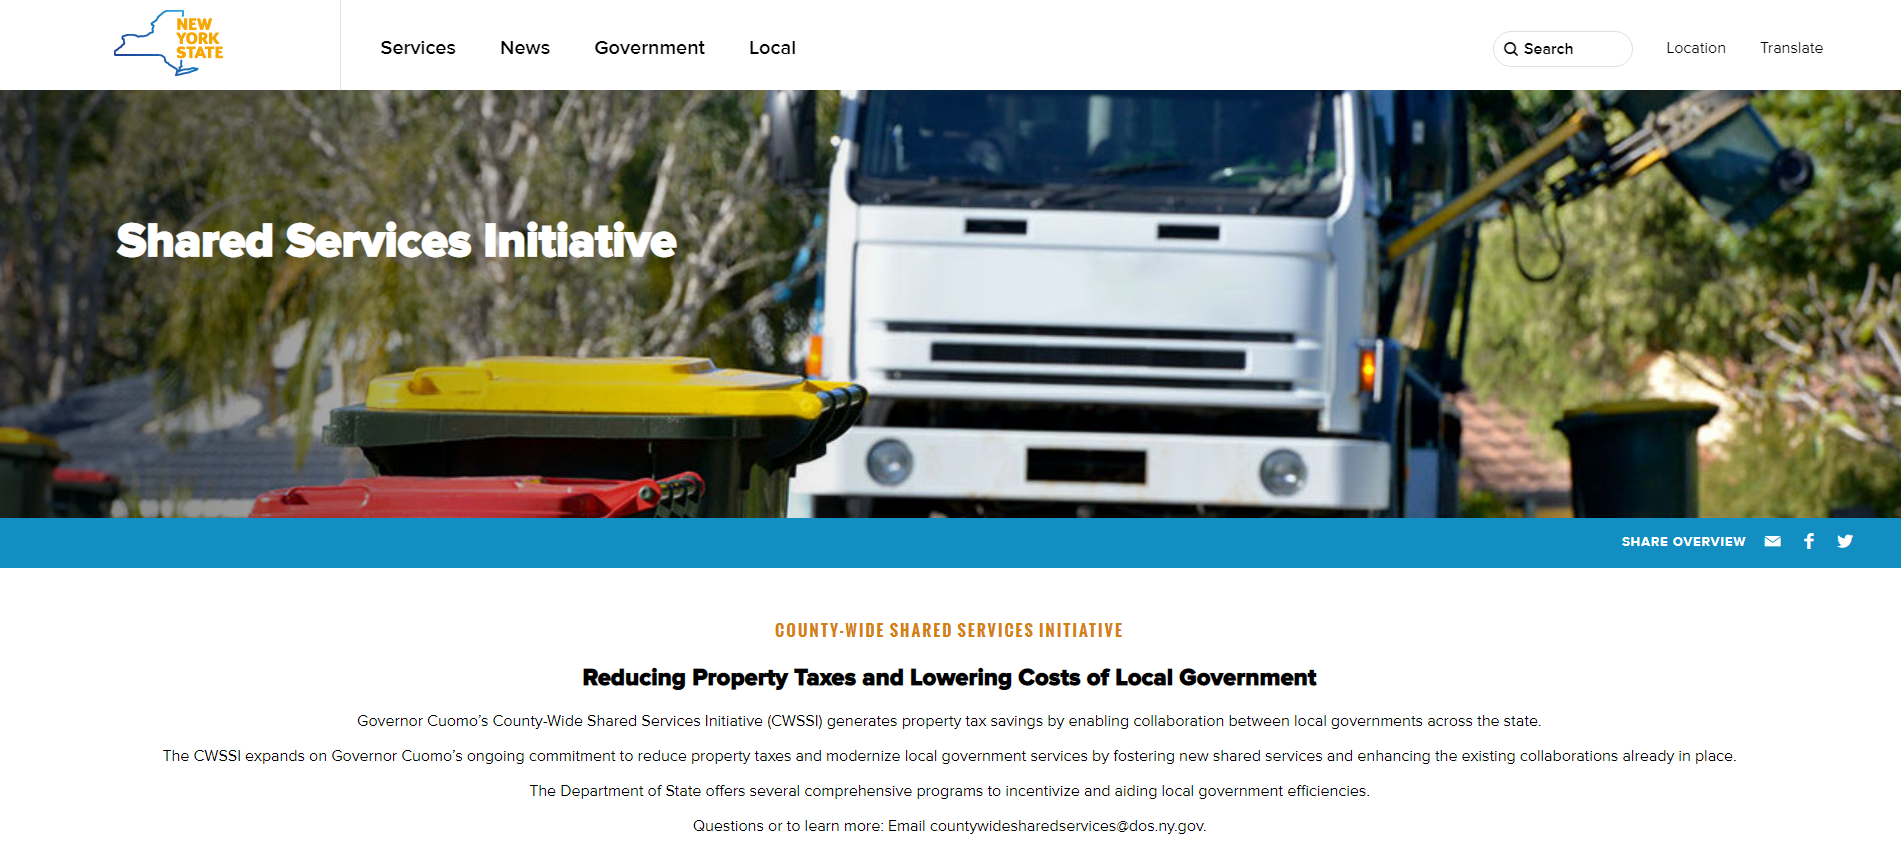
New York State Shared Services Program

Those working throughout the local government ranks should be on some level familiar with the shared services buzzword.  It’s the talk among government officials and for legitimately good reasons.  Look no further than Governor Cuomo’s commitment of $225 million in the FY 2019 Executive Budget to continue the County-Wide Shared Services Initiatives (CWSSI). The $225 serves as matching funds for a one-time match for actual and demonstrable first-year savings achieved by the Shared Services Panels through new actions implemented during calendar year 2018.  School districts, boards of cooperative services (BOCES), fire districts, fire protection districts, and special improvement districts have the option to participate as well.    The current shared services initiative augments the existing NYS Department of State Local Government Efficiency (LGe) Program – which by the way formerly known as the Shared Municipal Services Incentives program –  “provides technical assistance and competitive grants to local governments for the development of projects that will achieve savings and improve municipal efficiency through shared services, cooperative agreements, mergers, consolidations and dissolutions.”

New York State Shared Services Initiative web page

There are many recognized barriers to implementing shared services across NYS governments though as the concept evolves, governments continue to try and find ways to consolidate services in specific areas such as municipal justices, zoning and code enforcement, construction/building/maintenance inspections, and in the establishment of health care consortiums to name only a few.   That said, it’s worthy to note the limited number of GIS-centric shared services proposals submitted by both the New York State Association of Counties (NYSAC) and  New York Council of Mayors (NYCOM). Specifically:
Continue reading

Watershed Agricultural Council: Geospatial in Upstate NYC Watershed Lands

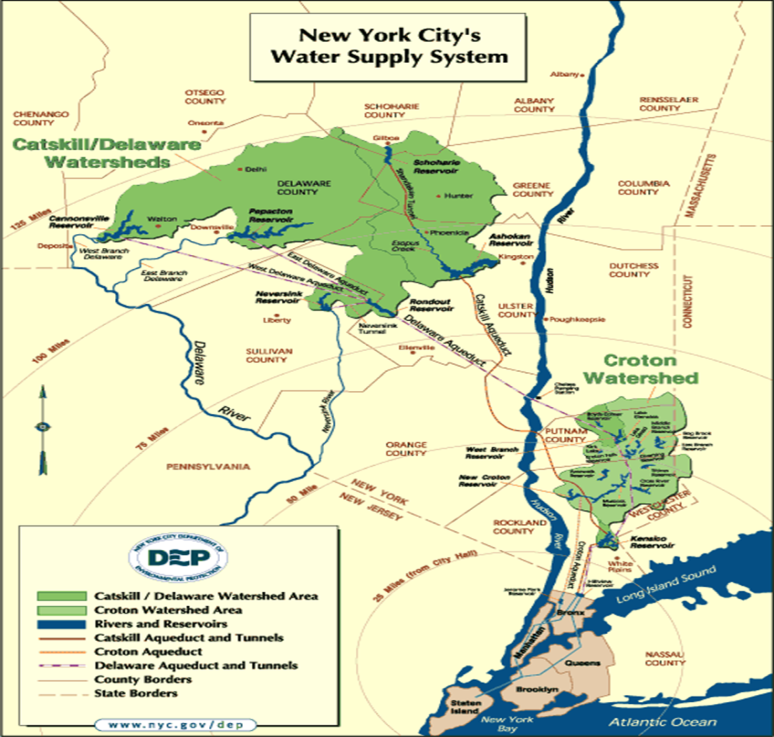
The New York City Watershed is the largest unfiltered surface water supply system in the United States. Every day this region in upstate New York’s Catskill Mountains provides more than a billion gallons of clean drinking water to the more than nine million people residing in New York City and upstate counties. The system includes 19 reservoirs, three controlled lakes, and a watershed that spans more than a million acres. In some cases, water travels more than a hundred miles to reach New York City.  While other large US cities typically own the land that drains into their reservoirs – New York City’s lands are unique:  Nearly 75 percent of the watershed lands are privately owned with NYC and the State of New York owning a mixture of the remaining lands.  Consequently, New York’s water quality depends in large part on the actions of the 30,000 landowners who live, work, and recreate on watershed lands.  Overall, nearly 70% of the watersheds are forested with the remaining lands in predominately agricultural use.

The Watershed Agricultural Council (WAC) is one of two primary watershed partners (Catskill Watershed Corporation being the other) locally-based not-for-profit corporations specifically created to assist New York City Department of Environmental Protection (NYCDEP) with the administration and implementation of watershed protection and economic development programs in its water supply lands. The WAC is involved primarily with natural resource and land conservation programs, whereas the Catskill Watershed Corporation primarily oversees community infrastructure and economic development programs. Many other watershed partners serve in various capacities, such as oversight, advice, public education, and communication.

WAC Geospatial

WAC GIS and geospatial applications are built to support four major program areas within the NYC watershed lands:  Forestry, Agriculture, Conservation Easements, and Economic Viability.    Managing these applications and infrastructure in their three offices [(Walton,  Hamden , and Yorktown (East of Hudson)]  is the responsibility of Nadine Trahan who joined WAC three years ago after having attended both undergraduate and graduate school in New Zealand.  Nadine developed and maintains a ESRI Geodatabase to support enterprise geospatial applications.  She notes wireless connectivity and high speed internet connectivity can be a “challenge” in the rural Catskills which plays into the deployment of the enterprise applications.  Given the connectivity issues, Nadine uses ArcGIS Portal to design and download applications to mobile devices for in-field deployment:  Data collected remotely is synchronized with the enterprise geodatabase when field devices are connected to the network upon return to the office.  She currently supports approximately 40 users involving everything from high-end client software apps to browser-based applications for the more casual user.  This later category of user being staff which use an internal web map to edit point locations of Pure Catskills members as part of the Economic Viability focus.
Continue reading

Using Smart Phone Metrics for Carrier Network Design

I really did start a conversation with Brian Webster at Wireless Mapping regarding an article for eSpatiallyNewYork.  It was my intent to begin a discussion on the use of geospatial technology in the  telecommunications and wireless engineering space.  Turns out the discussion ended up aspiring Brian to author a detailed article for his own blog which provides much more detail clarity than I could ever produce.   Which makes it easy for me – I’m going to send you to his post.

An initial focus of his company was in mapping of broadband internet availability. Using GIS technology, the company provides clients with maps showing broadband internet availability down to the census block level on a local, statewide or national basis.  These analysis are further quantified by the type of services available, number of occupied households in each census block, and market penetration rate. For those businesses shifting  to an internet based marketing program such as social networks, knowledge of where the broadband customers are located is a key factor to future successful marketing campaigns.

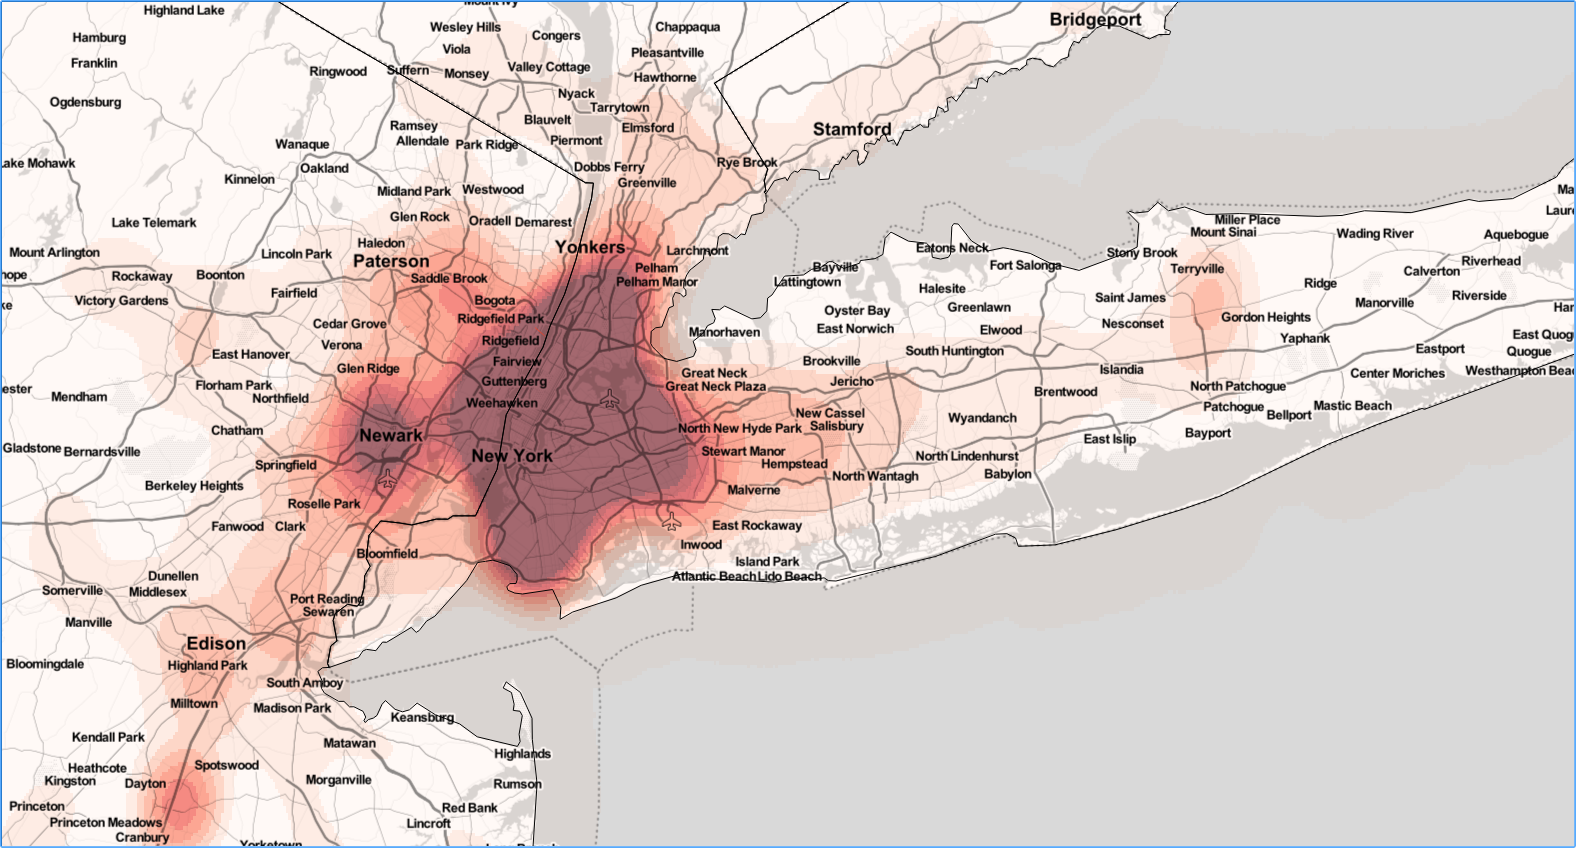
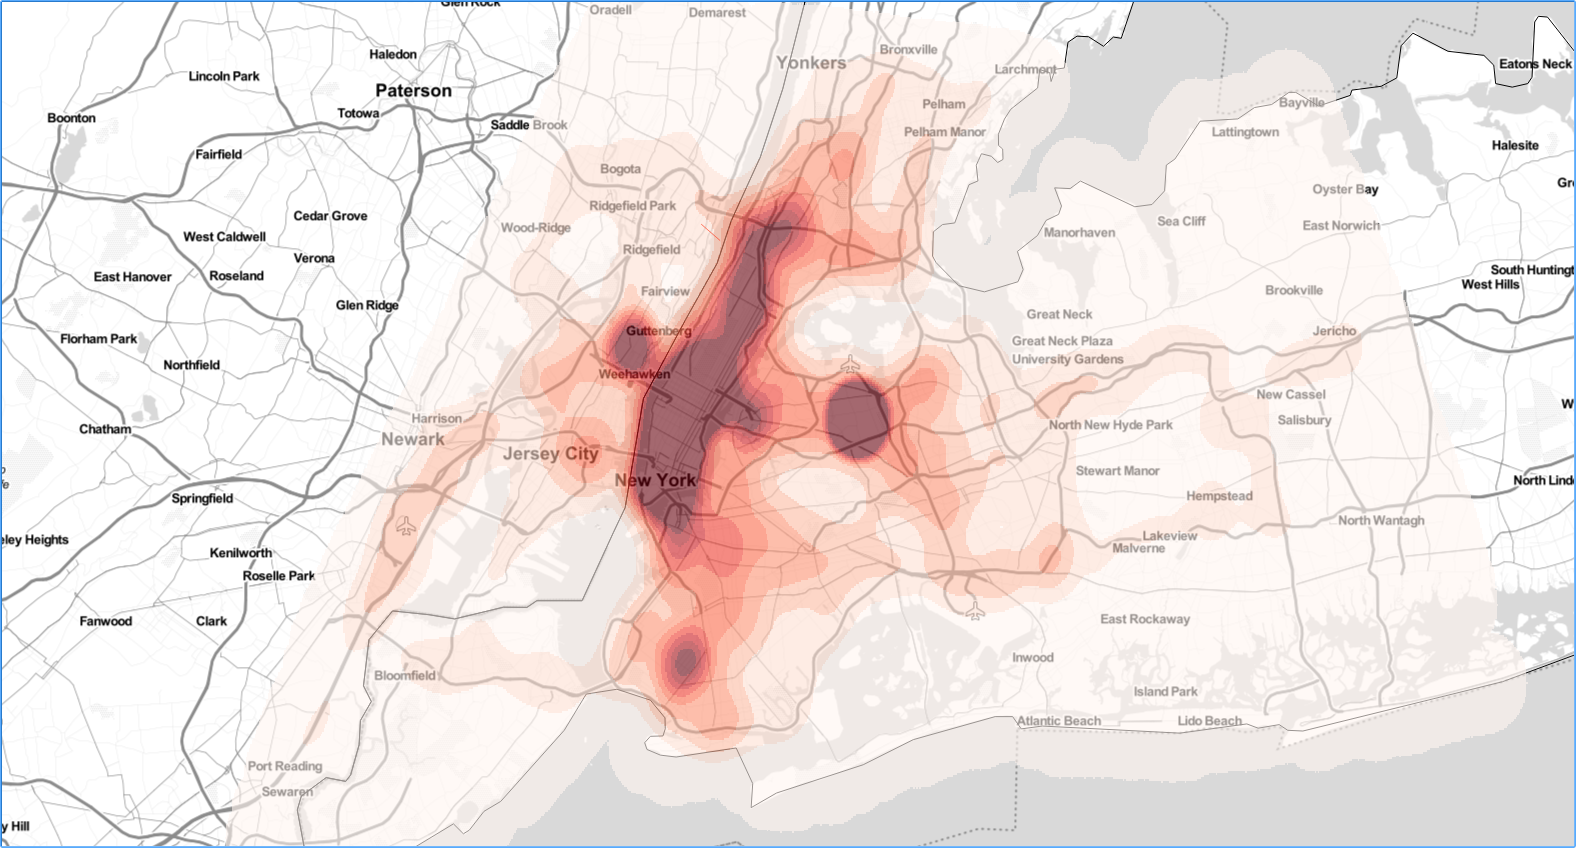
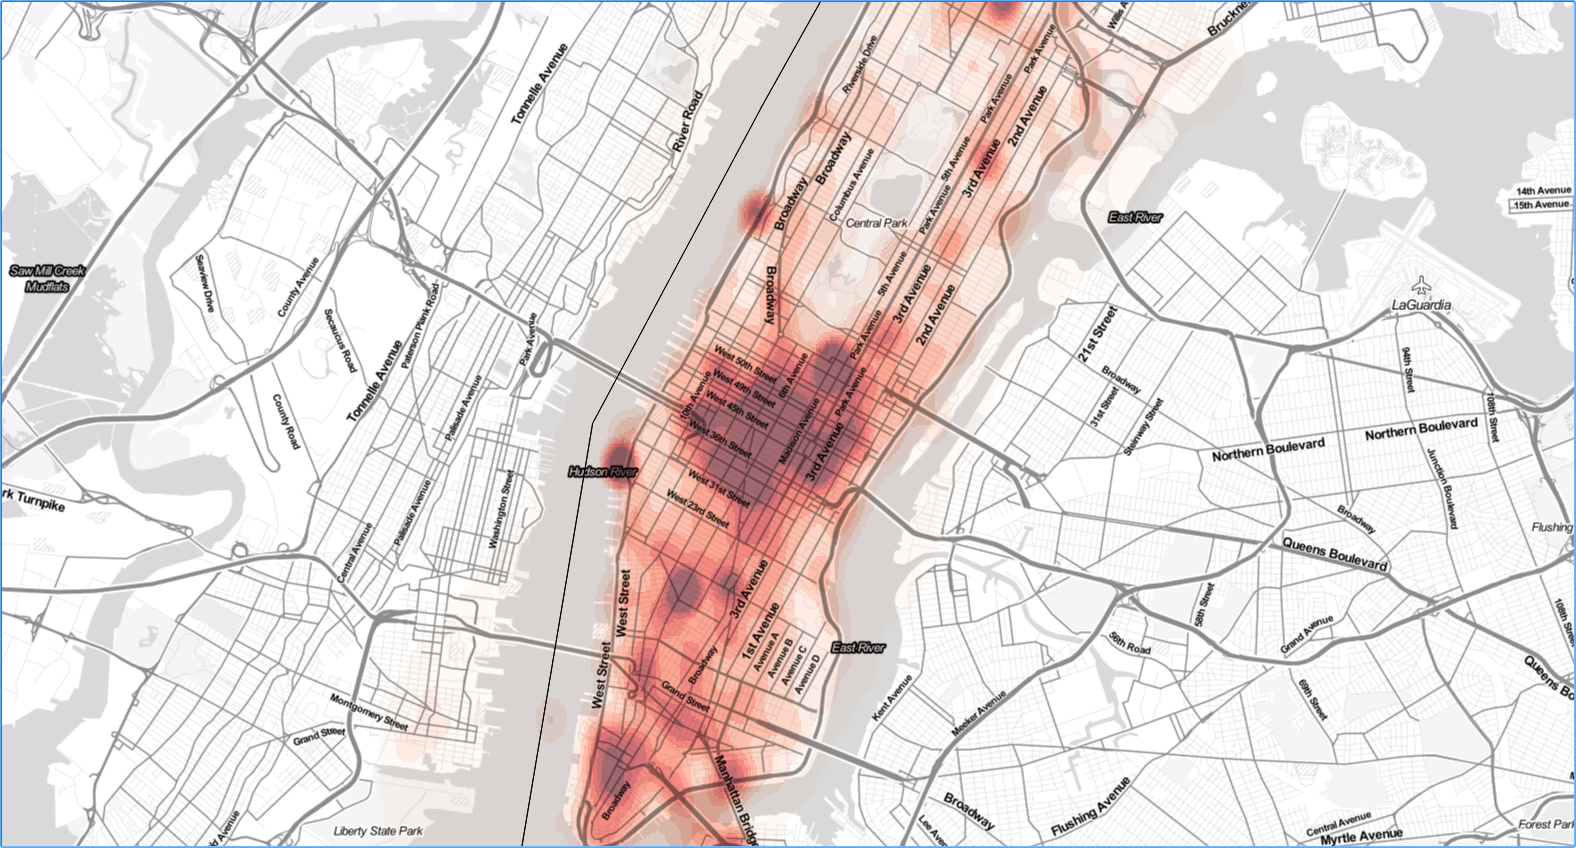
His more recent work focuses on a paradigm shift of designing carrier networks based on mobile metrics generated from smart phones vs. traditional fixed metrics such as demographics and/or traffic counts tied to specific roadways, among others.  Today’s smart phone applications gather significant location based information which can be compiled and used in such a way to be able to show high and low “user” traffic areas. Taking this information and converting it to easily understandable formats such as heat maps, it is easier to visualize society’s mobility, where the heavy traffic areas are, where people work, and where they spend their free time. Smart phones use show the more heavily used portions of existing mobile carrier networks and moving forward such data can be used to aid in planning new carrier networks – particularly in the emerging 5G arena.


This series of maps, generated by Wireless Mapping, show cell phone data for the greater New York metro area (nearly 10 years of data through December 2017) changing in granularity when looking at more focused regions such as the five boroughs and then just Manhattan.  The smallest level of detail show where network capacity needs to be addressed and will be the areas where carriers will be targeting first for 5G deployments.

For a more detailed discussion on the use of smart phone data use and GIS and their potential use in designing the 5G carrier networks, visit Brian’s July 12th post.  You can also follow his other work in areas of radio frequency (RF) system design, business analytics, mapping, data mining, telecommunications and wireless engineering  by using links available as part of the blog post.


Geospatial Business Spotlight: CycloMedia Technology, Inc.

Company Name:       CycloMedia Technology Inc.

Location:                   Berkeley, CA

Website:                    www.cyclomedia.com

Employees:               120 Globally

Established:              1981

A privately held company, founded in the Netherlands over thirty years ago, CycloMedia Technology, Inc. is a rapidly expanding international company with staff in Syracuse, New York.  Annually, CycloMedia captures and processes approximately 160,000 linear miles of 360° panoramic street level images, representing over 48 million recordings per year. The company holds five key image capture technology patents and specializes in the local government market. Currently the company has projects with the cities of New York, Philadelphia, Washington DC, as well as  Franklin County, OH (Columbus), Dakota County, MN (Minneapolis) and Jefferson County, KY (Louisville) to name a few.

Specific benefits of Cyclomedia technology include:

  • GeoCyclorama images and basemaps are geographically linked
  • Provides ability to conduct searches with address, postal code or coordinates
  • Integrate with interprise applications and work processes using the GlobeSpotter API
  • Determine the location and dimensions of objects in GeoCyclorama imagery
  • Ability to create precise point, line and area measurements
  • Overlay enterprise spatial data on the GeoCyclorama images
  • Supports Open Geospatial Consortium (OGC) standards
  • Integrate data in formats such as WFS, WMS, Shapefile and GML
  • Create reports and bookmark locations of interest
  • Users can save and utilize GeoCyclorama images for reporting and analysis functions.

Geospatial Products and Services:

A.  GlobeSpotter

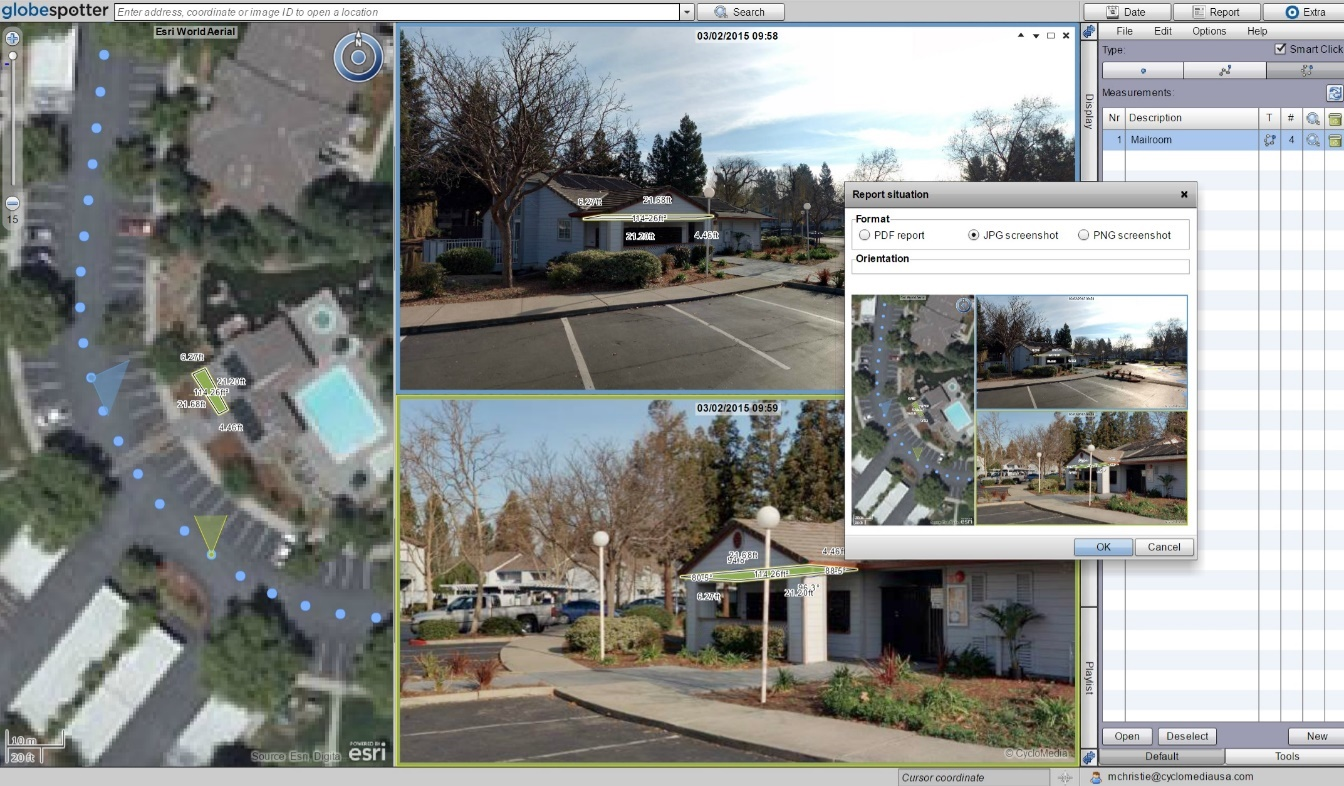
GlobeSpotter (web) is an interactive web-based application that provides cloud access to GeoCyclorama imagery and tools for measuring, collecting data, and reporting.  The software and data are directly available from CycloMedia’s software as a service (SaaS) model.

GlobeSpotter (web) screenshot with area measurement and reporting window 

GlobeSpotter for ArcGIS Desktop  provides visualization, measurement and overlay tools within the ArcMap or ArcGIS Pro allowing a user to fully leverage the power of GeoCycloramas within the ArcGIS client environment.  Specific capabilities include:

    • Open GeoCyclorama imagery from a recording point layer added to the map
    • View one or multiple GeoCyclorama images
    • Measure on GeoCyclorama images
    • Use the native editing capabilities of ArcGIS to collect features in 2D or 3D
    • Ability to save and utilize GeoCyclorama images for reporting and analysis functions.

Continue reading

On the Water: Protecting New York Waterbodies from Invasive Species

Background

Since 2007, the New York Natural Heritage Program (NYNHP), through a contract with the NYS Department of Environmental Conservation, has been managing the statewide administration of the iMapInvasives program. The program is a GIS-based, online, all-taxa invasive species database and mapping tool which is used across the state for the collection, distribution, and analysis of invasive species observation, survey, assessment, and treatment data.  Use of the program by individuals and partnering organizations helps coordinate the early detection of invasive species and rapid response efforts though email alerts and other outreach efforts. The application facilitates communication among individuals, partners, and organizations working to protect the natural and agricultural resources of NY state from the impacts of invasive species.

Statewide invasive species management is implemented through eight PRISMs (Partnerships for Regional Invasive Species Management). The PRISMs have many responsibilities, such as to plan regional management, develop early detection and intervention plans, coordinate control and eradication projects, educate, coordinate with partners and other PRISMS, recruit and train volunteers, and support research efforts.

Watercraft Inspection Steward Programs (aka Boat Launch Stewards Program)

Recreational boating has been identified as a key pathway in the spread of aquatic invasive species (AIS) across New York State. The Aquatic Invasive Species Management Plan  was adopted by New York State DEC in July 2015 to clearly outline the AIS strategies utilized throughout the state. New York is particularly vulnerable to AIS due to the easy access that ocean-going vessels have to the Great Lakes and the ease by which these species can spread via the state’s canal system. Aquatic invasive species can also find their way into New York State through the live animal, nursery, and landscape trades. Once in New York State, AIS are primarily spread by humans, either purposely though their direct release, or incidentally through recreational boating and angling. Note that aquatic invasives can be transported via “other” recreational watercraft such as windsurfers, kayaks, and canoes, too.

Watercraft inspection and associated steward programs are critical components in protecting aquatic ecosystems and water quality by preventing and limiting the spread of aquatic invasive species among waterbodies in New York State and neighboring states and provinces. Many organizations across NY have had boat launch stewards positioned at boat launches for years. The boat launch stewards gather information about boater’s knowledge of invasive species and check watercraft for fragments of invasive organisms. Tracking reports of different species and how frequently different locations are used by water recreationists is important for prioritizing outreach and control efforts and for choosing boat launches that allow stewards to reach the most recreationists and reduce risk of introduction at high use launches.

Continue reading

10 Questions: Bob Wills

Bob Wills, Senior GIS Project Coordinator, Dutchess County Department of Planning and Development has been a mainstay with the Dutchess County GIS program for over twenty years and involved in many Lower Hudson River Valley geospatial projects.  Widely recognized across the state, Dutchess County GIS exemplifies a federated style of GIS development across the enterprise by supporting and building GIS capacity in different program areas. While the geospatial concepts are very similar, though very different, Bob came into the GIS space with an architectural background. He is a Registered Architect in the State of New York and board Certified by the National Council of Architectural Registration Boards (NCARB). I recently caught up with him to talk about the Dutchess County GIS program, it”s history, and current efforts.

Continue reading