Geospatial Business Spotlight: Adirondack Research

Location:                      Saranac Lake, New York

Website:                       https://www.adkres.org

Employees:                  3 Full-Time / 6 Seasonal

Established:                 2012

The Company
Adirondack Research is a small business located in Saranac Lake which focuses on building expert-backed and science based geospatial solutions.  Currently the firm’s primary focus is on applications and work involving invasive species, climate change, and socio-economics.  Adirondack Research staff includes GIS specialists, web developers, and field technicians and the company produces a retail line of recreation and way-finding maps under the brand Green Goat Maps.

Geospatial software used inside the company  includes ArcGIS Pro on the desktop and ArcGIS Online for a variety of web maps and viewers.  Field data collection is also supported by ESRI tools including Collector and Survey123.  For hardcopy map production both, Adobe Illustrator and Adobe InDesign are used.

Adirondack Research’s Director is Ezra Schwartzberg who received his undergraduate degree from SUNY College of Environmental Science and Forestry (ESF),  graduate degree from University of Kentucky, a doctorate in Entomology  from Penn State and additional post-doctorate work at the University of Wisconsin.

To date,  Adirondack Research clients include the U.S. Forest Service, Adirondack Council, Lake Placid Land Conservancy, Food and Agriculture Organization of the United Nations, U.S. Department of Agriculture, ADK Action, the New York State Department of Environmental Conservation which it has contracted for several invasive species projects, and others.   While most of Adirondack Research’s work is focused in New York State and across New England, their work has taken the firm to Lebanon as well as assisting to the development of a science curriculum for elementary schools in China.

Geospatial Products and Services

  • Environmental mapping using geographic information systems (GIS)
  • Biological inventories
  • Field experiment logistics
  • Ecosystem services assessment
  • Long-term ecosystem monitoring
  • Invasive pest management planning and analysis
  • Comprehensive management plans
  • Public outreach and stakeholder engagement
  • Citizen science
  • Grant writing
  • Expert witness testimony

Schwartzberg uses research expertise to guide processes, including program design, data analysis and project evaluation.  By combining ecological research with print and digital media, Adirondack Research is able to communicate science to help our clients reach their policy goals.

Illustrative projects include:

Surveying Adirondack Lakes for Invasive Species

Over the past several summer field seasons of 2018 – 2020, Adirondack Research was contracted by the Nature Conservancy’s Adirondack Park Invasive Plant Program (APIPP) to survey lakes throughout the Adirondacks.  Data collected during these surveys was used to produce individualized lake maps of aquatic invasive species (AIS) distribution. Objectives for these efforts were twofold:

  1. Detect and delineate any new or existing invasive plant or animal infestations within prioritized lakes.
  2. Utilize a Lowrance ELITE-7Ti fishfinder to map the vegetation beds, contour lines and bottom substrate hardness of a select set of those lakes as a way to gather important data on plant distribution and other physical parameters that influence aquatic plant invasion.
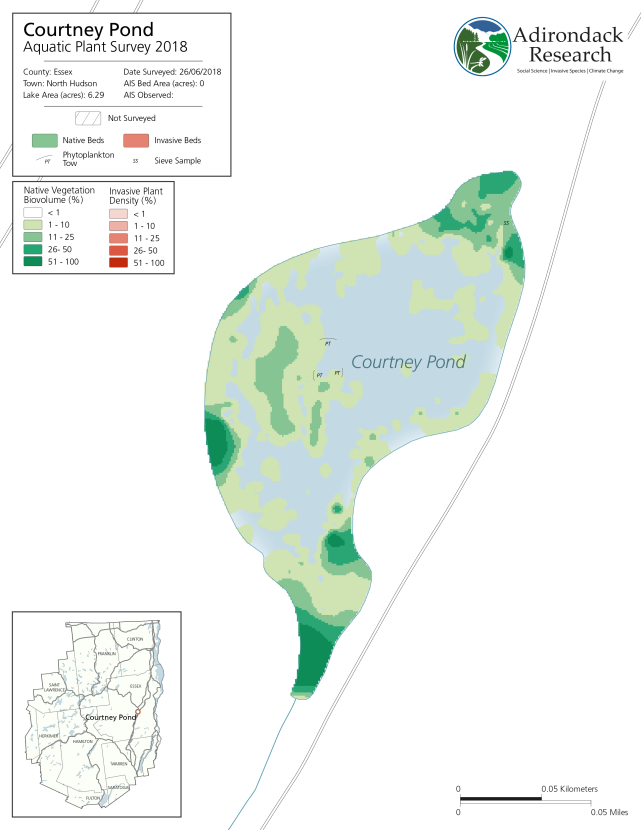
In 2018, Courtney Pond in Essex County was the first year this pond was surveyed and no AIS  detected.

Mapping invasive plant beds is accomplished using a suite of software and hardware tools including GPS, sonar detecting units, C-Map by BioBase, and ArcGIS Pro.  Data from sonar units such as Lawrance Fishfinders can be translated using third party software platforms, including C-Map BioBase and ReefMaster into a format which can be interpolated with ArcGIS Pro to create visualizations of the lake bottom.  This enables staff to assess exactly where an AIS infestation is located within a larger bed of native plants and useful overtime to monitor AIS beds and their spread.  Raster layers generated as part of the work flow are then used to generate maps in ArcGIS Pro and Adobe Illustrator for final reports.  The 2019 report is complete with maps of all lakes or ponds surveyed and can be downloaded here.

Additional information on this and similar Adirondack Research invasive species projects, visit this page.

Lake Placid & Saranac Lake Winter Trails Map
While Adirondack Research makes maps for a variety of purposes to support  geospatial analysis,  ecological species distributions and for land acquisition and conservation easements, the firm also produces a line of recreation and way-finding maps under the brand Green Goat Maps.

As part of this effort, Green Goat Maps emphasizes responsible recreation and environmental stewardship by partnering with organizations to promote principles like Leave No Trace.  Maps also make reference to the proper etiquette for publicly accessible trails, how to prevent the spread of invasive species, and information and regulations specific to the areas covered in each map. Green Goat Maps has  partnered with organizations such as Barkeater Trails Alliance, the Adirondack Land Trust, and The Nature Conservancy Adirondacks in these efforts.
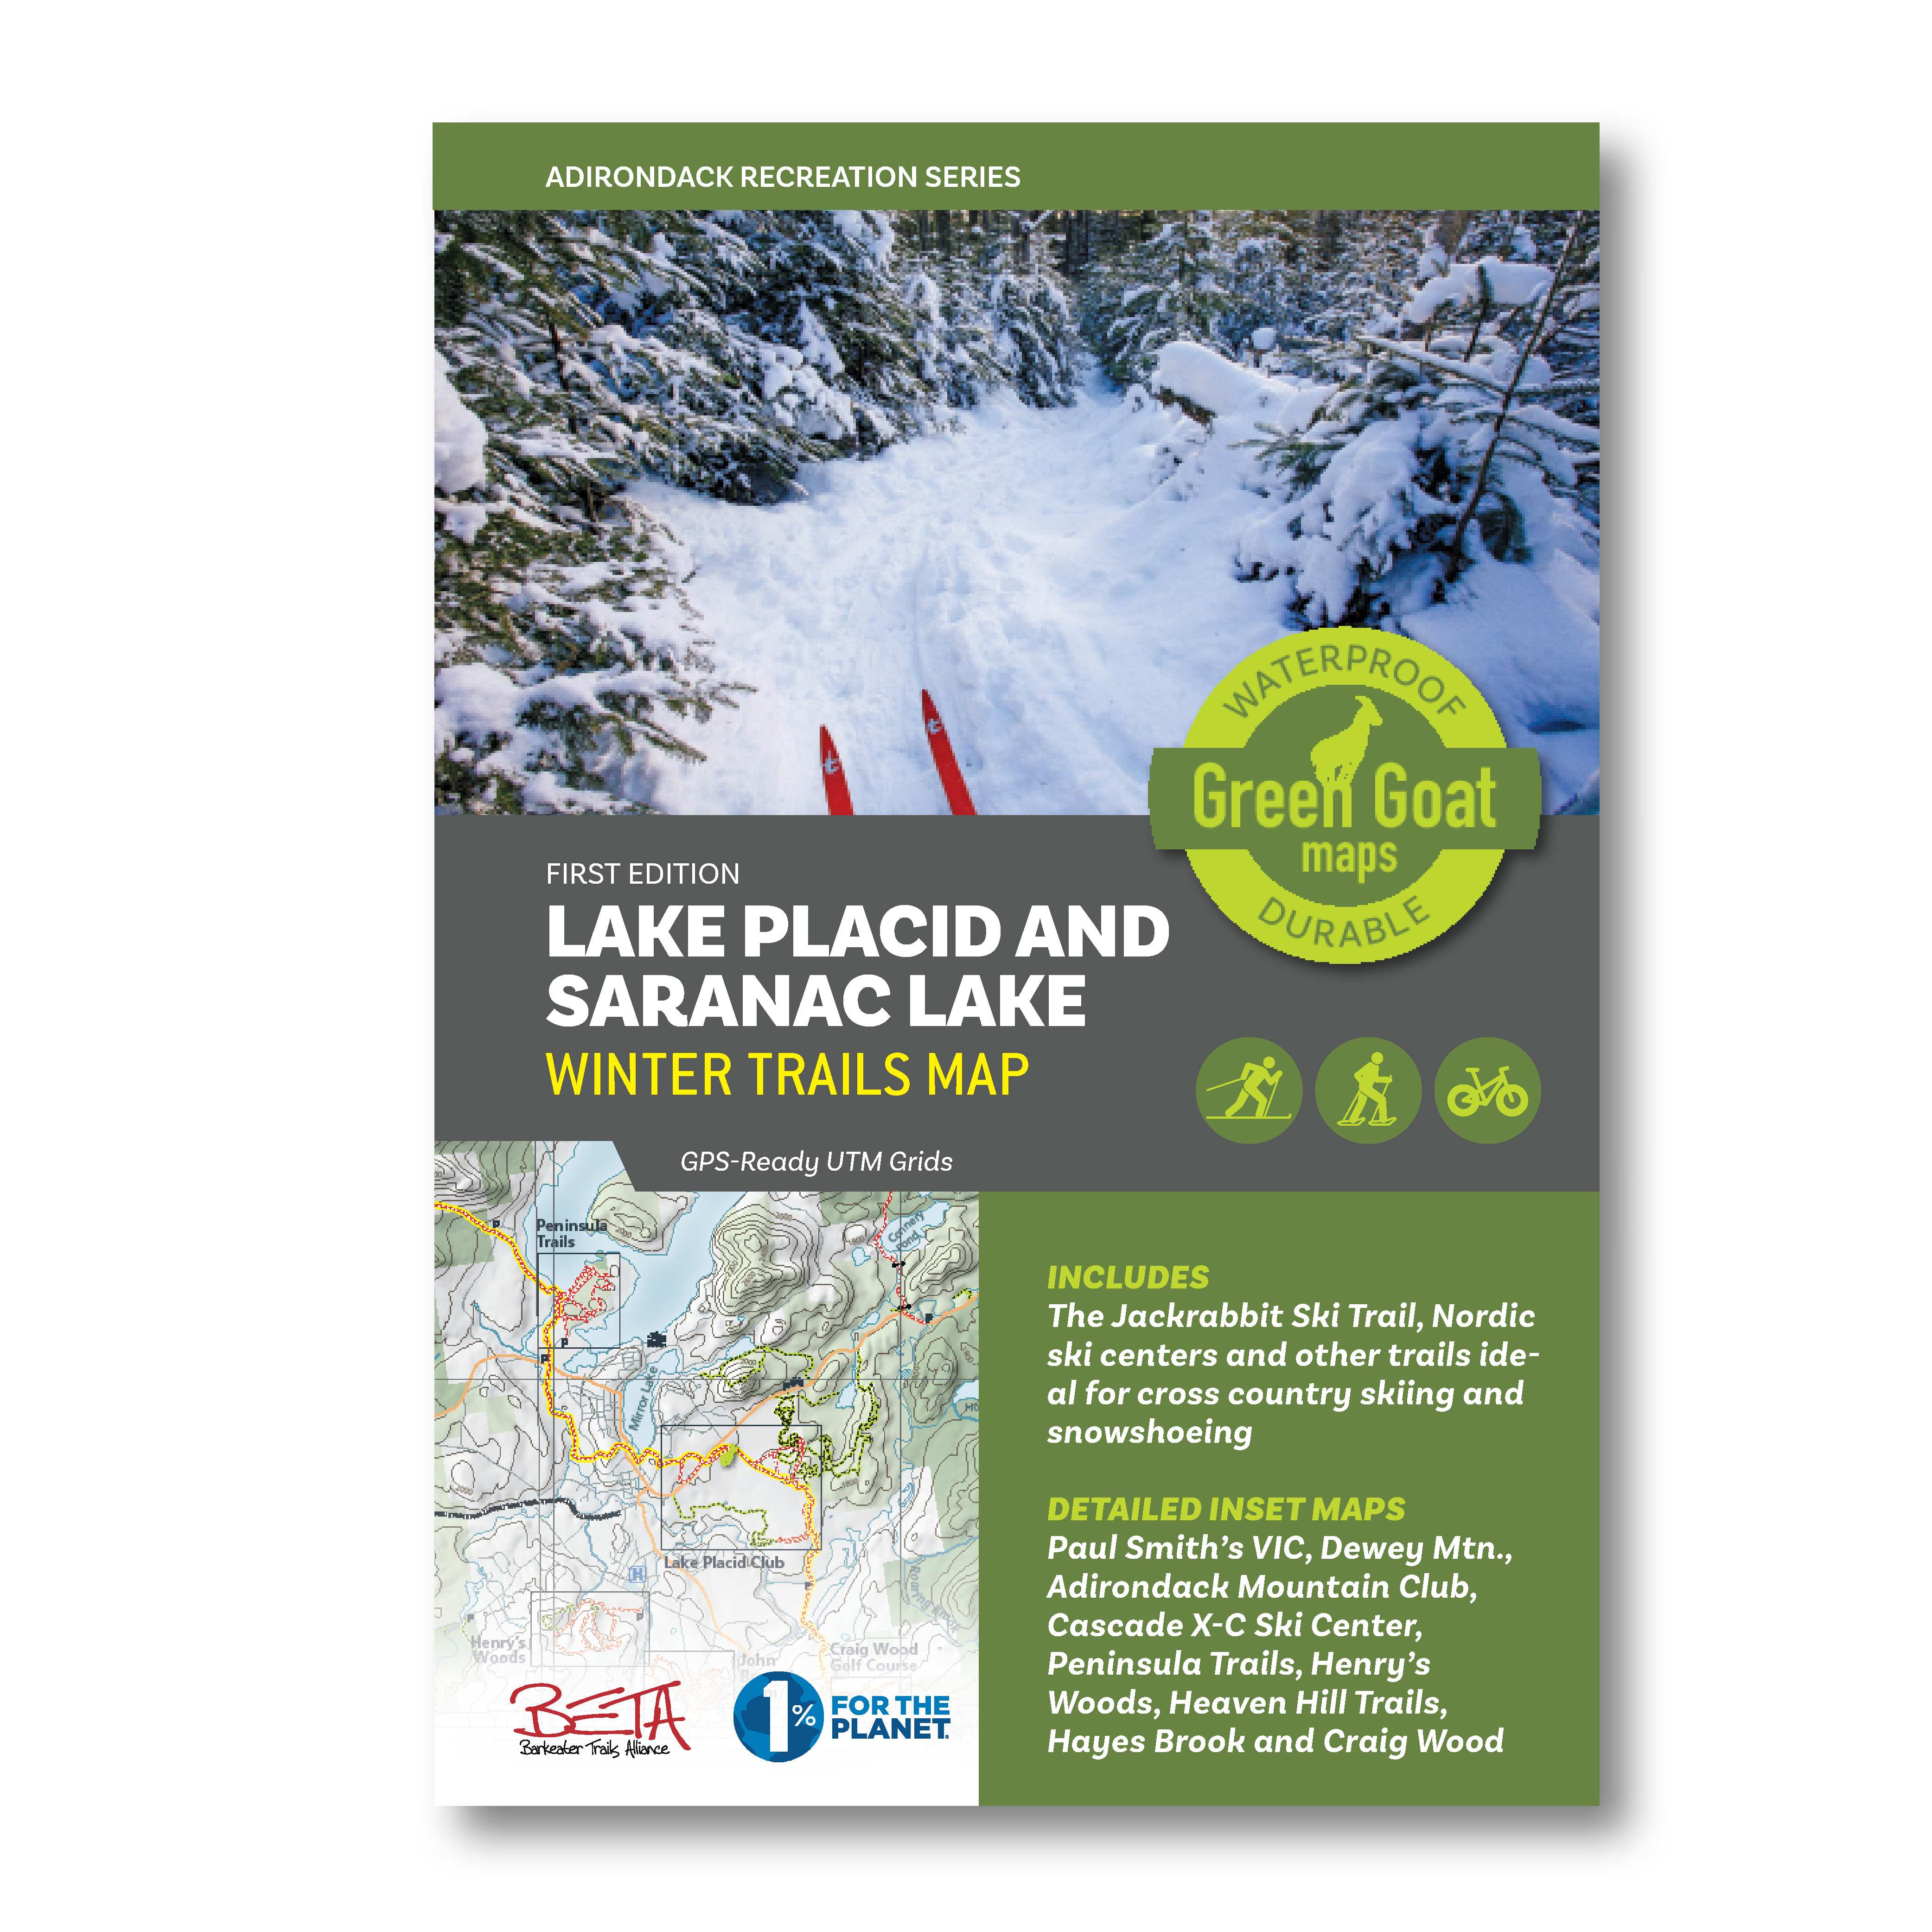
One example of a Green Goat map is the region’s “go-to” map for winter recreation – The Lake Placid and Saranac Lake Winter Trails Map  – which offers all of the area cross country ski, snowshoe and fat bike trails in one document.  The map highlights the Jackrabbit Ski Trail and covers ski trails from Paul Smiths to Wilmington including the popular Hayes Brook Truck Trail, Deer Pond Trails, Moose Pond Trail, Brewster Peninsula Trails, Henry’s Woods, Heaven Hill and more.  The map also includes commercial ski centers, including the Paul Smith’s College VIC, Dewey Mountain Recreation Center, Cascade X-C Ski Center and Mt. Van Hoevenberg.  For the Winter Trails Map, Adirondack Research also added trails on private and municipal land with permissions well as adding gates and parking areas which were mapped from ground research. The top banner on each map inset also shows info about what activities people can do on each individual trail network

Additionally, Green Goat gives 1% back on the sale of its maps to nonprofits through 1% for the Planet.

For more  information on this and similar Green Goat Maps products, visit this page.

Mapping Broadband Infrastructure for Essex County

A current project Adirondack Research is working on is with Essex County (as well as four other counties) and local community leaders towards designing and implementing web mapping  visualization tools which will help support and guide expanded broadband installation across the County.   These easy-to-use geospatial tools are intended to be used by local officials in multiple governments to pinpoint gaps in infrastructure coverage. Other aspects of the project include mapping the boundaries of current broadband contracts with providers across the County, checking and verifying property addresses, and performing quality assurance on plan of record build-outs.
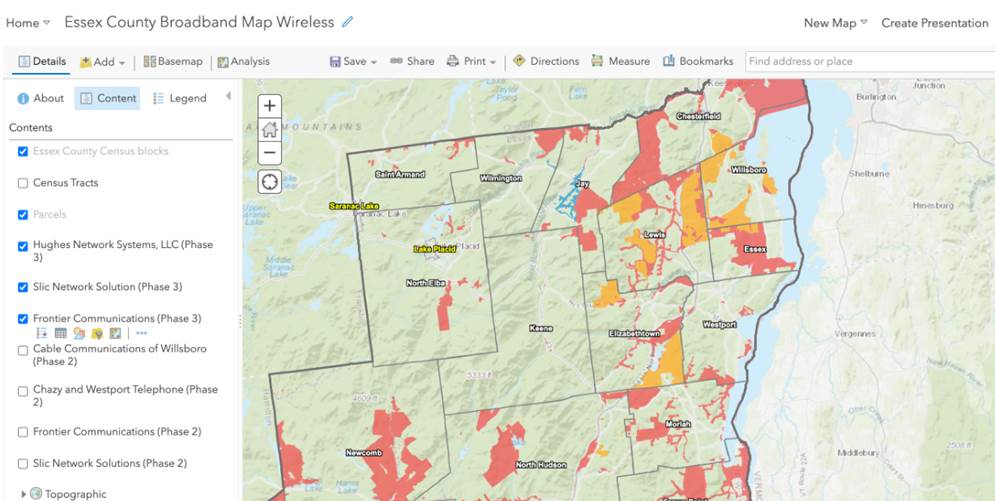
Broadband is only available is specific areas of Essex County. Mapping at the street level by Adirondack Research will enable government officials to work with broadband providers to expand coverage.

Contact:

Ezra Schwartzberg, PhD
Adirondack Research
73 Church St
Saranac Lake, NY 12983
www.akdres.org

D.I.Y MS4: Erie County

The County’s Homegrown Application Provides Mapping and Data Collection Support to the Multi-Agency Western New York Stormwater Coalition

While the  Municipal Stormwater Sewer System (MS4) regulatory program may be taking a back seat in focus to COVID-19 across Empire State governments in 2020, compliance efforts nonetheless continue in the background.  The DEC program has seen governments responding to meet annual submission requirements in a variety of ways ranging from full vendor supported solutions, hybrid approaches of using in-house resources and commercial-off-the-shelf (COTS) products, while others have built the solution totally in-house.  Aka Do-it-Yourself (DIY).

One such MS4 DIY organization is Erie County which provides administrative and technical support to the Western New York Stormwater Coalition (WNYSC) which has a broad geographic footprint.  Erie County took the stormwater management regional lead in western New York in 1999 when it became apparent both Erie and Niagara Counties would be required to come in compliance with the United States Environmental Protection Agency (U.S. EPA) Phase II Stormwater requirements. Recognizing much of the MS4 General Permit was general in context of most permit requirements being the same for all governments, the Coalition was created in 2003 as a means to share work such as public education and outreach, development of policies and procedures, employee training – and mapping.  While the Coalition is not an official Erie County government agency, it is housed administratively inside County offices.
Erie County MS4 Support 

Initial development of the program started in 2012 by the current Director of Erie County’s Office of GIS, Lisa Matthies-Wiza, who was part of a team that designed databases, field applications, and quality assurance plans to manage data collection.  This was facilitated through a series of grants through NYSDEC and partnerships with Erie County and Buffalo State College provided to the Coalition.

More recently, support to the Coalition’s MS4 compliance efforts has been Michael Ruffino who came to the County in March of 2019.  Prior to Erie County, he had experience in the use of ArcGIS Online (AGOL) Survey123 and Collector in Chautauqua County where he was able to incorporate similar apps for the environmental health department septic systems and water supply inspections.  Currently Erie County hosts all of the GIS data and hardware/software infrastructure for the entire WNYSC program.

Continue reading

Focus on Hudson River Flooding Impacts

Online Application Provides Tools and Data for Communities at Risk Along the Hudson River

Background

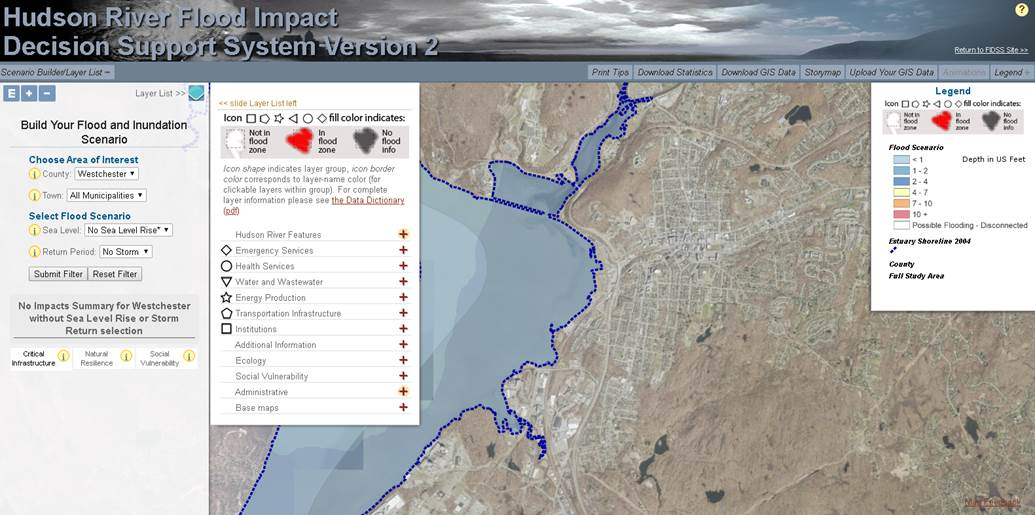
The Hudson River Flood Impact Decision Support System (HRFIDSS) is an online mapping application as well as a collection of geospatial products and data which illustrate the scale of potential flooding for tidally-affected shorelines of the Hudson River Valley and Westchester County coastal communities. In all, the viewer covers the shoreline communities in 11 counties in the region.  Developed by researchers from Center for International Earth Science Information Network (CIESIN), Stevens Institute of Technology, and the Columbia Water Center, the application enables individual residents, community groups as well as municipal and regional planners to evaluate risk based on potential outcomes, and to determine the impact on and effect of social vulnerability, natural resilience, and critical infrastructure.

The tool also provides downloadable estimates of flooding impacts, including affected population and critical infrastructure, and cost estimates of building damage.  It is further enhanced by including hydrological models which expands the flooding impacts to include storm tides/storm intensity and the contributions of river tributaries and streams.

The Hudson River Flood Impact Decision Support System helps address the growing interest across all levels of government in the New York region towards developing better forecasting capabilities and a better understanding of flood probabilities under a variety of sea level rise and storm frequency scenarios.

The application was developed using OpenLayers.  Critical infrastructure data is housed in a relational PostGIS database which are served as a Web Feature Service (WFS) using Geoserver.  Flood layers are raster data published from an ArcGIS Server at CIESIN while supporting imagery layers are consumed from New York State.

Impact Assessments

In addition to a variety of unique mapping tools, one of key features of the application is the generation of “Impact Assessments”.  These are generated by application flood maps using a combination of historical and synthetic flood events which include water depth, surge, rainfall, and  sea level rise scenarios of 0″, 6″, 12″, 18″, 24″, 30″, 36″, 48″, 60″, 72″ as well as 5-year through 1000-year flood zones.  Flood scenarios presented in the mapping tool are accompanied by a set of impact estimates at the local level. These are divided into three themes: critical infrastructure, social vulnerability, and natural resilience features.
Continue reading

Green Map 2020: Evolving with Technology and Staying Community Focused

For nearly 30 years, Green Map has been an anchor in the Metro NYC nonprofit mapping community.  Led by its original founder, Wendy Brawer, Green Map’s portfolio of work and advocacy in locally-led mapping and sustainability efforts is quite impressive.  Since the launch of the Green Map System by Wendy Brawer in 1995 and publication of the original Green Map of NYC through her eco-design company, the program’s engagement tools and mapping resources have been adapted by locally-led projects in 65 countries.   Many joined the Green Map network when Greenhouse – their first content-managed website – was activated in 2007.   The site grew to become a rich resource highlighting community developed mapping work in all parts of the world.

While “green” mapping was one of its early defining products and focus,  the organization has expanded its services to include interactive web mapping, education, multimedia, event coordination, workshops, tours, planning and consulting, and creating software development tools.


Community Engagement Maps and Tools

Green Map’s award-winning icons, tools, platform(s) and tutorials help create engaging and visually powerful mapping content used as guides for local nature, culture, community living, social justice and resources for sustainable living. In addition to providing tools and tutorials on making maps, Green Map promotes their mapping efforts as part of Project Stories.  Project Stories are locally written and use tags to categorize the story type, theme, and purpose. Users can  discover how Green Map projects were created, people and organizations involved and about the project’s impact on their community.   Green Map projects are tagged and can be searched as part of the following 11 categories:

Besides its own mapping platform (with version 2 of the Open Green Map now in beta), the program also offers suggestions and tutorials on how to promote the use of the Green Map icons in other interactive mapping platforms such as ArcGIS Online (Story Maps), CARTO, Google Maps, Google Earth, and the Map of Tomorrow.

Continue reading

COVID Era Geospatial Applications to Support Empire State Communities

Here in southeastern New York State, it’s amazing how fast the COVID wave came and went. At first, mid-March to mid-May seemed like an eternity, but now, not so much.  I likened the preparation for COVID to preparing for Super Storm Sandy.  Albeit phenomenally different, the buildup and the anxiety of waiting for it to show up.  Peering out the windows to see the outcome of a completely different kind of damage and suffering  altogether.  Physical and psychological.  Now July, it seems and feels like we can see the first wave of the pandemic in the rear view mirror.  But then as we refocus on the road in front of us, we know there are speed bumps ahead of us.  Not if, but when.

There were a plethora of interesting and meaningful geospatial viewers created across the state during the mid-March to mid-May time frame.  Most included highlighting COVID case numbers by larger units of geography (municipal or zip code boundaries),  generalized heat or pattern maps, impacts to businesses and institutions, as well as  information on hotlines and sources of assistance.  However, its pretty well documented the geospatial community across the state has struggled with being part of providing detailed spatial analysis or mapping support functions at the address level.   Or for that matter, even being asked to participate in this regard.

Personal health related data is uber protected with its use regulated and governed by the Health Insurance Portability and Accountability Act (HIPPA).  HIPPA  regulations reign supreme and contributed to a lesser involvement of GIS analysts in  providing geospatial content, metrics and analytics during the pandemic.  There is also the unspoken reluctance on the part of the public health community to release data sets  which might be difficult to understand or easily misinterpreted by the general public.  Department of Health  professionals often cautious to release data – particularly in new instances such as the COVID pandemic – and leaving analysis/interpretation  to internal professional staff only.  Ultimately though,  releasing some flavor of the data but in a more generalized context.

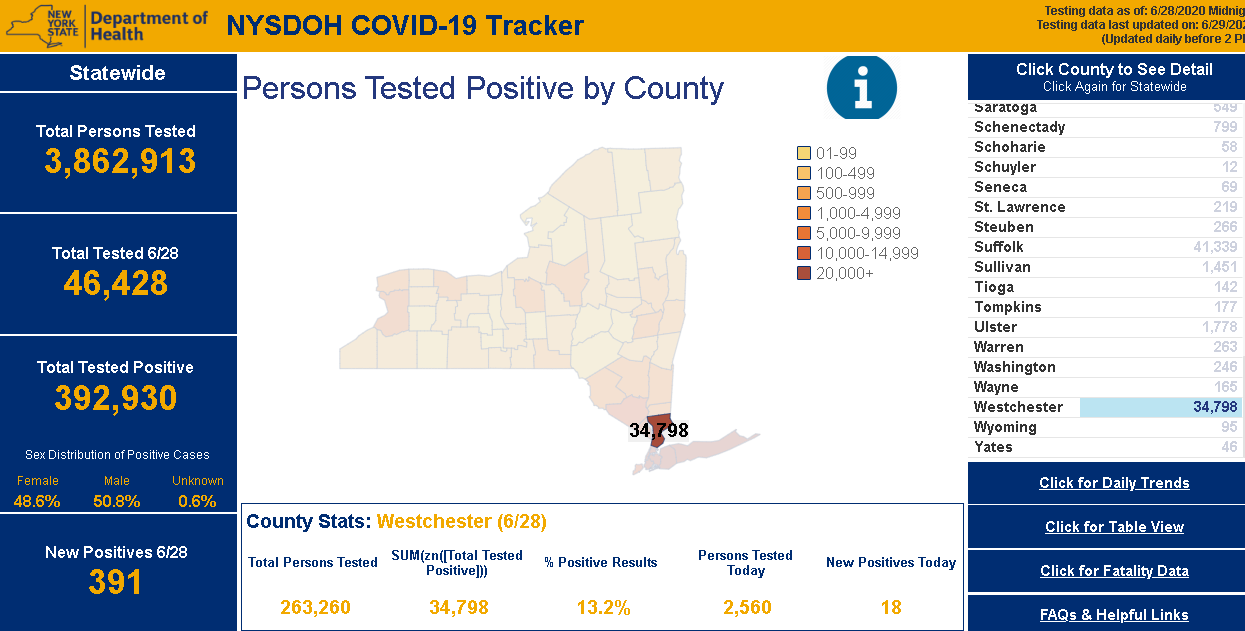
NYS Department of Health (DOH)  COVID-19 reporting has improved dramatically since the pandemic appeared in March.  Though while numbers  are made available only on a county basis, users can access and visualize the data in a variety of ways.  Reporting and posting of the data has become much more timely.  DOH is also now publishing a regional “Early Warning Monitoring Dashboard“.

Continue reading

Google Earth in the Classrooms

Chromebooks, Google Classroom and Google Earth Together Provide a Framework for Teaching Geography and many other subjects in K-12

I actually started drafting an article on Google Earth in the classroom last fall but since then it’s been one thing or another pushing things to the back burner.  Mostly work priorities but then COVID-19 sent everything sideways.  Seemingly pointing us all in a new and uncharted direction.  A new and greater reliance on the internet as many of us found ourselves working remotely.

The remote work force in many of our extended families includes teachers of whom I now have even greater respect after watching what is involved in teaching remotely and online.  The lesson plans, prep work, surgically attached to the computer, and the seemingly endless hours of the encompassing interaction with students – and parents – well beyond the normal eight-hour work day.

In a roundabout way watching this teaching workflow unfold during the COVID lockdown brought me back to the Google Earth article.  Google’s presence in the classroom is ubiquitous built around Google Classroom which I can only imagine will grow immensely as remote K-12 education expands in the future.  Wrapped in with kabillons of lesson plans, templates, covering every education topic, discussion groups, forums, and blogs from around the world – everything built on top of Google technology.  Easily delivered and made available to the masses at all levels of the educational spectrum with the uber cheap and incredibly functional Google Chomebook.  (btw – using one as I type).   And easily accessible within this framework – and bringing me back to the beginning of this article – is the Google Earth product for use in the classroom.  It’s an incredible product to augment K-12 classroom teaching and not just for geography.

Continue reading

10 Questions: Larry Spraker

My guess the name Larry Spraker doesn’t need much of an introduction across the New York State and New England GIS landscape.   His work and contributions since the late 1980s to the geospatial community are many and have included efforts from academia, government, and for many years the private sector.  As well as a ton of volunteer work with GIS user groups and the like. It has been an privilege crossing paths with him in so many ways over the years.  

So depending on the time of day, I recommend grabbing your favorite beverage, pull up a chair and continue reading.  There’s a lot here.  And after you are done, close your eyes and envision Mr. Spraker in another time or comos. Or, as the immortal Rod Sterling would say on the Twilight Zone “Another Dimension”.  Under the bright lights, behind the desk, and waving his hands fevorishly.  Yup, that’s him in his new gig – performing his best Chris Berman “Swami Sez” imitation as he hosts the 6PM ESPN SportsCenter broadcast.

Enjoy.

eSpatiallyNewYork:  Let’s start from the beginning.   The Albany-area boy goes to SUNY Albany for undergraduate and then on to Indiana State for graduate work.  How and when did geography become your educational and professional focus? 

Spraker:  I originally went to UAlbany as a Communications major with aspirations to be a sportswriter. After realizing that was a tough gig that didn’t pay particularly well (at least back in the early 80’s), someone recommended Computer Science. After a few courses, I really liked programming, but hated the high-end math courses such as Calculus and Differential Equations. A minor in Computer Science didn’t require the math courses, so I went to my advisor and asked “What would be a good major with a Computer Science minor?”. He listed a number of majors that included Physics, Math, and the last one he mentioned was Geography. I had already taken 6 credits in Geography as electives, so I asked for more details and somehow this guy had a fair bit of knowledge in this area and explained just enough of cartography, GIS and remote sensing to pique my interest. I registered for Intro to Cartography and Intro to Remote Sensing the next semester and fell in love with the both courses, and quickly found my new major. I focused primarily in Remote Sensing as an undergrad, and my professor, Floyd Henderson, really encouraged me to go graduate school. At the time Indiana State University was a leading remote sensing program, having the first remote terminals into the mainframe computers at Purdue which was the state of the art for image processing software. Floyd knew the professors at ISU, wrote me a recommendation and helped me get a Research Assistantship, so I packed up my car with everything I owned and drove to Terre Haute, Indiana for 2 years and finished my Masters. Although I focused a lot on Remote Sensing, I got exposed to a lot of GIS as well, and by the end of grad school had really got the GIS bug.

As an aside, after I graduated from ISU and came back to the Capital District, Floyd called me and asked me if I would teach his Intro to Remote Sensing and Aerial Photo Interpretation classes while he was away on sabbatical that year. So I returned to SUNY Albany as an adjunct professor and taught his classes that year. When Floyd returned, I stayed on as an adjunct faculty member and transitioned to developing and teaching several GIS courses. I really enjoyed working with the students and ended up teaching at SUNY Albany for 17 years.

Continue reading

Game Time: Mapping Moose in New York State

Introduction

A rare treat in eastern upstate New York, mostly in the Adirondacks, although sometimes in the Taconic Highlands along the Massachusetts and Vermont borders and within the Catskills, is to see moose in the wild.  Moose (Alces alces) are the largest member of the deer family (Cervidae) and the largest land mammal in New York State. Having been absent from the Empire State since the 1860s, the species began to reenter the state on a continuous basis in the 1980s.   While re-establishment of the moose population in New York has been viewed and supported as a positive sign of a healthier, more complete natural ecosystem,  it does not come without a range of potential problems associated with their return and the need for proactive management and monitoring by New York State Department of Environmental Conservation (DEC) wildlife biologists and researchers.

So in 2020 it should come as no surprise that wildlife biologists in New York State – and around the world – are using geospatial technologies to support their work.  In addition to estimating moose population size, New York’s wildlife biologists and scientists also focus on improving moose survival and reproductive rates and to assess their diet and health.  Assisting the DEC’s work towards researching moose habitat and resource requirements is David W. Kramer, Research Scientist, in the Division of Fish and Wildlife.  The toolkit which augments his moose research includes a mixture of GPS, remote sensing imagery, a variety of GIS data layers, and  both ESRI and “R” software.  R being a free, open source software package for statistical computing and graphics commonly used in the research community.

Population Counts and Observations

To date, Mr. Kramer and colleagues have been observing the locations of 26 moose which were collared with either a  Lotek or Telonics GPS unit which can store data “on board” the collar that can then be retrieved by getting the collar back or by getting close enough to the moose to download the data to a receiver. “Uplink” collars can store data on the collar as a backup, but also send daily data uploads via satellite and are then stored online.  Moose are captured (to put the collar on) by a crew which “net-gun” the animal from a helicopter. For their research, DEC staff focuses on female moose (cows) for two reasons:  (1) wanting to track of how many offspring each cow has; the collars facilitate the “following” of the females in the summer to count calves, and (2) male moose (bulls) go through physiological and body changes during the same period that do not make the collaring of males practical or even unsafe.  Data associated with the collars are important in analyzing survival and calving success as well as the geography associated with habitat selection.

Continue reading

Geospatial Business Spotlight: Bergmann (GIS Services and Solutions)

Company Name:               Bergmann (GIS Services and Solutions)

Location:                               Rochester, NY

Website:                                bergmannpc.com

Employees:                        400+

Established:                      1980

Bergmann is a full service, multi-disciplinary design firm employing a wide range of professionals and practitioners in the geospatial  industry.  The company represents four decades of a culture built on the work of client-focused experts. Its core business segments include Transportation Systems, Civil Works, Building Design, Land Development, Community Planning & Design, and Program Services.  Within these areas, Bergmann’s rich portfolio of work features everything from restoration of historical landmarks, to the comprehensive bridge and highway design, to waterfront master planning.  Specific client geospatial support services include:
  • Client Consulting: enterprise strategy, system planning & GIS coordination.
  • Implementation & Support: architecture design, system configuration & optimization & technical support.
  • Software Development: software extensions (ArcGIS & Geocortex), custom solutions (web/mobile/desktop) & system integration.
  • Data Services: database design, data development, and management & data migration.

The Bergmann GIS Services team is a nationally recognized leader in the field of Geographic Information Systems (GIS).  Project Managers, GIS developers, GIS analysts, and 3D Design Specialists offer clients advanced and unique technical skillsets to solve complex information challenges. The company focuses on building strong, collaborative partnerships with clients to create applications, data, and workflows which bring efficiencies and value.

Continue reading

The Definitive Map for New York State Media Arts

New Online Application Shows Locations and Services for Organizations and Artists Across the State

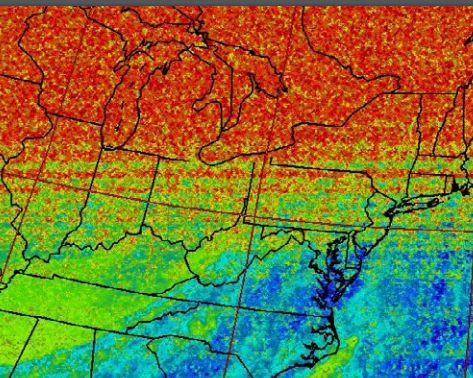
Image from Heidi Neilson’s Southern Florida Beachball Antenna Archive (2017)

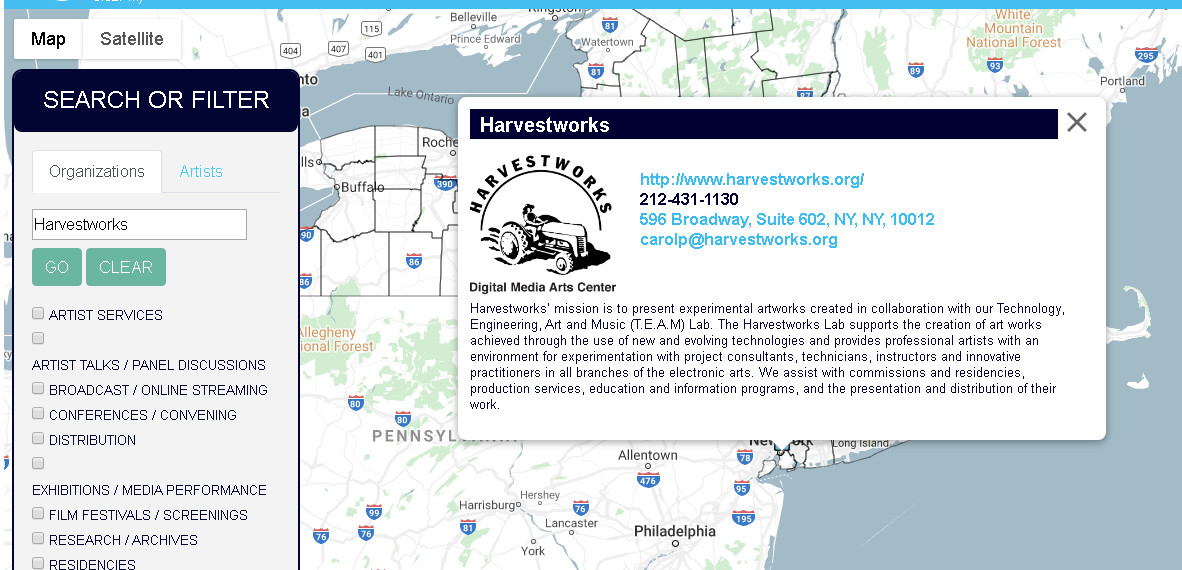
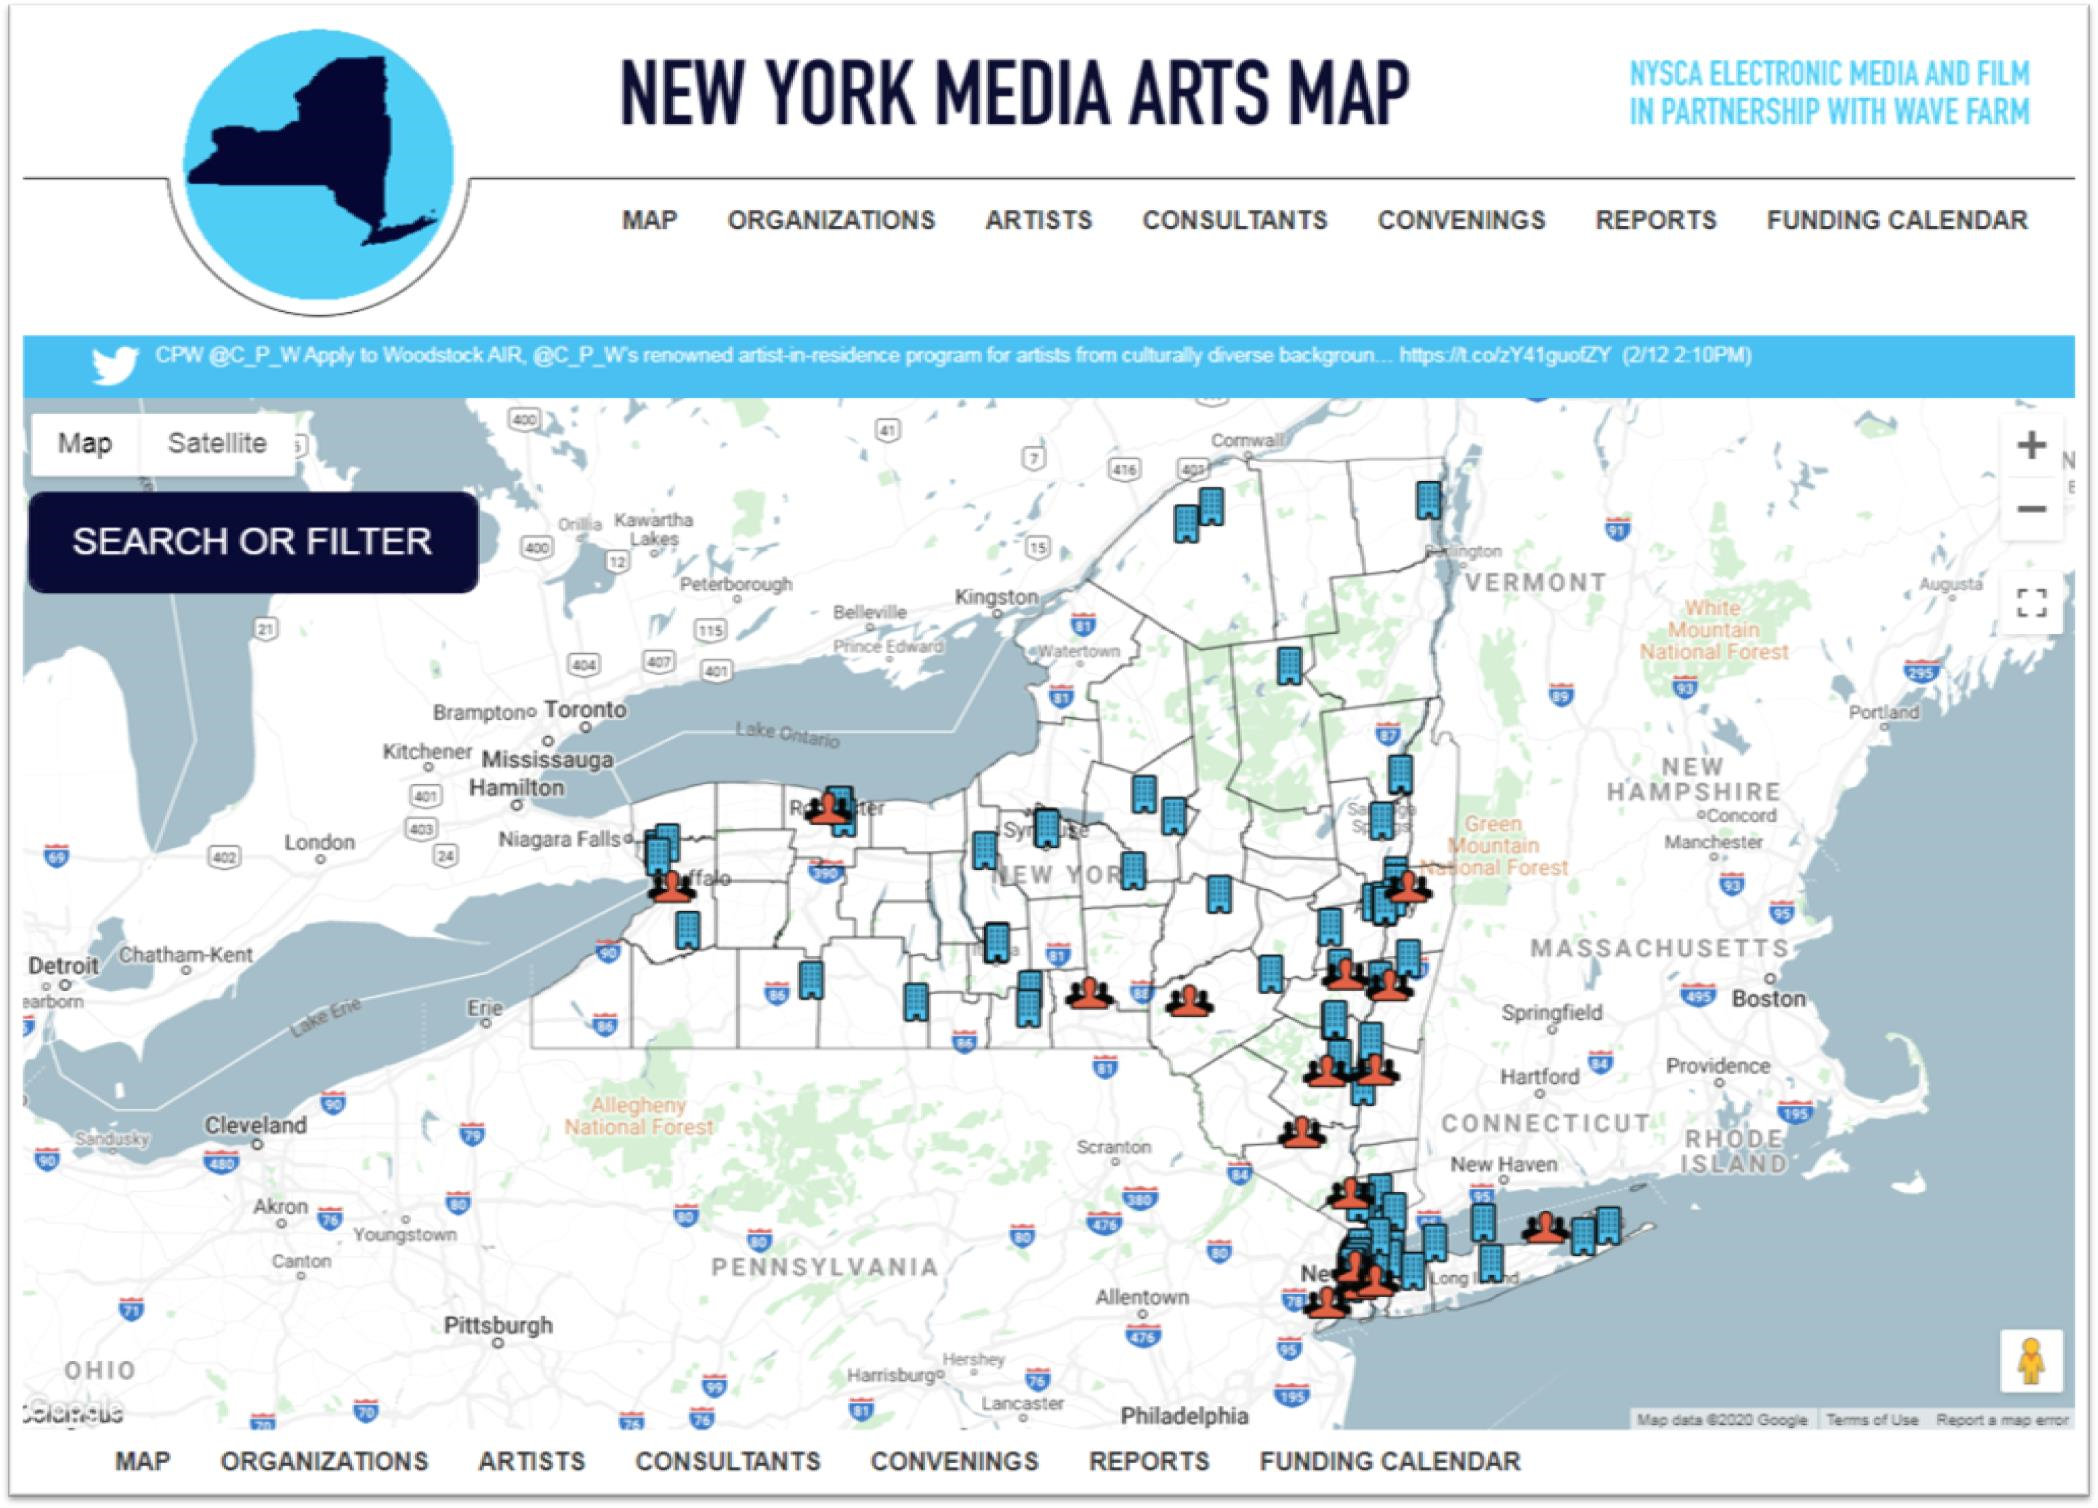
While the Empire State geospatial community is accustomed to seeing terms such as Google Maps JavaScript API, GeoJSON, and HTML as part of the conversation in building online mapping applications for government and business, we increasingly see the use of these same online mapping development tools in the nonprofit sector as well.  One such example is the newly updated New York Media Arts Map which is a project of of the New York State Council on the Arts (NYSCA) Electronic Media and Film program, managed by Wave Farm.  Though Wave Farm is more commonly recognized as an arts organization dedicated to transmission arts with FM and online radio stations, it is their regrant partnership through NYSCA which ultimately led to its stewardship of the online Media Arts Map. Serving in this capacity, Wave Farm assists in administering and distributing grant funds, ranging from $500 to $10,000, to dozens of New York State individual artists and organizations – all of which are included in the Map.

The Map

At its core, the Map is an extensive online catalogue of Media Artists, whose interdisciplinary work includes a wide range of fields including visual art, film, computer graphics, data visualization, sculpture, architecture, music, photography – even drones – and much more. The Map lists organizations which are recent grantees of the NYSCA Electronic Media and Film program (EMF) and the Media Arts Assistance Fund (MAAF).  In all, there are 198 organizations and 69 artists included in the Map.  First launched in 2009 and originally hosted by Rhizome, the 2014 update is the work of Peter Berry who is a developer affiliated with Supercosm, a Seattle, WA based firm which focuses on work with nonprofits.  In addition to the software components already mentioned, Peter’s work on the back end of the map includes the use of open source pieces CakePHP and Apache bundled with MySQL.

In addition to providing location information on organizations and artists included on the map, pull down menus along the top tool bar include additional statewide media arts information on meetings and workshops, partnership reports, and information on funding opportunities.

The Search box offers a wide range of options to filter the organization/artist database. Search queries provide a description of the types of work, services, and types of media arts offered as well as online contact information.

Intersection of Media Arts and Technology

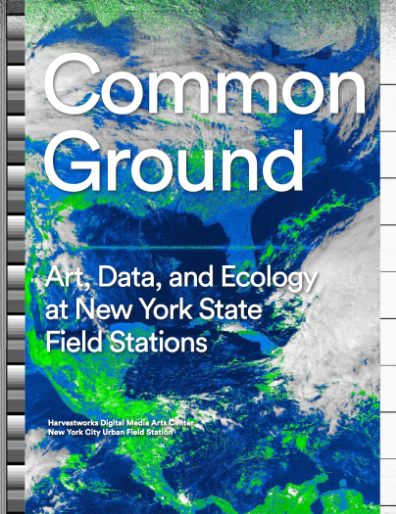
It’s interesting to see, albeit even on some small level, how  the media arts world finds itself close to the geospatial space.  For example, take the work of  Harvestworks which supports the creation of art works achieved through the use of new and evolving technologies and provides an environment for experimentation with project consultants, technicians, instructors and innovative practitioners in all branches of the electronic arts.  A recent report by the organization entitled Common Ground provides “an overview of how and where transdisciplinary work is taking place in New York State, and makes recommendations to encourage further opportunities for artists that, when combined with environmental research, can aid engage the public, encourage environmental stewardship, and benefit communities”.

The report was published by the Harvestworks Digital Media Arts Center and The New York City Urban Field Station which is a partnership of the U.S. Forest Service, New York City Department of Parks and Recreation, and the Natural Areas Conservancy. (The Field Station in NYC supports the Arts and Humanities Residency Program. Check out the Summer 2018 Moon Arrow project – a time lapse compilation of the Moon Arrow pointing to the moon on New York City shorelines).  Open data, building code and hackathons in the geospatial space of your interest?  Then take a look the work of the School for Poetic Computation.  And how about drones?  While the technology is evolving incredibly fast, there was the 2018 Art Omi, Wave Farm and eteam live performance of The Aerial Actor which focused on the rising use of drones in science and art.  Actual drones were used as both carriers of messages and actors in the performance.  “The Map is a vital resource identifying art and technology projects and activity throughout New York State supported by NYSCA Electronic Media & Film”, says Galen Joseph-Hunter, Executive Director, Wave Farm. “It is also a useful tool for showing a geographic picture of how support is distributed throughout the state.”

Summary

So stop for a minute, grab a cup of coffee and put down the pen, I mean your mouse, and take a deep drive into the New York Media Arts Map site.  See what’s in your region, maybe even your neighborhood.  Support the statewide media arts community.  Cool stuff – all from the traditional artistic settings to the avant garde and experimental.  And sometimes, just a one-off from the geospatial space we work in.

Enjoy.

Contact:

Galen Joseph-Hunter
Executive Director
Wave Farm
Radio: WGXC 90.7-FM, Transmission Arts, Grants
518-622-2598
galen@wavefarm.org